Phase diagram of diluted Ising ferromagnet LiHoxY1-xF4
Abstract
We present a systematic study of the phase diagram of LiHoxY1-xF4 () Ising ferromagnets obtained from neutron scattering measurements and mean-field calculations. We show that while the thermal phase transition decreases linearly with dilution, as predicted by mean-field theory, the critical transverse field at the quantum critical point is suppressed much faster. This behavior is related to competition between off-diagonal dipolar coupling and quantum fluctuations that are tuned by doping and applied field, respectively. In this paper, we quantify the deviation of the experimental results from mean-field predictions, with the aim that this analysis can be used in future theoretical efforts towards a quantitative description.
I Introduction
The LiF4 family, where is a rare-earth element, provides a series of materials for the study of magnetic dipolar interactions with negligible nearest- neighbor exchange coupling Als-Nielsen et al. (1974); Hansen et al. (1975); Misra and Felsteiner (1977); Magariño et al. (1980); Mennenga et al. (1984); Kraemer et al. (2012); Babkevich et al. (2016). Among them, the three-dimensional Ising ferromagnet LiHoF4 has attracted much theoretical and experimental interest, offering a simple and well-understood Hamiltonian. The system is ferromagnetic below a Curie temperature of K, and undergoes a quantum phase transition (QPT) when a field of 50 kOe is applied transverse to the Ising axis Beauvillain et al. (1978); Christensen (1979); Chakraborty et al. (2004); Rønnow et al. (2007). The strong crystal field single-ion anisotropy at the Ho site results in an Ising groundstate doublet. However, unlike many other anisotropic dipolar-coupled systems where the same energy scale is relevant to the anisotropy and quantum fluctuations, LiHoxY1-xF4 remains Ising-like well into the paramagnetic state above the critical transverse field () Schechter and Stamp (2008). At low temperatures, the ferromagnetic state is a result of competition between dipolar interactions which promote magnetic order and transverse magnetic field which introduces quantum fluctuations to destroy the ordered state. The role of the hyperfine interactions on the phase diagram close to the quantum critical region is discussed in Refs. Schechter and Stamp, 2008; Rønnow et al., 2007, 2005. Careful studies of the excitation spectra while tuning through the quantum critical point (QCP) have revealed that the hyperfine coupling to the nuclear spin bath forestalls the electronic mode softening expected for a quantum phase transition. As a result, the ferromagnetic-paramagnetic phase boundary at is strongly modified by the hyperfine interaction.
The ability to dilute Ho3+ sites with non-magnetic Y3+ ions provides a rich arena to explore how disorder and quantum fluctuations affect the magnetic properties and collective phenomena Schechter and Stamp (2008); Silevitch et al. (2010); Reich et al. (1990); Tabei et al. (2006). The LiHoxY1-xF4 system adopts the scheelite structure for all values of and allows a systematic study of dilution of magnetic moments from a correlated ferromagnet to a single-ion state. Ferromagnetic order persists with decreasing until a critical Ho concentration is reached Alonso and Fernández (2010). Below , the induced local randomness is effective enough to destroy long-range order. The nature of the highly diluted systems for has been debated in a series of experimental and theoretical reports. Some studies have reported that there exists a transition into a spin-glass state, however numerical calculations were not able to find evidence for a spin-glass transition Wu et al. (1993); Tam and Gingras (2009); Rosenbaum (1999); Reich et al. (1990); Biltmo and Henelius (2007, 2008). The interplay between frustrated dipolar coupling, local disorder induced by chemical doping, and quantum fluctuations due to a transverse field enhance the complexity of the system, which make the correct interpretation important Schechter et al. (2007); Ghosh et al. (2002); Reich et al. (1987).
In order to clarify the ambiguities of the very diluted phases, first one needs to properly understand the role of the above mentioned terms on the diluted series, where the long-range order is shown to survive Silevitch et al. (2007). It has been argued that in LiHoxY1-xF4 when , due to the breaking of symmetry, transverse couplings between Ho3+ moments no longer cancel out which leads to additional longitudinal and transverse internal random fields Schechter and Stamp (2008); Tabei et al. (2006). Correction for these terms in the effective Hamiltonian leads to a modification of the ferromagnetic-paramagnetic transition in LiHoxY1-xF4 (). Even though considerable studies have been performed on LiHoxY1-xF4, especially on very diluted concentrations, a detailed comparison of a series of compounds is missing. In this work we systematically track the evolution of disorder by gradually doping the ferromagnetic systems with . For all concentrations the classical and quantum critical points are measured by means of neutron scattering. The ordered moment and critical scattering are traced as a function of , and the entire phase diagrams are mapped. For theoretical comparison, mean-field calculations were performed, and the discrepancies with experimental data are quantified. The experimental dependence of on Ho3+ concentration could be reproduced provided the ordered moment is reduced.
The outline of the paper is as follows: In Sec. II a basic introduction to mean-field calculations of LiHoxY1-xF4 is given. Neutron scattering measurements as a function of temperature and magnetic field are discussed in Sec. III and results are compared to simulations. The differences between measured and theoretical results are analyzed in Sec. IV and the probable reasons for the observed discrepancies are discussed.
II Phase diagram studies by mean-field calculations
The full rare-earth Hamiltonian was diagonalized within the virtual-crystal mean-field (VCMF) approximation, widely used to solve the mean-field Hamiltonian of composites. The magnetic moment operators of Ho3+ and Y3+ ions at site are labeled as
| (1) |
The virtual crystal method uses a homogeneous approximation with a composite moment where is the proportion of Ho3+ ions. Although in the present case the dilution is made by non-magnetic Y3+, this approach can be equally well applied for a mixture of magnetic ions, e.g., Ho3+ and Er3+ Piatek et al. (2013). The numerical algorithm is essentially a simple mean-field calculation, with the difference that VCMF not only mixes site-specific mean-fields, but also the ion type specific mean-fields Kraemer et al. (2012). If there exists only one kind of rare-earth ion in the system, VCMF is equivalent to a mean-field treatment Rønnow et al. (2007).
The complete Hamiltonian of the system includes five terms,
| (2) | |||||
where is the crystal field, is the hyperfine coupling of Ho3+ ion to its nuclear spin, the Zeeman effect, the dominant dipolar interaction, and the nearest neighbors Heisenberg exchange interaction. Owing to spin-orbit interaction, in the groundstate. The hyperfine coupling constant of Ho3+ is taken to be eV as reported from hyperfine resonance and specific heat measurements Magariño et al. (1980); Kjaer et al. (1999); Kovacevic et al. .
The crystal-field parameters used in this study are those reported in Ref. Rønnow et al., 2007. We assume that the crystal field surrounding a Ho3+ ion is not perturbed significantly by dilution Babkevich et al. (2015). The crystal field splits the ground state of Ho3+ for point symmetry into four doublet and nine singlet crystal-field levels, where the lowest crystal-field level is a doublet. Its wavefunction is a linear combination of . The dominance of high contributions give it an Ising anisotropy. The next crystal-field level is found at about 11 K. The strength of the superexchange coupling, , was fixed to eV in our calculation. Furthermore, to account for the strong -axis fluctuations established by the expansion Rønnow et al. (2007), the mean-field, i.e., the ferromagnetic interaction times the local magnetic moment, is scaled by the factor 0.785 in combination with a minute adjustment of the crystal field. The results derived in this effective MF approximation are found to agree accurately with the predictions of the first-order theory in at , and also, the effective VCMF in the dilute case accounts in an acceptable way for that obtained when combining the expansion with the coherent potential approximation (CPA) (see Ref. Jensen, 1984). Within the effective MF approximation, the calculated is higher than found experimentally for LiHoF4 of K. Indeed, the phase boundary close to cannot be accurately reproduced theoretically and remains an outstanding problem Chakraborty et al. (2004); Tabei et al. (2008); Dunn et al. (2012). The long-range nature of dipole-dipole interactions was treated by splitting the dipolar fields’ summation into a short-range discrete sum over 50 unit cells and a continuous integration towards the sample boundaries assuming a spherical shape of the sample Tabei et al. (2008); Jensen and Mackintosh (1991).
The homogeneous distribution of the ions within the lattice implies that off-diagonal interactions cancel out due to symmetry. Therefore, local randomness and frustration will not be accounted for in this picture. As will be discussed later, these absent terms play an important role on the critical properties of the diluted systems and neglecting them results in discrepancies with experimental observations.
III Neutron diffraction
Neutron scattering measurements were performed on single-crystals of LiHoxY1-xF4, grown by the Bridgman technique with nominal Ho3+ concentrations of , 0.33, 0.46 , 0.67, and 1. In order to reduce the neutron absorption, all compounds were synthesized from isotopically enriched 7Li (99.9%). The Ho3+/Y3+ ratio was checked by means of energy-dispersive x-ray spectroscopy, and the nominal Ho3+ concentration was confirmed to be accurate to within 1% through density measurements of the crystal with a differential air-liquid weighing technique. The density effect of the utilized liquids was negligible since similar results were obtained using water, ethanol, and isopropanol. The surface tension of the liquid was effectively reduced by using thin copper wires with a diameter of 50 m to carry the samples. The crystal structure of LiHoxY1-xF4 crystallizes in space group . The lattice parameters slightly vary with and are approximately Å and Å.
The experiments on crystals with , 0.46, 0.83, and 1 were performed on the E4 two-axis diffractometer at the Helmholtz-Zentrum Berlin. The crystals with and 0.67 were measured on the RITA-II triple-axis spectrometer at the Paul Scherrer Institut and the D23 and D10 diffractometers at the Institut Laue Langevin, Grenoble.
To improve the thermalization of the samples below 1 K, crystals were glued with Stycast onto sample holders made of oxygen-free copper. The samples were mounted inside a dilution refrigerator and vertical field superconducting magnets. Scans were performed in the scattering plane such that the magnetic field () was applied along the crystallographic -axis. Scans were centered on the reflection, and the wavevector of the incoming neutron beam was selected in the 2.56–2.66 Å-1 window in different series of the measurements.
Due to ferromagnetic order in the LiHoxY1-xF4 systems studied, for a given reflection the total neutron scattering cross-section is composed of both nuclear and magnetic contributions. In this paper, we shall focus on the intensity due to magnetic scattering, i.e., , where is the total intensity and is intensity from nuclear scattering which we obtain from measurements above . Since neutron scattering from ferromagnetically ordered compounds is proportional to the square of the ordered moment perpendicular to , one can extract the phase transition temperature (or equivalently the field) at which the compounds order magnetically. Resolution-limited Bragg peaks at base temperature in the ferromagnetic phase indicate long-range order in all samples. To fit the crystal rotation scans we have used,
| (3) |
where is the scattering intensity from long-range order, centered at ; in our scattering geometry and zero applied field , where is the magnetization along . In our measurements , where denotes the amplitude of critical scattering described by a Lorentzian . A convolution with a Gaussian is made to account for the instrumental resolution.
III.1 Temperature dependence

Figure 1(a) shows transverse scans through the reflection in the sample at three different temperatures close to K. In this compound, nuclear scattering dominates reflection intensity. Scans at each point in temperature were extended in reciprocal space such that the diffuse component as well as the Bragg scattering were covered. Figure 1(b) shows the onset of long-range magnetic order close to as indicated by the increase in the Bragg peak intensity. Critical scattering is found to be strongest at the phase transition as expected. This data is representative of the salient features found from neutron scattering in the other samples.

Figure 2 shows the temperature dependence of the magnetic scattering at the (200) Bragg point for increasing Y3+ content in LiHoxY1-xF4. For better comparison, for all compounds the contribution of nuclear scattering has been subtracted from the total intensity using measurements in the paramagnetic state. We consider the ratio of the magnetic to nuclear scattering [] which is normalized by the magnetic scattering cross-section of the parent compound LiHoF4 at base temperature []. With increasing Y content shifts to lower temperatures. At the same time, the total strength of scattering is also reduced – as expected since magnetic Ho3+ ions are replaced by non-magnetic Y3+ ions. For the compound, largest intensity is observed above base temperature. The origin of this effect is not clear. We note that weak scattering from critical fluctuations is also observed, as already discussed for . The line-shape of the critical scattering seems comparable for the , 0.46, and 0.67 samples, as well as the ratio between the base temperature intensity and the maximum intensity of the critical scattering at the transition point. Within the instrumental resolution, we did not find a significant contribution from critical scattering for samples with and 1.

| 0.25 | 0.46 | 0.67 | 0.83 | 1.00 | |
|---|---|---|---|---|---|
| (K) | 0.25(1) | 0.677(4) | 1.04(3) | 1.24(1) | 1.530(2) |
| (kOe) | 5.73(8) | 11.9(1) | 21.5(6) | 36.0(6) | 47.3(1) |
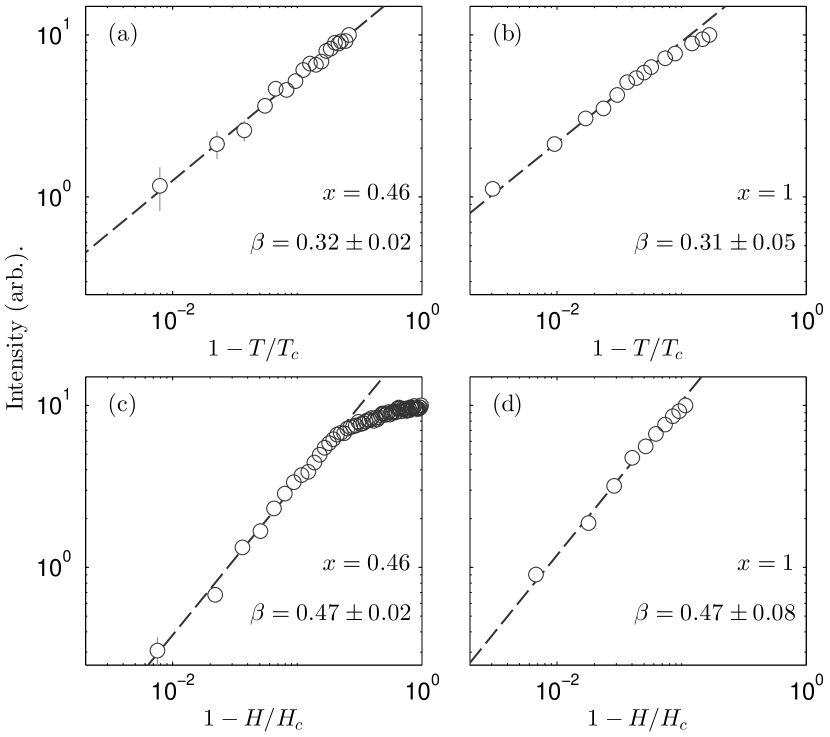
In order to extract a value of for each compound we employed power-law fits in the vicinity of using the standard definition in the fitting, where . The values of found for each compound are listed in Table 1. In Figs. 3(a) and 3(b) we show the power-law temperature dependence of Bragg peaks for the and compounds. In both cases we find a value of that corresponds to the renormalization group result of for the three-dimensional Ising model.
Figure 4(a) shows the results of our measurements. The extracted critical temperatures are in good agreement with the susceptibility results reported previously in Ref. Reich et al., 1990. For high Ho3+ concentrations of , linear suppression of by doping Y3+ is observed in agreement with the predictions of mean-field theory . A comparison of the experimental and measured values of obtained is shown in Fig. 4(b). When the Ho3+ concentration is lowered below , deviates significantly from mean-field approximation. This is shown experimentally in Fig. 4(a) to be related to the onset of the spin-glass phase. Below a marginal concentration around ferromagnetic ordering is circumvented by the interplay of disorder and frustration arising from the anisotropy of dipolar interaction. On further dilution the cross over temperature decreases to zero and for concentration around there is no spin freezing at all. This phase is referred to as spin liquid anti-glass or decoupled cluster glass due to its unusual behavior Ghosh et al. (2002).
III.2 Transverse field dependence
To study the effect of the transverse magnetic field, neutron scattering measurements were performed with field perpendicular to the scattering plane, along the crystallographic -axis. In the zero field cooled (ZFC) measurements, where the samples were cooled in zero field down to base temperature ( mK), the resolution-limited magnetic Bragg peak revealed the presence of the long-range order in all compounds, as discussed in Sec. III.1. However, below around 67% Ho3+ concentration a path dependence was observed depending on the annealing protocol and long-range order was entirely suppressed in the sample in field cooled studies.Kraemer (2009) We will address these interesting results elsewhere and only focus on ZFC measurements here.

Crystal rotation scans through the magnetic reflection were performed to simultaneously investigate the order parameter and diffuse scattering as a function of transverse field. Figure 5(a) shows typical rotation scans on concentration at three different magnetic fields: below, at, and above the critical field. As can be observed at the tails of the Bragg peak [see Fig. 5(a) inset], critical scattering is enhanced close to . The analysis of the scans was treated in in the same way as zero field temperature dependence studies. The intensity of the Bragg peak is proportional to the order parameter squared, and the critical scattering extracted using Eq. 3 is shown in Fig. 5(b).
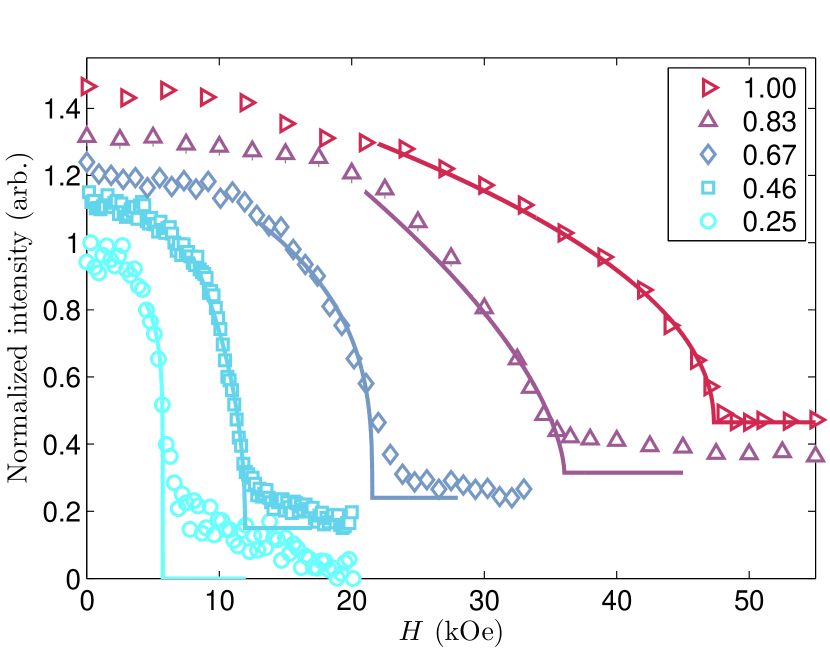
The normalized Bragg peak intensity of the measured compounds as a function of is shown in Fig. 6. We can accurately extract the critical fields at different Ho3+ concentrations by power-law fits to the intensity close to . In the pure LiHoF4, the intensity of the (200) reflection gradually decreases, with magnetic contribution vanishing at 47.3(1) kOe. Above 50 kOe, we again observe an increase of scattering by about 10% at 100 kOe which we attribute to the magnetization of Ho3+ moments along the field direction which is out of the scattering plane. This effect is also captured in our mean-field calculations. We find no sign of critical scattering within the instrument resolution. In the case of there is a steady decrease of intensity above kOe. Surprisingly, in our measurements the (200) reflection at base temperature and 80 kOe has less intensity than above at 2 K and in zero field. That is, there is less scattering in the quantum paramagnetic state than from the crystal lattice by approximately 20%. The origin of this is unclear to us but may be related to a structural distortion or a straining of the crystal under a magnetic field leading to a change in the extinction contribution. The measurements on , 0.46, and 0.25 are qualitatively similar with decreasing on decreasing . The evolution of the order parameter as a function of temperature (Fig. 2) and magnetic field (Fig. 6) near the critical points differ. The thermal transition is well-defined in Fig. 2. However, a long tail above (for ) is observed. This could be due to a difference of critical fluctuations close to and ; or possibly a signature of a crossover into a quasi-spin-glass phase predicted by numerical calculations Andresen et al. (2013). A summary of the extracted values of are listed in Table 1. In Figs. 3(c) and 3(d), we show that , which is close to the mean-field exponent of 0.5. Within the uncertainty of the fits, the critical exponent does not change on dilution.
III.3 Magnetic phase diagram

Neutron scattering allows us to accurately extract the temperature and field dependence of the order parameter. The quenching of ferromagnetic order, is indicated by the disappearance of magnetic scattering. By these means we have mapped out the temperature-field phase diagram of LiHoxY1-xF4 for , 0.46, 0.67, and 0.83 as shown in Fig. 7. The data for the concentration were extracted from ac-susceptibility measurements reported by Bitko et al.,Bitko et al. (1996). Our measurements of the magnetic phase boundaries are in excellent agreement with those previously obtained from ac-susceptibility measurements for and 0.65 Silevitch et al. (2007). Our data can be readily compared to virtual-crystal mean-field calculations. The field values have been scaled to match the low temperature range of the experimental data. Doing this improves the phase boundary comparison, and helps the zero temperature extrapolation. The scaling factor increases from 1 for the pure compound to 4 for the sample, which shows the enhancement of the discrepancy from mean-field by the introduction of frustration and disorder into the system. In all systems studied, we find that the critical field is enhanced below approximately . This enhancement is well captured in our calculations by the introduction of hyperfine coupling. As has already been discussed in Sec. III.1, mean-field calculations do not agree very well with experiment close to predominantly due to the absence of fluctuations in our model [see Fig. 4(b)].
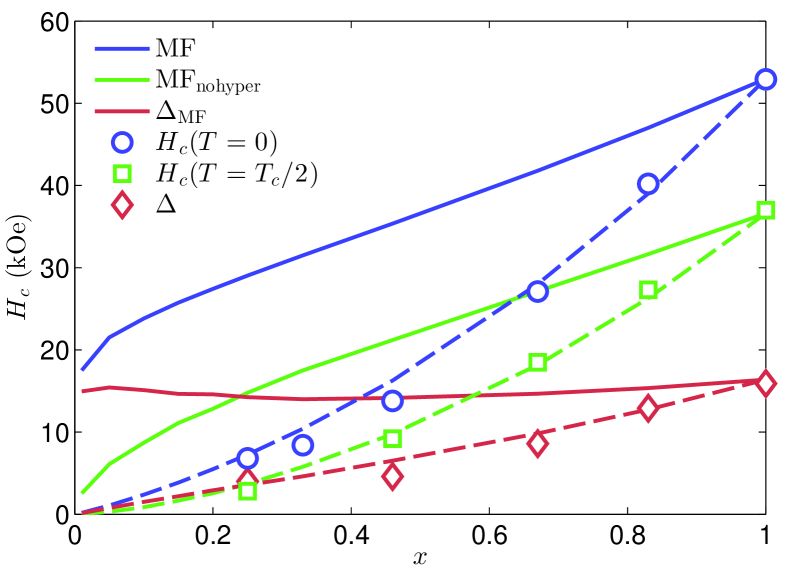
Figure 8 shows the dilution dependence of the critical field in LiHoxY1-xF4. We consider three values obtained experimentally: (i) critical field extrapolated to , (ii) which represents the critical field in the absence of hyperfine interaction, and (iii) the difference between (i) and (ii). From the phase diagrams in Fig. 7, we expect that in the absence of the hyperfine interaction, the critical field for a given dilution does not change appreciably below . Therefore, the corresponding at this temperature can be considered to be the hyperfine-free value of for each sample. We find from our measurements that decreases almost quadratically from 53 kOe in to 7 kOe at 25% Ho3+ concentration. The hyperfine-free critical field extracted from our data and the difference follow a similar trend.
In comparing our experimental results with VCMF calculations, we find that and should increase almost linearly for . The difference , which is attributed to electro-nuclear coupling, reveals that hyperfine contribution on is nearly dilution independent. The effect of dilution on the criticality around the quantum critical point is poorly captured in this model. Therefore, our model gives very different results to what we have observed. The experimental results imply that the system is more easily disordered by an external magnetic field than expected.
Phenomenologically we can rescale the critical field found from VCMF by dilution, i.e., . By doing this we reach a good agreement between VCMF and measured results over the entire dilution range studied. An alternate strategy would be to consider a model where the mean-field moment within VCMF is reduced by rather than , i.e., Eq. 1 becomes . Since we are reducing the effective moment of Ho3+ ions, this would also dramatically affect the expected .

To determine whether it is necessary to scale the ordered moment in VCMF by we turn our attention to the size of magnetic moment on Ho3+ ions obtained in our neutron diffraction measurements. The ratio between the magnetic () and nuclear () intensities at base temperature and zero field decrease approximately with dilution squared, shown in Fig. 9. We find that the ratio of the magnetic to nuclear scattering can be well described by our calculations of neutron scattering cross-section where the electronic moments scale as . Since the scattering lengths of Y3+ (7.75 b) and Ho3+ (8.01 b) are very similar, the nuclear structure factor does not have a significant dependence on dilution. The strength of magnetic scattering is proportional to the square of the ordered moment. Therefore, the ordered moment relative to that of Ho3+ ions in LiHoF4 can be extracted for each concentration, as shown in Fig. 9. Within the accuracy of our measurements, the ordered moment per Ho3+ ion in fact remains unchanged for the concentrations measured.
IV Discussion
The competition between random local magnetic fields through substitution of magnetic Ho3+ ions with nonmagnetic Y3+ in LiHoxY1-xF4 and quantum fluctuations from the transverse magnetic field yield a complex plethora of physics. At base temperature the measured critical field decreases much faster than the mean-field prediction, but we have found that a very simple phenomenological rescaling by of the calculated critical field yields very good agreement with the measured phase boundary. Our results show that the mean-field calculation overestimates by 15-20% down to , below which the measured decreases at a faster rate [see Fig. 4(b)]. By scaling the mean-field, our MF model accounts effectively for that part of the thermal and random-field fluctuations which may derive from an effective averaged medium (as assumed to first order in the expansion when combined with the CPA). The non-linear variation of indicates an additional complex interplay of fluctuations and randomness in LiHoxY1-xF4 close to which requires further theoretical studies. Moreover, for the lowest concentrations of Ho3+ in LiHoxY1-xF4, the system may be entering into a dipolar quasi-spin-glass state as we increase . The long tail above in the order parameter curves of systems with , as shown in Fig. 6, is possibly a signature of such a cross-over when the temperature is sufficiently low Andresen et al. (2013).
Our experimental results shown in Fig. 8, demonstrate the increasingly stronger reduction of as the concentration of Ho3+ is reduced compared to our VCMF model. Random fields together with quantum fluctuations are at the heart of this phenomenon Schechter and Laflorencie (2006); Tabei et al. (2006, 2008); Schechter (2008). Numerical calculations for and 0.7 found that is significantly suppressed when off-diagonal bilinear dipolar terms are included in the effective Hamiltonian Tabei et al. (2006). The rate of suppression of is greater for lower concentrations of Ho3+ Tabei et al. (2006), which is also in agreement with our results. However, these calculations do not include the hyperfine interactions, which plays an important role in stabilizing the magnetic order. At lowest values of , when the effective dipolar interactions are weak, the phase boundaries are mostly dictated by hyperfine interaction. This feature is obvious in the phase diagram, where the effect of the hyperfine interactions is more pronounced. Similar features have been argued by Schechter et al. Schechter and Stamp (2008), in comparing two highly diluted systems, where a re-entrance and non-monotonic suppression with was predicted. We hope that the experimental account of the field, temperature, and dilution dependence reported herein will inspire a detailed theoretical description taking into account both electronic and nuclear degrees of freedom as well as random longitudinal and transverse fields.
V Conclusion
We have analyzed the result of the competition between long-range order and random fields on the criticality of the ferromagnetic LiHoxY1-xF4 with using neutron scattering and mean-field calculations. Transverse-dipolar interactions are responsible for the deviation of the classical phase transition from mean-field prediction below . The quantum phase transition is found to be more sharply suppressed by dilution than expected from mean-field calculations that we account for by a phenomenological rescaling of by . At base temperature and low magnetic fields where the energy scale of electron and nuclear spin coupling is effectively higher than the dipolar interactions, magnetic order of the Ho3+ ions is observed for all studied compositions . However, the persisting long tails of scattering intensity above could indicate the appearance of a quasi-spin-glass phase. Off-diagonal coupling, which can be tuned by and , competes with quantum fluctuations from the transverse field, which result in a faster suppression of . The influence of the dilution of magnetic Ho3+ ions by diamagnetic Y3+ ions on the quantum phase transition could be quantitatively tracked by comparing the phase boundaries of experimental and mean-field phase diagrams.
Acknowledgements.
We are indebted to Sebastian Gerischer, Bastian Klemke, and Klaus Kiefer for their help and support during the experiments, and especially for their expertise in designing and setting up a weak link for the dilution refrigerator. We are also grateful for insightful discussions with M. Schechter during the preparation of this paper. We wish to thank the Swiss National Science Foundation (SNSF) for the financial support. I.K., J.O.P., and P.B. are grateful for the funding received from the ERC CONQUEST grant. This project has received funding from the European Union’s Seventh Framework Programme for research, technological development and demonstration under the NMI3-II Grant No. 283883. Neutron scattering measurements were performed at SINQ, HZB, HML, and ILL facilities.References
- Als-Nielsen et al. (1974) J. Als-Nielsen, L. M. Holmes, and H. J. Guggenheim, Phys. Rev. Lett. 32, 610 (1974).
- Hansen et al. (1975) P. Hansen, T. Johansson, and R. Nevald, Phys. Rev. B 12, 5315 (1975).
- Misra and Felsteiner (1977) S. K. Misra and J. Felsteiner, Phys. Rev. B 15, 4309 (1977).
- Magariño et al. (1980) J. Magariño, J. Tuchendler, P. Beauvillain, and I. Laursen, Phys. Rev. B 21, 18 (1980).
- Mennenga et al. (1984) G. Mennenga, L. J. de Jongh, W. J. Huiskamp, and I. Laursen, J. Mag. Mag. Mat. 44, 48 (1984).
- Kraemer et al. (2012) C. Kraemer, N. Nikseresht, J. O. Piatek, N. Tsyrulin, B. Dalla Piazza, K. Kiefer, B. Klemke, T. F. Rosenbaum, G. Aeppli, C. Gannarelli, et al., Science 336, 1416 (2012).
- Babkevich et al. (2016) P. Babkevich, M. Jeong, Y. Matsumoto, I. Kovacevic, A. Finco, R. Toft-Petersen, C. Ritter, M. Månsson, S. Nakatsuji, and H. M. Rønnow, Phys. Rev. Lett. 116, 197202 (2016).
- Beauvillain et al. (1978) P. Beauvillain, J. P. Renard, I. Laursen, and P. J. Walker, Phys. Rev. B 18, 3360 (1978).
- Christensen (1979) H. P. Christensen, Phys. Rev. B 19, 6564 (1979).
- Chakraborty et al. (2004) P. B. Chakraborty, P. Henelius, H. Kjønsberg, A. W. Sandvik, and S. M. Girvin, Phys. Rev. B 70, 144411 (2004).
- Rønnow et al. (2007) H. M. Rønnow, J. Jensen, R. Parthasarathy, G. Aeppli, T. F. Rosenbaum, D. F. McMorrow, and C. Kraemer, Phys. Rev. B 75, 054426 (2007).
- Schechter and Stamp (2008) M. Schechter and P. C. E. Stamp, Phys. Rev. B 78, 054438 (2008).
- Rønnow et al. (2005) H. M. Rønnow, R. Parthasarathy, J. Jensen, G. Aeppli, T. F. Rosenbaum, and D. F. McMorrow, Science 308, 389 (2005).
- Silevitch et al. (2010) D. M. Silevitch, G. Aeppli, and T. F. Rosenbaum, Proc. Nat. Acad. Sci. USA 107, 2797 (2010).
- Reich et al. (1990) D. H. Reich, B. Ellman, J. Yang, T. F. Rosenbaum, G. Aeppli, and D. P. Belanger, Phys. Rev. B 42, 4631 (1990).
- Tabei et al. (2006) S. M. A. Tabei, M. J. P. Gingras, Y. J. Kao, P. Stasiak, and J. Y. Fortin, Phys. Rev. Lett. 97, 237203 (2006).
- Alonso and Fernández (2010) J. J. Alonso and J. F. Fernández, Phys. Rev. B 81, 064408 (2010).
- Wu et al. (1993) W. Wu, D. Bitko, T. F. Rosenbaum, and G. Aeppli, Phys. Rev. Lett. 71, 1919 (1993).
- Tam and Gingras (2009) K. M. Tam and M. J. P. Gingras, Phys. Rev. Lett. 103, 087202 (2009).
- Rosenbaum (1999) T. F. Rosenbaum, J. Phys.: Condens. Matter 8, 9759 (1999).
- Biltmo and Henelius (2007) A. Biltmo and P. Henelius, Phys. Rev. B 76, 054423 (2007).
- Biltmo and Henelius (2008) A. Biltmo and P. Henelius, Phys. Rev. B 78, 054437 (2008).
- Schechter et al. (2007) M. Schechter, P. C. E. Stamp, and N. Laflorencie, J. Phys.: Condens. Matter 19, 145218 (2007).
- Ghosh et al. (2002) S. Ghosh, R. Parthasarathy, T. F. Rosenbaum, and G. Aeppli, Science 296, 2195 (2002).
- Reich et al. (1987) D. H. Reich, T. F. Rosenbaum, and G. Aeppli, Phys. Rev. Lett. 59, 1969 (1987).
- Silevitch et al. (2007) D. M. Silevitch, D. Bitko, J. Brooke, S. Ghosh, G. Aeppli, and T. F. Rosenbaum, Nature (London) 448, 567 (2007).
- Piatek et al. (2013) J. O. Piatek, B. Dalla Piazza, N. Nikseresht, N. Tsyrulin, I. Živković, K. W. Krämer, M. Laver, K. Prokes, S. Mataš, N. B. Christensen, and H. M. Rønnow, Phys. Rev. B 88, 014408 (2013).
- Kjaer et al. (1999) K. Kjaer, J. Als-Nielsen, I. Laursen, and F. K. Larsen, J. Phys.: Condens. Matter 1, 5743 (1999).
- (29) I. Kovacevic, P. Babkevich, M. Jeong, J. O. Piatek, G. Boero, and H. M. Rønnow, arXiv:1607.00124 .
- Babkevich et al. (2015) P. Babkevich, A. Finco, M. Jeong, B. Dalla Piazza, I. Kovacevic, G. Klughertz, K. W. Krämer, C. Kraemer, D. T. Adroja, E. Goremychkin, T. Unruh, T. Strässle, A. Di Lieto, J. Jensen, and H. M. Rønnow, Phys. Rev. B 92, 144422 (2015).
- Jensen (1984) J. Jensen, J. Phys. C 17, 5367 (1984).
- Tabei et al. (2008) S. M. A. Tabei, M. J. P. Gingras, Y. J. Kao, and T. Yavors kii, Phys. Rev. B 78, 184408 (2008).
- Dunn et al. (2012) J. L. Dunn, C. Stahl, A. J. Macdonald, K. Liu, Y. Reshitnyk, W. Sim, and R. W. Hill, Phys. Rev. B 86, 094428 (2012).
- Jensen and Mackintosh (1991) J. Jensen and A. R. Mackintosh, Rare Earth Magnetism: Structures and Excitations (Clarendon Press, Oxford, UK, 1991).
- Kraemer (2009) C. Kraemer, Quantum phase transitions in a magnetic model system, Ph.D. thesis, ETH (2009).
- Andresen et al. (2013) J. C. Andresen, C. K. Thomas, H. G. Katzgraber, and M. Schechter, Phys. Rev. Lett. 111, 177202 (2013).
- Bitko et al. (1996) D. Bitko, T. F. Rosenbaum, and G. Aeppli, Phys. Rev. Lett. 77, 940 (1996).
- Schechter and Laflorencie (2006) M. Schechter and N. Laflorencie, Phys. Rev. Lett. 97, 137204 (2006).
- Schechter (2008) M. Schechter, Phys. Rev. B 77, 020401 (2008).