Serving the Grid: an Experimental Study of Server Clusters as Real-Time Demand Response Resources
Abstract
Demand response is a crucial technology to allow large-scale penetration of intermittent renewable energy sources in the electric grid. This paper is based on the thesis that datacenters represent especially attractive candidates for providing flexible, real-time demand response services to the grid; they are capable of finely-controllable power consumption, fast power ramp-rates, and large dynamic range. This paper makes two main contributions: (a) it provides detailed experimental evidence justifying this thesis, and (b) it presents a comparative investigation of three candidate software interfaces for power control within the servers. All of these results are based on a series of experiments involving real-time power measurements on a lab-scale server cluster. This cluster was specially instrumented for accurate and fast power measurements on a time-scale of 100 ms or less. Our results provide preliminary evidence for the feasibility of large scale demand response using datacenters, and motivates future work on exploiting this capability.
1 Introduction
This paper uses experimental results from a power-aware cluster to show how the fast response time, fine-grained controllability, and large dynamic range of computer servers can allow computing clusters to provide flexible, large-scale, real-time demand response services to the grid. Furthermore, as a step toward implementing these services on a larger scale, we present an empirical comparison of several candidate power-modulating interfaces available to modern servers.
Datacenters have recently become an important and increasing portion of the electric load in the US electric grid [1]. However, in their current configuration, datacenters are not particularly friendly to the grid. The largest of them can require hundreds of megawatts guaranteed capacity [2], but frequently experience large, unpredictable fluctuations in actual power consumption [3].
At the same time, datacenters also have a significant amount of excess capacity. In other words, there is considerable evidence (summarized below) that shows that datacenters operate at substantially less than peak utilization most of the time. This suggests the possibility that the “spare capacity” of computer servers can be used to provide load-shaping services to the electric grid and indeed this idea has been proposed [4], and is being actively studied by researchers [5, 6, 7, 8, 9, 10, 11, 12, 13].
This paper represents a new contribution to this literature by specifically considering real-time demand response at much shorter time-scales than previous work in this area. We argue that compared to other types of electric loads, computer servers are especially well-suited to provide real-time services because their power consumption is controllable to (a) a fine granularity over (b) a large dynamic range of power levels with (c) fast ramp rates, and we back up these arguments with detailed experimental evidence.
1.1 The importance of load-shaping
The idea of using load shaping to increase power grid reliability has been around since Edison’s time [14]. However, grid operators have traditionally not emphasized load-side management, relying instead on the paradigm of providing energy on demand to completely passive consumers who have essentially unrestricted ability to vary their usage over time.
Indeed, active load-side management was arguably redundant in the traditional power grid. Grid operators have long been aware of the high degree of statistical regularity in electricity demand over time on daily, weekly and yearly time-scales and were traditionally able to take advantage of these patterns to predict loads and optimize generation schedules accordingly [15].
This situation has changed dramatically with the increasing penetration of intermittent renewables like wind and solar in the grid; renewable energy generation has proved to be far less predictable than load [16], and treating renewables as “negative loads” is not only expensive and wasteful [17] in many ways, it also strains the existing reliability and stability mechanisms of the grid [18]. This has led to a growing recognition that large-scale energy storage and/or “virtual storage” [19, 4] in the form of demand response are essential to accommodate renewable energy sources in the grid.
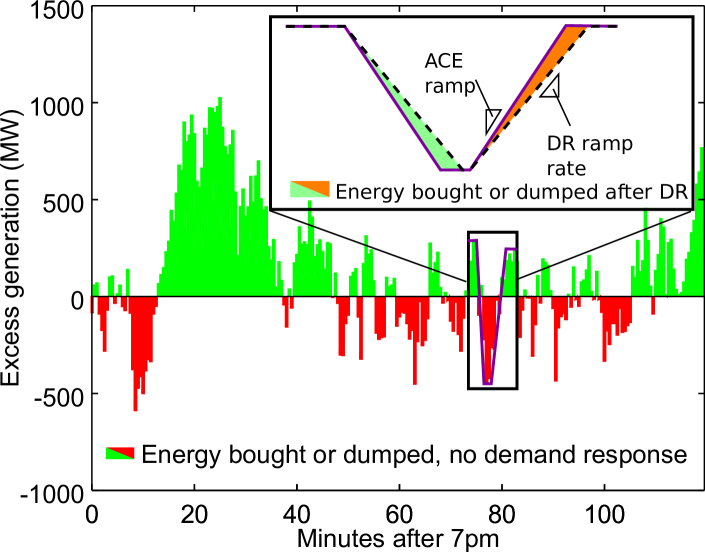
A simple case study illustrates how realtime demand response can provide a benefit over slower demand response. Fig. 1, plots the area control error (ACE) of the Midcontinent Independent System Operator (MISO) over a two hour period [20]. During this period, of energy is dumped and of unscheduled energy purchases are made. Simulations show that using demand response capacity with a ramp rate of reduces the dumped energy by a mere . Increasing the ramp rate to reduces the dumped energy by . And, similar results hold for the purchased energy reductions.
1.2 Real-time demand response
It is useful for our purposes to classify demand response techniques according to how far in advance the load adjustments need to be determined, and how smooth these adjustments must be. Specifically, we make a distinction between real-time and offline demand response methods based on whether the time-scale for load adjustments is significantly shorter or longer than a threshold which we take to be seconds.
This choice of threshold in the definition of a real-time demand response technique is not completely arbitrary. International standards require the time constants of the primary control of generators participating in the frequency regulation process to be on the order of a few tens of seconds [21]. This in turn determines the fastest time-scale on which it is possible to perform load shaping without risking instability111At short time-scales, another interesting possibility is to have adjustable loads actively participate in the frequency regulation function itself; a detailed exploration of this idea is beyond the scope of this paper, but there exists some previous work e.g. [11] in this area which remains an active topic of research..
Examples of electric loads that are unsuitable for real-time demand response include residential lighting and HVAC systems and also industrial loads consisting of large rotating machines. In contrast, computer servers and electric vehicle charging systems [11] are examples of loads whose power consumption is not limited by the inertia of moving mechanical components and are good candidates for real-time demand response.
1.3 Managing power consumption in datacenters
Ever since large-scale datacenters have existed, power considerations have been recognized as economically crucial to their operation and operators have developed sophisticated methods [22, 23, 24] for managing and controlling the two major categories of power consumption in datacenters: (a) the building maintenance and cooling systems, and (b) the computer servers themselves. As discussed earlier, we focus in this paper on the latter i.e. the power consumption in the servers. We note that designing datacenters to be energy-efficient and minimizing their power consumption [25] is quite different from providing load-shaping services to the grid.
An empirical study by Lawrence Berkeley National Laboratory (LBNL) discussed the advantages and disadvantages of various datacenter demand response strategies [5]. One power control method widely studied in the literature is the geographical migration of virtual machines [26] or transactional workloads and batch jobs [27] in response to variations in hour-ahead locational marginal pricing.
There is also a significant literature on determining optimal pricing strategies for datacenters to offer load-shaping serves on electricity markets see e.g. [6, 9, 12].
Note, however, that price bids on electricity markets are settled and refined at relatively long time-scales, ranging from day-ahead and hour-ahead to near “real-time” markets which operate minutes in advance. Power fluctuations at timescales shorter than minutes must be settled by the system operator (ISO) through explicit signaling mechanisms. Typically, the ISO monitors the Area Control Error [21] measurements of inter-area power-flow imbalances and uses these measurements to generate regulation service requests [28] periodically on the order of every seconds or so. Through these requests, the ISO orders providers to change their active power consumption by specific amounts. Typically, these providers are compensated in advance by the ISO for providing such services on demand either through market bids, or long-term contractual arrangements [29].
In this paper, we consider a model where a datacenter has been contracted to provide real-time best effort regulation service to the grid. Accordingly, we assume that a grid operator periodically sends service requests in the form of desired active power operating points to the datacenter operator who controls the servers to meet these requests as long as the requests are feasible given the requirements of the server workloads.
We deliberately chose this “best effort” service model to eliminate by assumption the possibility of any conflict between the grid’s service requests and the quality of service (QoS) provided to the datecenter’s software workloads. More sophisticated models to provide maximum grid regulation service while maintaining statistical or deterministic QoS are left to future work (an interesting first step along those lines is [7]). We focus narrowly in this paper on a detailed empirical study of different software mechanisms to meet grid service requests that are presumed to be feasible.
1.4 Organization
The rest of this paper is organized as follows. Section 2 shows that it is possible to achieve good power tracking performance with a simple distributed controller. Section 3 explores the demand response power metrics of ramp rate, dynamic range, and tracking error. Section 4 examines detailed power statistics of several different cpu-capping software interfaces. Section 6 is the conclusion and suggests future work.
2 A Simple Power-Tracking Experiment
Our first experiment is intended to illustrate that very simple software methods can be effective in accurately controlling the real-time power consumption of servers under favorable conditions.
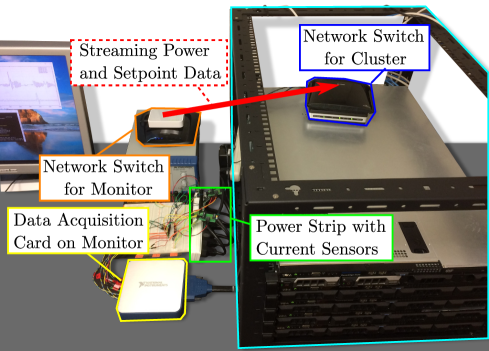
First, however, we describe the hardware and software setup of the server cluster on which all the results in this paper are based. The cluster is pictured in Fig. 2 and was chosen as a small-scale model that approximates as closely as possible commonly-used server hardware configurations in datacenters [30, 1].
The cluster consists of four standard Dell PowerEdge R320 rack servers each powered by an Intel Xeon E5-2400 series processor with 6 cores and hyperthreading enabled. The servers all run 64-bit Ubuntu Server operating system version 15.04 with the 3.19.0-43-generic Linux kernel, and power management options are set to their default settings.
To obtain faster power measurements than are available from a commercial power distribution unit (PDU), we powered the servers through a specially instrumented power strip. A National Instruments PCIe-6323 data acquisition card measures the wall voltage and the output of amplified current shunts (Linear Technology LT1999 amplifier and a resistor, with combined nominal current measurement tolerance of ). A standard desktop PC serves as a monitor computer that reads five channels (one for rack voltage, and four for individual server currents) at from the data acquisition card.
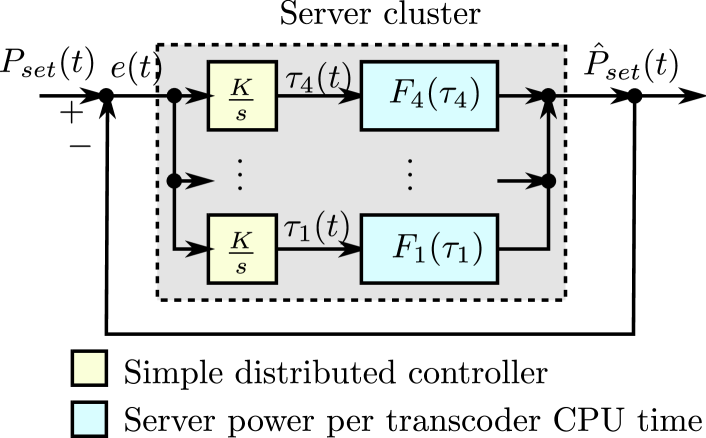
On the monitor computer, a software application polls rack-level power measurements from the data acquisition card, averages these measurements over windows222We did not perform zero-crossing detection when choosing the borders for the block averaging operation on the instantaneous power. So, the measurements presented throughout this paper have a higher variance than would have been obtained from averaging real power over an integer number of cycles. In other words, the tracking error measurements are somewhat conservative values., subtracts this value from the target power , and streams samples of the power tracking error333We actually stream the power measurements at , stream the power target only when it changes, and calculate the tracking error separately on each server. The result is functionally equivalent to streaming at . over Ethernet UDP multicast packets at a rate of . represents a desired total power setpoint for all the servers in the cluster combined; in a larger-scale version of our cluster, can be thought of as the signal that the electric grid sends to request demand response services from the cluster. In all the experiments described in this paper, the servers independently perform demand response using only the total power tracking error signal that is common to all servers.
We are now ready to describe our power-tracking experiment. In this experiment, the cluster is programmed to use the Linux avconv program to transcode video chunks from an NFS-mounted data store in a manner similar to the dynamic GOP transcoding scheme described in [31]. Each server has a worker which grabs the next available -minute block from the shared video source file, transcodes that block, and writes the result back to the shared drive, for later concatenation. The source files are chosen to be large enough that the transcoding takes longer than the duration of the power tracking test. We chose the highly parallelizable transcoding application because it is especially well-suited for power tracking using simple controllers running independently on each server. It is worth noting that some major commercial transcoding services (such as Amazon Elastic Transcoder [32]) offer pay-per-video pricing at a best-effort conversion speed that is similar to the application we use in this experiment. Furthermore, by replacing the simple controller in Fig. 3 with the one described in [33], we can achieve realtime power tracking with soft service level agreement (SLA) enforcement. But, that is outside of the scope of this paper.
2.1 Power Tracking Controller
We assume that our realtime controllable load cluster has a demand response regulation service agreement in the PJM market. According to [28, 29], the cluster must respond to a signal from the utility, so that its measured power consumption (measured in -second intervals) is close to in 1 with and being the dynamic range and base load agreed upon in the contract.
| (1) |
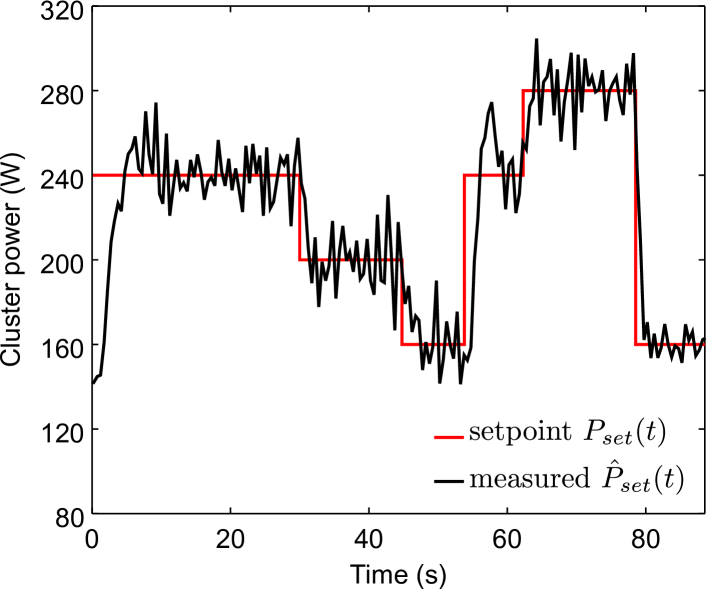
In this experiment, we choose that to be cluster’s power consumption with all the servers at idle, and to be the maximum possible dynamic range. We choose to vary in a piecewise-constant manner over time to show the cluster’s closed-loop response to a step input.
In order to track the calculated from 1, the controller on server simply integrates the received tracking error , and uses a standard anti-windup procedure to produce a signal , which represents the fraction of the time that the CPU on server is active.
We use the “userspace idle injection” interface described in Section 4 (essentially, using Linux signals to duty cycle the workload) to adjust whenever the servers receive an updated error signal measurement (which is updated every in our setup, as noted earlier). Adjustments to change server ’s power consumption in a software and hardware-dependent manner, indicated by in Fig. 3.
The power tracking experiment shown in Fig. 4 shows a maximum settling time of around and a root mean square tracking error (see 3) of around for the whole cluster. Calculating the PJM-defined [28] “precision score,” we get a value of for this interval, which is well above the minimum value of . It should be noted that this tracking error was achieved with a very basic distributed controller without any communication between nodes – and might be expected to improve with more advanced control.
3 Server power model, ramp rate, and dynamic range
In the power tracking experiment of Section 2, our controller made no assumptions on the control plant. Datacenter power management literature often assumes that the power consumption of a computer server follows the power model of 2 with being percent CPU time [25], and , constants.
| (2) |
3.1 Accuracy of power model experiment
We designed an experiment to test the accuracy of the model of 2 for our servers, under the “userspace idle injection” CPU-throttling interface we used in Section 2. For this purpose, we first measured the idle power , and the dynamic range for each of our four servers. After this, we ran the Linux stress program for for evenly-spaced increments of ranging from to , recording power measurements in block averages. For each value of , we compared (the server power predicted by 2) with , the measured server power consumption at time . Using this information, we found the root mean square error (RMSE) according to 3 with and .
| (3) |
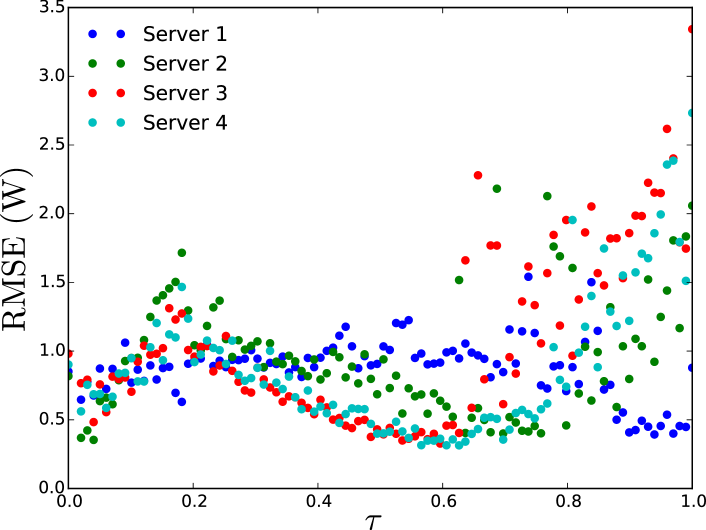
Since RMSE compares the measured power with the predicted power at every sample, it gives a more conservative measure of the accuracy of 2, than simply comparing with the average measured power . Fig. 5 plots RMSE versus and shows that the maximum RMSE is around , meaning that 2 is a reasonably accurate model for the power consumption of a server using the user-space idle injection method to control the CPU duty cycle .
To put these measurements into context, we can calculate the worst-case PJM “precision score,” using 2 as the setpoint, to see whether a datacenter could feasibly use an open-loop controller based on 2. In our measurements, the calculated minimum value of was actually higher than the score we got for our closed-loop controller in part because of the setpoint fluctuations in the previous section, and in part because the simple controller is not tuned to avoid overshoot. An open loop controller has obvious drawbacks, but it is encouraging to note that it is at least in theory feasible.
3.2 Ramp rate and dynamic range experiment
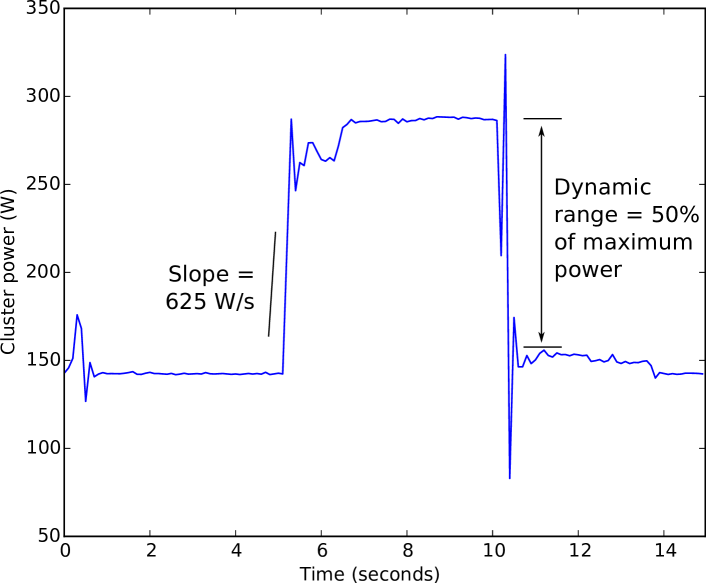
Our next experiment is designed to measure the maximum possible ramp rate of the cluster. Our strategy in this experiment was to signal each server in the cluster at exactly the same instant to transition from an idle CPU state to full load, thereby driving the entire cluster from the lowest to the highest power consumption state in as short a time interval as possible.
In order to achieve this synchronized transition, we wrote a simple remote procedure call (RPC) software to run on each server. This software responded to IP multicast requests to stop and start a computationally-intensive workload. Specifically, we chose the Linux stress [34] workload generator (performs repeated square root operations) for this experiment, but similar results were obtained with a variety of other computationally-intensive workloads (k-means clustering, financial markets simulation, and video transcoding are a few examples). As Fig. 6 shows, it is possible to obtain a fast power ramp rate of about , over a dynamic range of around , or of the maximum power. To put this into context, consider scaling these results up to a , datacenter with a fourth of its servers designated to participate in demand response. At this scale, the datacenter could absorb almost a megawatt, at a rate of up to .
4 Power modulating interfaces
In the experiments described in Sections 2 and 3, we used the userspace idle injection interface for throttling the CPU time. However, there are a number of different software methods for throttling CPU time, each with unique features and availability. Furthermore, each of these methods produces different statistics for the measured power . As it turns out, some methods are more suited to power control than others. For example, the userspace idle injection interface we used earlier is more deterministic and more closely matches 2 than the other methods we investigated. Some previous work such as [35] have produced good experimental measurements in the context of power-aware metering, and previous studies like [36] have made contributions to the theoretical side of modeling server power. We complement these studies with a detailed experimental investigation that focuses on the specific software interfaces used to modulate the server power consumption.
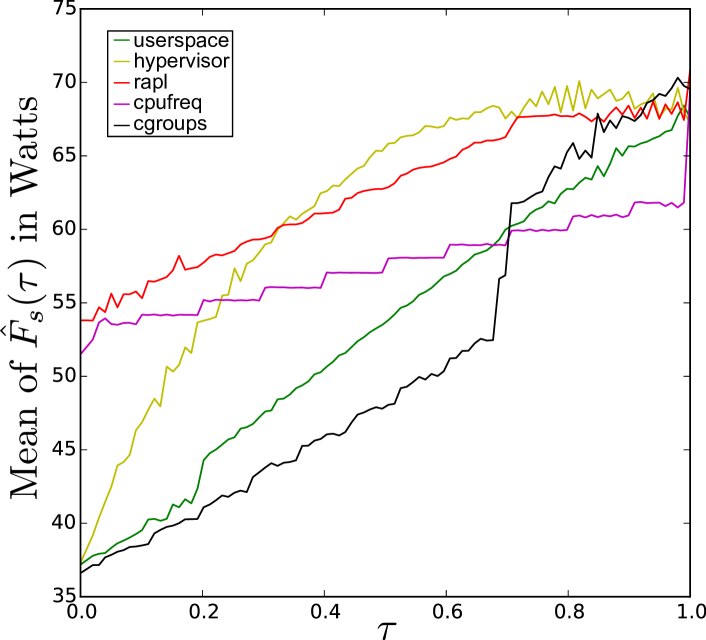
We used measured power samples , across the full range of to estimate some power statistics for each interface. Furthermore, to gain insight into why the power statistics look as they do, we also measured the percentage of time spent by the processor in each of its active and idle states (in the following, we refer to this information as “state residency”) using hardware counters in a modified version of Intel’s turbostat [37] utility.
4.1 Experiment description
In the experiments described in Sections 2 and 3, we used a “userspace idle injection” interface for controlling the CPU time. We now justify this choice of interface by presenting a detailed experimental comparison with a number of alternative software methods for controlling CPU utilization. Each of these methods have a different power characteristic . It turns out that the userspace idle injection interface we used earlier is more deterministic and more closely matches 2 compared to the other methods which makes it more suitable for our power tracking application.
Throughout the experiment, we recorded both the server power consumption (averaged in blocks) and processor state residency information (again, collected in blocks), and grouped those samples by . We removed outliers from each group using the median absolute deviation method [38]. And, for each sample group, we recorded the mean and a conservative estimate444The observed range after outlier rejection, plus standard deviations. of the sample range. We performed this experiment for each of the four servers in our cluster, and present results from one server for space considerations and because the power and state residency statistics were nearly identical across the four servers.
4.2 Linux cgroups interface
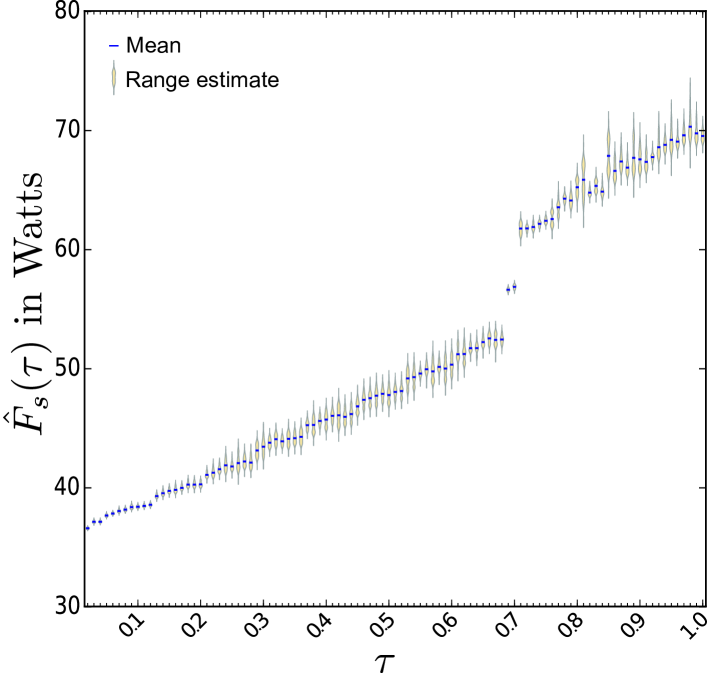
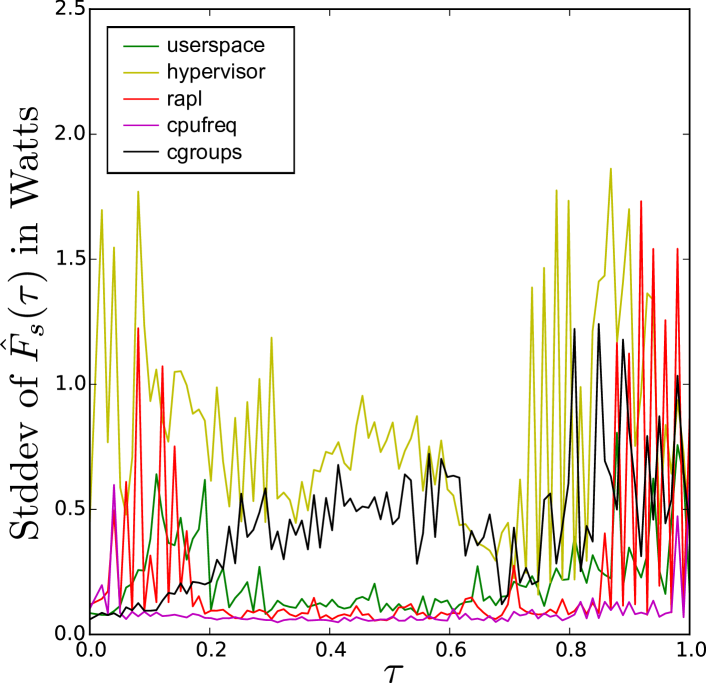
The “user-space idle injection” interface that we used in our previous experiments is a custom implementation of a standard and more widely used CPU-capping framework called cgroups. We thus begin our discussion of the different power modulating interfaces by looking in detail at the Linux cgroup interface. Like many other interfaces, cgroups uses a general technique called idle cycle injection (ICI) to rapidly pause and resume processes in order to limit the average workload “seen” by the processor. Unlike direct dynamic voltage and frequency scaling (DVFS) methods which control processor state without modifying the computational workload, ICI can be used to access the full dynamic range of server power. Because ICI does not directly control processor state, the power consumption at a particular may have a larger variance than a DVFS interface would produce. Because of this variance, ICI has been traditionally used in long-term average power control applications like thermal management [39, 40] rather than direct power control. However, our results show that ICI can be quite effective at controlling server power consumption, even on short time scales.
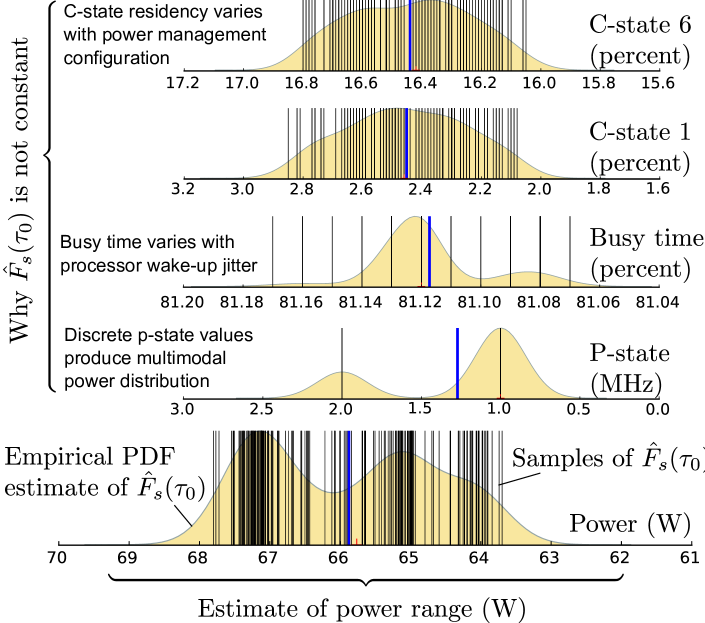
To understand why shows nondeterministic behavior, consider Fig. 9, which gives a detailed look at the observed processor behavior and measured power consumption for the cgroups interface at . Cgroup’s default scheduler allows setting a CPU time cap within a periodic interval (set to in our case). Once the workload exceeds its allotted time cap, the operating system pauses the workload processes, and power management features automatically transitions the server to one of its idle states. Not only is there some variation to which idle state gets entered, but there is some jitter in the processor’s wake-up cycle – both of which work to producing a non-constant power consumption, even at a constant .
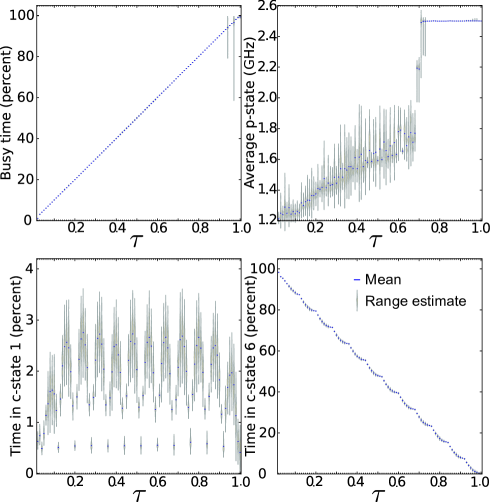
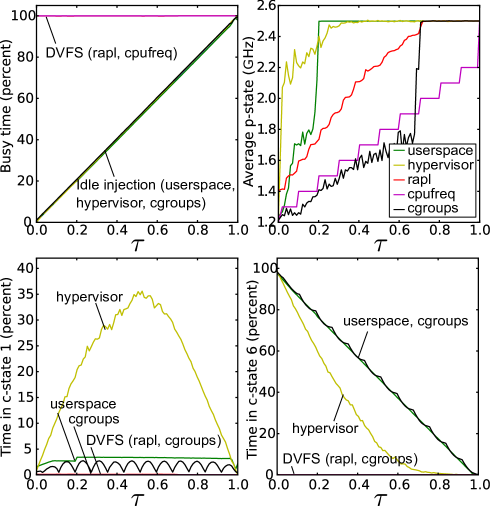
Fig. 8 gives a look at the processor behavior under the cgroups interface, across the full range of . At the top left, the “Busy time” graph has a unit slope, and a small estimated range for each – showing that the cgroups interface is effective at enforcing its CPU time cap. At the top right, the “Average p-state” graph gives a reason for the nonlinearity around in the power graph of Fig. 7. At this , the power management system stops using the lower-power active modes of the processor, and starts running the processor at maximum speed whenever it is active. At the lower left and right, the “Time in c-state” graphs show that the power management system under the cgroups interface prefers to let the processor idle in its lowest-power sleep mode (c-state 6).
Compared to the userspace idle injection interface we used in our previous experiments, one of the main advantages of the cgroups interface is that it has been built in to the Linux kernel since 2008, and is already in use for managing resources in several cluster computing environments (for example, YARN’s LinuxContainerExecutor and MESOS’s default containerizer). Furthermore, cgroups is designed to work on arbitrary groups of processes and therefore can throttle some groups of processes independently from others. The primary disadvantage is that this method is tied to Linux, while other methods may apply across many different operating system kernels.
4.3 Other idle cycle injection interfaces
4.3.1 Userspace idle injection
Inspired by the Linux cpulimit program, we designed a custom userspace tool to perform ICI using the Linux SIGSTOP and SIGCONT signals. We ran the same experiment as for the cgroups interface. This tool does the same thing as the cgroups interface, except that our tool operates in user space and throttles processes in a more synchronized manner. As shown in Fig. 12, this causes the power management system to essentially “duty cycle” the processor – toggling between sleep mode and the highest active state. Because the power management system decides to stop using low power active processor modes around rather than cgroup’s , the for the userspace interface more closely matches predicted by 2.
The power profile of this tool is the least variable and most linear of all ICI interfaces we tested. The advantage of such a tool is that it can be run in the background of any POSIX operating system, without accessing operating system or hypervisor power management policies. The disadvantage is that it is a custom tool, which only offers marginal improvements over the well-maintained and more full-featured cgroups interface.
4.3.2 Hypervisor CPU capping
Various datacenter power management papers such as [27] have made use of hypervisor-based CPU throttling techniques. The Xen Project [41] provides a widely-deployed open source hypervisor, whose sched-credit framework uses ICI to arbitrate processor access among virtual machines (VMs). The current implementation uses a priority queue and an accounting thread to ensure that the virtual CPUs assigned to the VM do not exceed their CPU use cap for each 30-ms accounting interval.
In order to run a workload comparable with the other interfaces, we instantiated a paravirtualized linux guest VM allocated twelve virtual CPUs (two for each hyperthreaded physical core), and ran the same repeated-square-root workload as for the cgroups interface. Compared to the cgroups interface, the power variance at each interface setpoint is higher and Fig. 10 shows that the power profile achieves the full dynamic range but is highly nonlinear. Similar to the cgroups interface, the hypervisor-based interface has the advantage of being integrated into existing virtualized environments and the disadvantage of being tied to those environments. Xen’s sched-credit interface has the further inconvenience of a highly nonlinear setpoint-to-power characteristic.
4.4 Direct voltage and frequency scaling interfaces
Rather than throttling workload and letting power management automatically transition processor state, dynamic voltage and frequency scaling (DVFS) interfaces communicate with the processor package directly in order control its operating state. As such, these interfaces offer much tighter control over the server power consumption. However, because they do not cause the processor to enter sleep states, DVFS interfaces do not allow power control over the server’s full dynamic range.
4.4.1 Cpufreq driver
For example, several papers like [42, 43] have successfully applied the userspace governor of the Linux acpi-cpufreq legacy driver to implement energy-aware DVFS on older processors. However, it is worth noting that most modern Intel processors only allow DVFS “hinting” rather than direct control. The more modern intel_pstate driver offloads power consumption to hardware and does not include a userspace governor. This technique has the advantage of a very low power variance at each setpoint, but only about half of the dynamic range is controllable. Further, as Fig. 12 shows, the cpufreq driver only allows twelve distinct voltage-frequency pairs, meaning that the power characteristic of Fig. 10 has only twelve unique levels.
4.4.2 Proprietary On-chip Power-Limiting
The next DVFS technique is an improvement to the quantized cpufreq interface. RAPL precisely limits the processor package and the memory power consumption using a proprietary hardware mechanism, but the observed state residency (see Fig. 10) indicates that a DVFS technique is used. Certain Intel processors support a model-specific register (MSR) interface called Running Average Power Limit (RAPL) [44]. Papers like [45] use the RAPL API to shape the power consumption of servers running transactional workloads to achieve high energy efficiency with minimal service-level objective violations. This technique again has very low power variance at each setpoint and covers almost the same dynamic range as the cpufreq interface. But, it is not limited to discrete levels of power consumption, as in the cpufreq interface.
5 Discussion
The measurements in Section 4 showed that server power can be controlled with fast ramp rate, across a wide dynamic range, and with a high level of precision using several different power modulating software interfaces.
Out of all the power-modulating interfaces discussed in Section 4, the Linux cgroups interface stands out because of its low power variance, ubiquitous availability (almost all Linux servers have this feature), and highly flexible nature (allows different process groups to be managed separately). However, it is important to consider the specific needs of that datacenter when selecting a power modulating interface for servers in a realtime datacenter demand response system. For example, Xen’s sched-credit interface may be more applicable in a highly virtualized environment, or the RAPL interface may be more appropriate if precise controllability is valued over dynamic range. Even direct DVFS or custom software solutions may offer the best tradeoff for certain applications.
Furthermore, our experiments have shown that the linear power model of 2 commonly used in datacenter power management literature is not always valid, depending on the interface used. Server power , with CPU time controlled by Xen’s sched-credit interface, for example, exhibits highly nonlinear dependence on . The results of our comparison of the software power control interfaces can be summarized as follows.
-
•
The linear model of 2 relating server power to CPU time holds reasonably well for the Linux cgroups, userspace idle injection, and RAPL interfaces, but is not a good model for the Xen sched-credit interface or the cpufreq driver interface.
-
•
Idle Cycle Injection is very effective in providing a wide dynamic range but suffers from increased power variance.
-
•
Direct Dynamic Voltage and Frequency Scaling is effective in accurate power control with low variance, but offers a limited dynamic range.
6 Conclusion
In this paper, we have provided evidence that datacenters are attractive controllable loads. And, as a first step toward understanding the details of implementing a controller for datacenter power shaping we have compared and contrasted several different classes of cpu-utilization capping software available to rack servers. Custom software used in this paper is open source and can be downloaded from [46]. Our power tracking experiment showed that a very simple controller can exceed industry power tracking specifications. Further measurements showed a dynamic range of around of the maximum power, and practically no upper limit on the power ramp rate.
An immediate next step in experimental measurement to would be to determine other demand response metrics like power factor and total harmonic distortion when servers are tracking a typical realtime power setpoint. While the integral control scheme in Section 2 “works,” there are likely many senses in which it is not optimal. Determining what characteristics are most desirable in a power controller for realtime demand response is an exciting open question. For example, one of our assumptions in the power tracking experiment was a workload which could be parallelized without job dependencies or strong SLA restrictions. Along those lines, distributed control as in [47, 48], but incorporating the effect of SLA and workload structure (for example, MapReduce jobs) seems to be an attractive starting point for future research.
Acknowledgments
A preliminary version of this paper has been accepted for presentation in the Innovative Smart Grid Technologies 2016 Conference [49]. This material is based upon work supported by the NSF Graduate Research Fellowship Program under Grant Number DGE-1144245. It is also in part supported by US NSF grants EPS-1101284, CAREER ECCS-1150801, CNS-1239509 and CCF-1302456, and ONR grant N00014-13-1-0202.
References
- [1] J. Koomey, “Growth in data center electricity use 2005 to 2010,” Analytics Press, for The New York Times, Report, 2011.
- [2] Rich Miller, “The world’s largest data centers.” [Online]. Available: http://www.datacenterknowledge.com/special-report-the-worlds-largest-data-centers/
- [3] Patrick Donovan from Schneider Electric. An overlooked problem: Dynamic power variations. [Online]. Available: http://www.datacenterknowledge.com/archives/2013/06/21/a-commonly-overlooked-problem-dynamic-power-variations-in-data-centers-and-network-rooms/
- [4] P. Siano, “Demand response and smart grids: A survey,” Renewable and Sustainable Energy Reviews, vol. 30, pp. 461 – 478, 2014.
- [5] G. Ghatikar, V. Ganti, N. Matson, and M. A. Piette, “Demand response opportunities and enabling technologies for data centers: Findings from field studies,” 2012.
- [6] R. Wang, N. Kandasamy, C. Nwankpa, and D. R. Kaeli, “Datacenters as controllable load resources in the electricity market,” in Proceedings of the 2013 IEEE 33rd International Conference on Distributed Computing Systems, ser. ICDCS ’13. Washington, DC, USA: IEEE Computer Society, 2013, pp. 176–185.
- [7] H. Chen, A. K. Coskun, and M. C. Caramanis, “Real-time power control of data centers for providing regulation service,” in 2013 IEEE 52nd Annual Conference on Decision and Control, Dec 2013, pp. 4314–4321.
- [8] A. Wierman, Z. Liu, I. Liu, and H. Mohsenian-Rad, “Opportunities and challenges for data center demand response,” in Green Computing Conference (IGCC), 2014 International, Nov 2014, pp. 1–10.
- [9] M. Ghasemi-Gol, Y. Wang, and M. Pedram, “An optimization framework for data centers to minimize electric bill under day-ahead dynamic energy prices while providing regulation services,” in Green Computing Conference (IGCC), 2014 International, Nov 2014, pp. 1–9.
- [10] H. Chen, M. C. Caramanis, and A. K. Coskun, “The data center as a grid load stabilizer,” in 2014 19th Asia and South Pacific Design Automation Conference (ASP-DAC), Jan 2014, pp. 105–112.
- [11] S. Li, M. Brocanelli, W. Zhang, and X. Wang, “Integrated power management of data centers and electric vehicles for energy and regulation market participation,” IEEE Transactions on Smart Grid, vol. 5, no. 5, pp. 2283–2294, Sept 2014.
- [12] Z. Liu, I. Liu, S. Low, and A. Wierman, “Pricing data center demand response,” in The 2014 ACM International Conference on Measurement and Modeling of Computer Systems, ser. SIGMETRICS ’14. New York, NY, USA: ACM, 2014, pp. 111–123.
- [13] H. Chen, B. Zhang, M. C. Caramanis, and A. K. Coskun, “Data center optimal regulation service reserve provision with explicit modeling of quality of service dynamics,” in 2015 54th IEEE Conference on Decision and Control, Dec 2015, pp. 7207–7213.
- [14] O. B. Goldman, “The multiplex cost and rate system,” American Institute of Electrical Engineers, Proceedings of the, vol. 34, no. 5, pp. 941–957, May 1915.
- [15] G. Gross and F. D. Galiana, “Short-term load forecasting,” Proceedings of the IEEE, vol. 75, no. 12, pp. 1558–1573, Dec 1987.
- [16] K. Porter and J. Rogers, “Survey of variable generation forecasting in the west,” National Renewable Energy Laboratory, Subcontract Report NREL/SR-5500-54457, NREL Technical Monitor: Dr. Kirsten Orwig.
- [17] A. Hooshmand, J. Mohammadpour, H. Malki, and H. Daneshi, “Power system dynamic scheduling with high penetration of renewable sources,” in 2013 American Control Conference, June 2013, pp. 5827–5832.
- [18] A. D. Lamont, “Assessing the long-term system value of intermittent electric generation technologies,” Energy Economics, vol. 30, no. 3, pp. 1208 – 1231, 2008.
- [19] P. Palensky and D. Dietrich, “Demand side management: Demand response, intelligent energy systems, and smart loads,” IEEE Transactions on Industrial Informatics, vol. 7, 2011.
- [20] Midcontinent Independent System Operator, “ACE chart.” [Online]. Available: https://www.misoenergy.org/MARKETSOPERATIONS/REALTIMEMARKETDATA/Pages/ACEChart.aspx
- [21] F. R. S. D. Team, “Frequency response standard background document,” North American Electric Reliability Corporation, Reference Information for BAL‐003‐1.
- [22] B. Aksanli, J. Venkatesh, L. Zhang, and T. Rosing, “Utilizing green energy prediction to schedule mixed batch and service jobs in data centers,” in Proceedings of the 4th Workshop on Power-Aware Computing and Systems, ser. HotPower ’11. New York, NY, USA: ACM, 2011, pp. 5:1–5:5.
- [23] I. n. Goiri, W. Katsak et al., “Parasol and greenswitch: Managing datacenters powered by renewable energy,” in Proceedings of the Eighteenth International Conference on Architectural Support for Programming Languages and Operating Systems, ser. ASPLOS ’13. New York, NY, USA: ACM, 2013, pp. 51–64.
- [24] X. Xu, W. Dou, X. Zhang, and J. Chen, “Enreal: An energy-aware resource allocation method for scientific workflow executions in cloud environment,” IEEE Transactions on Cloud Computing, vol. 4, no. 2, pp. 166–179, April 2016.
- [25] F. Kong and X. Liu, “A survey on green-energy-aware power management for datacenters,” ACM Comput. Surv., vol. 47, no. 2, pp. 30:1–30:38, Nov. 2014.
- [26] R. Wang, N. Kandasamy, C. Nwankpa, and D. R. Kaeli, “Datacenters as controllable load resources in the electricity market,” in Proceedings of the 2013 IEEE 33rd International Conference on Distributed Computing Systems, ser. ICDCS ’13. Washington, DC, USA: IEEE Computer Society, 2013, pp. 176–185.
- [27] D. Cheng, C. Jiang, and X. Zhou, “Heterogeneity-aware workload placement and migration in distributed sustainable datacenters,” in Parallel and Distributed Processing Symposium, 2014 IEEE 28th International, May 2014, pp. 307–316.
- [28] C. Pilong, “Pjm manual 12: Balancing operations,” PJM Interconnection, Manual Revision: 34.
- [29] M. S. D. Department, “Pjm manual 28: Operating agreement accounting,” PJM Interconnection, Manual Revision: 73.
- [30] J. Koomey, “Estimating total power consumption by servers in the U.S. and the world,” Analytics Press, Report, 2011.
- [31] A. Rodriguez, A. Gonzalez, and M. P. Malumbres, “Performance evaluation of parallel mpeg-4 video coding algorithms on clusters of workstations,” in Parallel Computing in Electrical Engineering, 2004. PARELEC 2004. International Conference on, Sept 2004, pp. 354–357.
- [32] Amazon, “Amazon AWS elastic transcoder FAQ.” [Online]. Available: https://aws.amazon.com/elastictranscoder/faqs/
- [33] J. E. Hall, “Distributed control system for demand response by servers,” Master’s thesis, University of Iowa, 2015.
- [34] Amos Waterland, “stress POSIX workload generator.” [Online]. Available: http://people.seas.harvard.edu/~apw/stress/
- [35] A. Narayan and S. Rao, “Power-aware cloud metering,” IEEE Transactions on Services Computing, vol. 7, no. 3, pp. 440–451, July 2014.
- [36] K. Li, “Improving multicore server performance and reducing energy consumption by workload dependent dynamic power management,” IEEE Transactions on Cloud Computing, vol. 4, no. 2, pp. 122–137, April 2016.
- [37] Len Brown, “Ubuntu 14.04 manpages: turbostat.” [Online]. Available: http://manpages.ubuntu.com/manpages/trusty/man8/turbostat.8.html
- [38] C. Leys, C. Ley et al., “Detecting outliers: Do not use standard deviation around the mean, use absolute deviation around the median,” Journal of Experimental Social Psychology, vol. 49, no. 4, pp. 764 – 766, 2013.
- [39] P. Kumar and L. Thiele, “Cool shapers: Shaping real-time tasks for improved thermal guarantees,” in Design Automation Conference (DAC), 2011 48th ACM/EDAC/IEEE, June 2011, pp. 468–473.
- [40] F. Sironi, M. Maggio et al., “Thermos: System support for dynamic thermal management of chip multi-processors,” in Parallel Architectures and Compilation Techniques (PACT), 2013 22nd International Conference on, Sept 2013, pp. 41–50.
- [41] P. Barham, B. Dragovic et al., “Xen and the art of virtualization,” in Proceedings of the Nineteenth ACM Symposium on Operating Systems Principles, ser. SOSP ’03. New York, NY, USA: ACM, 2003, pp. 164–177.
- [42] S. Li, T. Abdelzaher, and M. Yuan, “Tapa: Temperature aware power allocation in data center with map-reduce,” in Green Computing Conference and Workshops (IGCC), 2011 International, July 2011, pp. 1–8.
- [43] M. Karpowicz, “On the design of energy-efficient service rate control mechanisms: Cpu frequency control for linux,” in Digital Communications - Green ICT (TIWDC), 2013 24th Tyrrhenian International Workshop on, Sept 2013, pp. 1–6.
- [44] H. David, E. Gorbatov et al., “Rapl: Memory power estimation and capping,” in Low-Power Electronics and Design (ISLPED), 2010 ACM/IEEE International Symposium on, Aug 2010, pp. 189–194.
- [45] D. Lo, L. Cheng et al., “Towards energy proportionality for large-scale latency-critical workloads,” in Proceeding of the 41st Annual International Symposium on Computer Architecuture, ser. ISCA ’14. Piscataway, NJ, USA: IEEE Press, 2014, pp. 301–312.
- [46] Josiah McClurg, “Serverpower repository.” [Online]. Available: https://github.com/jcmcclurg/serverpower
- [47] R. Mudumbai, S. Dasgupta, and B. Cho, “Distributed control for optimal economic dispatch of a network of heterogeneous power generators,” Power Systems, IEEE Transactions on, vol. 27, no. 4, pp. 1750–1760, Nov 2012.
- [48] S. Goguri, J. Hall, R. Mudumbai, and S. Dasgupta, “A distributed, real-time and non-parametric approach to demand response in the smart grid,” in Information Sciences and Systems (CISS), 2015 49th Annual Conference on, March 2015, pp. 1–5.
- [49] J. McClurg, J. Hall, and R. Mudumbai, “Fast demand response with datacenter loads,” in Innovative Smart Grid Technologies Conference (ISGT), 2016 IEEE Power Energy Society, Sept 2016, (accepted).
![[Uncaptioned image]](/html/1611.09774/assets/images/mcclurg.png) |
Josiah McClurg is a Ph.D. candidate in Electrical & Computer Engineering at the University of Iowa. He earned an M.S. in EE (Control Systems focus) from the University of Iowa in 2012, and an M.S. in EE (Power Electronics focus) from the University of Illinois Champaign-Urbana in 2015. His research interests are in power-aware computing, demand response, and other enabling technologies for smart grid. |
![[Uncaptioned image]](/html/1611.09774/assets/images/mudumbai.jpg) |
Raghuraman Mudumbai is an Associate Professor in Electrical & Computer Engineering at the University of Iowa. He obtained his B.Tech in EE from the Indian Institute of Technology, Madras, India in 1998; MSEE from the Polytechnic University, Brooklyn in 2000 and Ph.D in ECE from the University of California Santa Barbara in 2007. He also worked as a Systems Engineer at LM Ericsson Telephone Co between 2001 and 2003. His research interests are in wireless communications and power systems. |