How to Find Gravitationally Lensed Type Ia Supernovae
Abstract
Type Ia supernovae (SNe Ia) that are multiply imaged by gravitational lensing can extend the SN Ia Hubble diagram to very high redshifts (), probe potential SN Ia evolution, and deliver high-precision constraints on , , and via time delays. However, only one, iPTF16geu, has been found to date, and many more are needed to achieve these goals. To increase the multiply imaged SN Ia discovery rate, we present a simple algorithm for identifying gravitationally lensed SN Ia candidates in cadenced, wide-field optical imaging surveys. The technique is to look for supernovae that appear to be hosted by elliptical galaxies, but that have absolute magnitudes implied by the apparent hosts’ photometric redshifts that are far brighter than the absolute magnitudes of normal SNe Ia (the brightest type of supernovae found in elliptical galaxies). Importantly, this purely photometric method does not require the ability to resolve the lensed images for discovery. AGN, the primary sources of contamination that affect the method, can be controlled using catalog cross-matches and color cuts. Highly magnified core-collapse SNe will also be discovered as a byproduct of the method. Using a Monte Carlo simulation, we forecast that LSST can discover up to multiply imaged SNe Ia using this technique in a 10-year -band search, more than an order of magnitude improvement over previous estimates (Oguri & Marshall, 2010). We also predict that ZTF should find up to 10 multiply imaged SNe Ia using this technique in a 3-year -band search—despite the fact that this survey will not resolve a single system.
1 Introduction
Constraining , , and with lensing time delays is a key goal of modern precision cosmology (Treu, 2010). Currently, high-quality time delay measurements have only been obtained for quasars and active galactic nucleii (AGN, e.g., Vuissoz et al., 2008; Suyu et al., 2013; Tewes et al., 2013; Bonvin et al., 2016). However, other kinds of variable sources are better suited for the job. Using time delays from lensed supernovae to measure was first proposed by Refsdal (1964), and it has since been realized that Type Ia supernovae (SNe Ia) have many advantages over AGN and quasars as time delay indicators. Because they are standardizable candles, strongly lensed SNe Ia can be used to directly determine the lensing magnification factor , which breaks the degeneracy between the lens potential and the Hubble constant (Oguri & Kawano, 2003). Because they possess exceptionally well-characterized spectral sequences (e.g., Nugent et al., 2002; Pereira et al., 2013), time delays are less onerous to extract from SNe Ia than from AGN and quasars, which show considerable variation in light curve morphology across events. Also, the well known spectral energy distributions (SED) of SNe Ia allow one to correct for extinction along the paths of each SN Ia image—a huge advantage over AGN and quasars.
Despite these advantages, several challenges face SNe Ia as tools for time delay measurements. First, multiply imaged SNe Ia are rarer than multiply imaged quasars and AGN. Whereas the number of robust time delays from quasars is now in the double digits, only one multiply imaged SN Ia—iPTF16geu (Goobar et al., 2016)—has ever been found. Before this serendipitous event, only a multiply imaged core-collapse SN (Kelly et al., 2015a, b) and a few lensed, but not multiply imaged, SNe Ia had been discovered (Amanullah et al., 2011; Patel et al., 2014; Rodney et al., 2015; Petrushevska et al., 2016). Another challenge is that most SNe Ia are visible for only 100 days after they explode, whereas AGN and quasars can be monitored for variability over much longer time scales. Because high-resolution imaging or spectroscopy while an SN Ia is still active is necessary to measure a time delay, this creates pressure to identify strongly lensed SNe Ia as soon after explosion as possible. Quimby et al. (2014) classified an event as a lensed SN Ia that was previously thought to be a new type of superluminous supernova (Chornock et al., 2013). However, the classification was performed well after the event had faded and thus neither the properties of the lens system nor could be constrained. Finally, most strong gravitational lenses produce images that are separated by less than the resolution of ground-based optical surveys (Oguri, 2006). Images of iPTF16geu were detected just away from the center of a quiescent galaxy, yet the initial discovery was performed on an telescope with typical seeing of .
In this paper, we address these challenges by presenting a new technique for identifying gravitationally lensed SN Ia candidates. Our goal is to enable transient surveys to systematically search for multiply imaged SNe Ia in their data, and to make strongly lensed SNe Ia viable tools for precision cosmology. In Section 2, we present the technique and discuss its sources of contamination. In Section 3, we apply it to a Monte Carlo simulation of the source and lens populations to estimate the multiply imaged SN Ia yields of the Large Synoptic Survey Telescope (LSST; LSST Science Collaboration et al., 2009) and the Zwicky Transient Facility (ZTF; Bellm, 2014). We discuss the implications of our method in Section 4 and conclude in Section 5. Throughout this paper we assume a Planck Collaboration et al. (2016) cosmology with , , and .
2 The Method
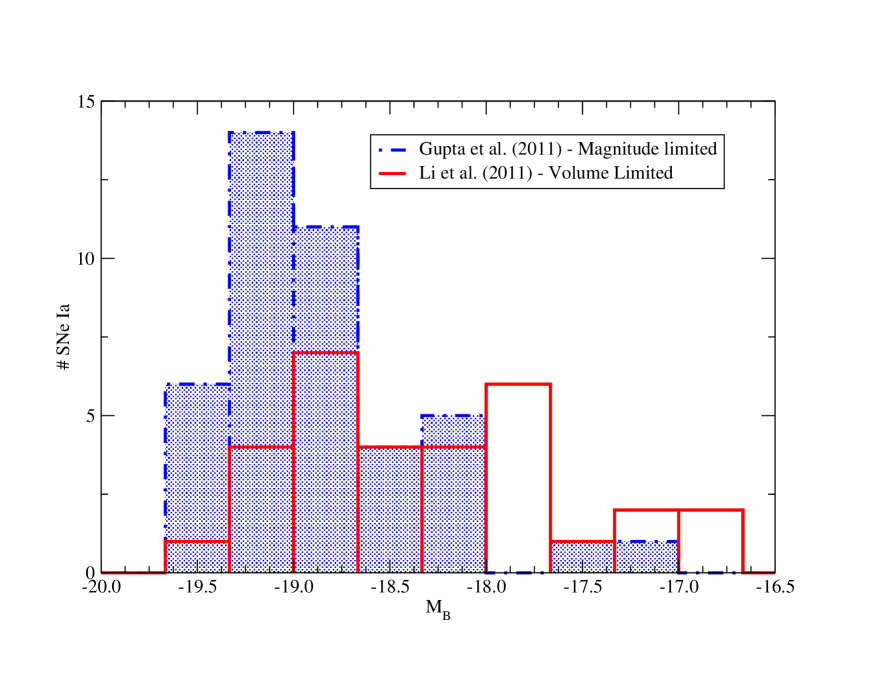
We consider the strong gravitational lensing of SNe Ia by quiescent (E/S0) galaxies, which have three properties that are useful to identify strongly lensed SNe Ia. First, normal SNe Ia are the brightest type of supernovae that have ever been observed to occur in quiescent galaxies (Maoz et al., 2014). Second, the absolute magnitudes of normal SNe Ia in quiescent galaxies are remarkably homogenous, even without correcting for their colors or lightcurve shapes , with a component of the population being underluminous (Li et al., 2011). Finally, due to the sharp 4000Å break in their spectra, quiescent galaxies tend to provide accurate photometric redshifts from large-scale multi-color galaxy surveys such as the Sloan Digital Sky Survey (SDSS; York et al., 2000).
A high-cadence, wide-field imaging survey can leverage these facts to systematically search for strongly lensed SNe Ia in the following way. First, by spatially cross-matching its list of supernova candidates with a catalog of quiescent galaxies for which secure photometric redshifts have been obtained, supernovae that appear to be hosted by quiescent galaxies can be identified. Empirically, it is likely that these supernovae are Type Ia. Not all galaxies with secure photometric redshifts are quiescent; some can show signs of ongoing star formation, in which case they may host core-collapse supernovae that can contaminate the sample. For this reason we follow Tojeiro et al. (2013) and select quiescent galaxies by requiring that in addition to secure photometric redshifts (i.e., ), they have a rest-frame color , to ensure that they are “red and dead.”
Assuming a standard CDM cosmology, distance moduli to the supernovae can be computed using the photometric redshifts, giving the absolute magnitudes. Because SNe Ia hosted in quiescent galaxies are expected to be normal to underluminous, their absolute magnitudes should be no brighter than in (see Figure 1). If a supernova candidate hosted in an elliptical galaxy has an absolute magnitude that is brighter than this, there is a strong chance that it is not actually in that galaxy, but is instead a background supernova lensed by the apparent host. Therefore, conservatively requiring:
| (1) |
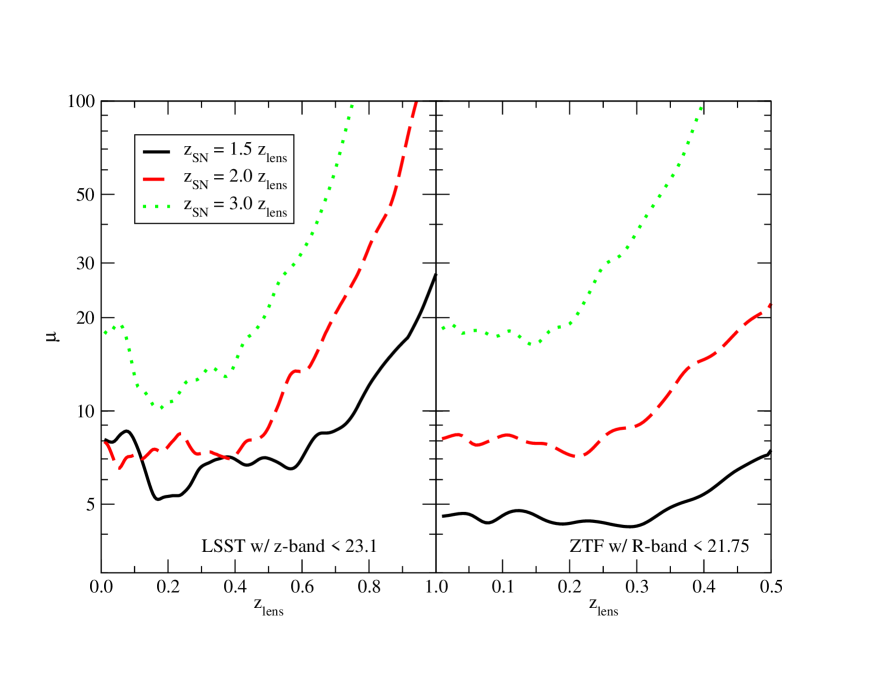
will produce a catalog of lensed SN Ia candidates, where is the peak apparent magnitude of the supernova in filter , is the CDM distance modulus evaluated at the photometric redshift of the apparent host galaxy, is the cross-filter -correction from the rest-frame -band to the observer frame -band (Kim et al., 1996), and is the inferred rest-frame -band absolute magnitude of the supernova. This is simply a statement that any supernova found to be brighter than an SN Ia at the photometrically determined distance to its potential quiescent host could be a lensed SN Ia. The magnification necessary for this method to be sensitive to various lensing systems is shown in Figure 2.
Applying this technique to a cross-match of Palomar Transient Factory (PTF) transients and SDSS galaxies satisfying the above criteria would have led to the discovery of iPTF16geu, as it appeared several magnitudes too bright to be associated with its apparent host, a lens galaxy. Although PTF has over a billion detections of variability in its transient database, performing the above cuts led to a catalog of only a few hundred transients. These are easy to vet by eye and will be the subject of a future paper.
An important property of this search technique is that it does not require the ability to resolve the lensed images to perform discovery. Once lensed SN Ia candidates are identified, they can be confirmed using high-resolution imaging, e.g., Laser Guide Star Adaptive Optics (LGSAO) or space-based imaging such as HST or, in the future, by the James Webb Space Telescope (JWST) and the Wide Field Infrared Space Telescope (WFIRST). If a retroactive search is being performed, then high-resolution imaging will yield lensed images of the supernova host galaxy, which provides strong indirect evidence for the lensed transient. Finally, if the supernova is still active, then a spectrum can confirm its redshift, and reveal features of the host and lens galaxies.
2.1 Sources of Contamination
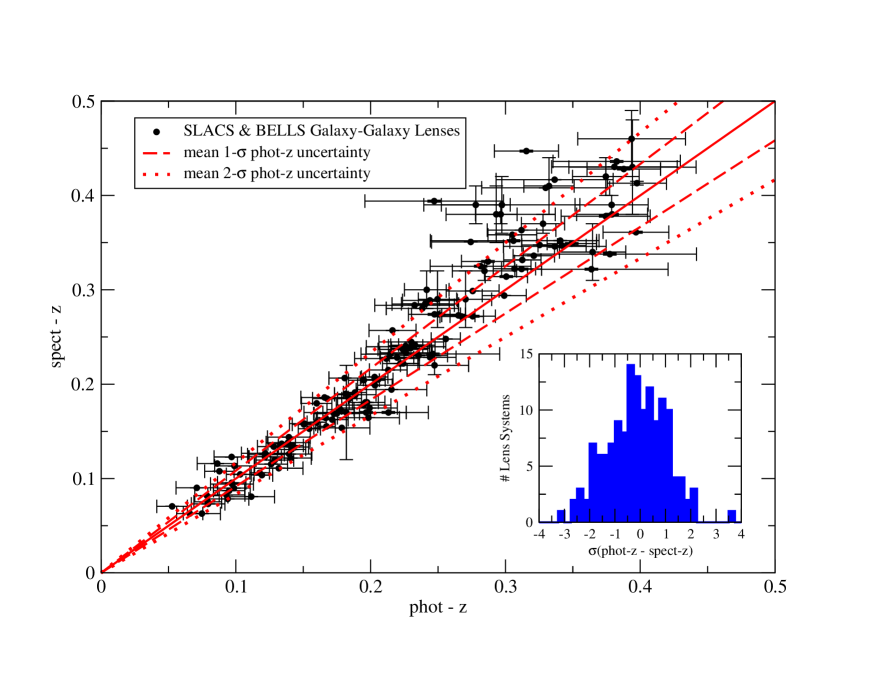
AGN are the greatest source of contamination for this technique. AGN lightcurves can occasionally resemble those of supernovae, and they can have , so spectroscopic followup may be necessary to distinguish between the two. To reduce AGN contamination, one can cross-match lens candidates against e.g., the Brescia et al. (2015) SDSS AGN catalog. Additionally, the photometric redshifts of the lens galaxies may be polluted by emission from the source galaxies. To understand this potential bias, we examined the difference between the photometrically and spectroscopically determined redshifts of the galaxy-galaxy lens systems in the Master Lens Database111http://slacs.astro.utah.edu (Moustakas et al. in preparation) for which the restframe photometrically determined . The majority of these systems are from the SLACS (Bolton et al., 2008) and BELLS (Brownstein et al., 2012) surveys found via the method presented in Bolton et al. (2004), in which background emission lines at higher redshift are seen on lower redshift lensing galaxies. The results are presented in Figure 3. The overall bias is just 0.5- towards lower redshift, which is not surprising as bluer light from high-redshift emission line galaxies contaminates the rest-frame UV of the lower-redshift quiescent lens galaxies. This small bias effectively increases the magnification requirement by 20%, as we have underestimated the distance to the putative lensing galaxy. This is a conservative overestimate of the bias, as these systems required the presence of strong emission lines in order to be found.
Finally, highly magnified core-collapse supernovae may also contaminate the sources found by this method. Given that they have , the rates of these events are expected to be much lower than lensed SNe Ia, as their discovery requires roughly an order of magnitude more magnification than SNe Ia.
3 Yields for Planned Surveys
Oguri & Marshall (2010) carried out detailed Monte Carlo simulations of the gravitationally lensed supernova and quasar yields of several cadenced optical imaging surveys, including LSST. They predicted that LSST should find roughly 45 multiply imaged SNe Ia over 10 years, but they assumed that only resolved systems (image separation for LSST) with a flux ratio could be discovered. In this section, we carry out analogous rate forecasts using the candidate identification technique presented in Section 2, which does not possess these constraints. We develop a statistical model of the source and lens populations and then perform a Monte Carlo simulation to calculate the yields for LSST and ZTF.
3.1 Lens Modeling
We model the mass distribution of the lens galaxies as a Singular Isothermal Ellipsoid (SIE; Kormann et al., 1994), which has shown excellent agreement with observations (e.g., Koopmans et al., 2009; More et al., 2016). The SIE convergence is given by:
| (2) |
where
| (3) |
In the above equations, is the velocity dispersion of the lens galaxy, is its ellipticity, and is its so-called “dynamical normalization,” a parameter related to three-dimensional shape. Here we make the simplifying assumption that there are an equal number of oblate and prolate galaxies, which Chae (2003) showed implies . As in Oguri et al. (2008), we assume follows a truncated normal distribution on the interval , with , . Finally, the orientation of the lens galaxy is assumed to be random.
We also include external shear to account for the effect of the lens environment (e.g., Kochanek, 1991; Keeton et al., 1997; Witt & Mao, 1997) The potential of the external shear is given by
| (4) |
where is the magnitude of the shear, and describes its orientation in the image plane. We assume follows a normal distribution with mean -1.30 and scale 0.2, consistent with the level of external shear expected from ray tracing in -body simulations (Holder & Schechter, 2003). The orientation of the external shear is assumed to be random.
We model the velocity distribution of elliptical galaxies as a modified Schechter function (Sheth et al., 2003):
| (5) |
where is the gamma function, and is the differential number of galaxies per unit velocity dispersion per unit comoving volume. We use the parameter values from SDSS (Choi et al., 2007): . We assume the mass distribution and velocity function do not evolve with redshift.
To convert Equation 5 into a redshift distribution, we use the definition of the comoving volume element:
| (6) |
where is the Hubble distance, in our assumed cosmology, and is the angular diameter distance. Since , for the all-sky galaxy distribution we have
| (7) |
3.2 SN Ia Modeling
SNe Ia exhibit a redshift-dependent volumetric rate and an intrinsic dispersion in rest-frame . In our model of the SN Ia population, we take the redshift-dependent SN Ia rate from Sullivan et al. (2000). We assume that the peak rest-frame is normally distributed with and . To realize SN Ia lightcurves, we employ the implementation of the one-component SN Ia spectral template of Nugent et al. (2002) provided by Barbary (2014), which automatically allows one to compute the cross-filter -corrections in Equation 1. For simplicity, we assume that the SNe Ia suffer no extinction.
3.3 Monte Carlo Simulation
We carried out a Monte Carlo simulation of the lens and source populations to forecast the yields of multiply imaged SNe Ia for LSST and ZTF. To perform the simulation, we generated galaxies with parameters realized at random from their underlying distributions. Assuming the galaxies were uniformly distributed on the sky, the average area on the sky “occupied” by a single galaxy was arcsec2.
For each lens galaxy, an effective lensing area of influence was estimated as a box centered on the galaxy, where is given by Equation 3 with . This box size was chosen to be large enough to accommodate the effects of ellipticity and external shear. One year’s worth of SNe Ia was realized at random locations in this box for each galaxy, at a rate amplified at all redshifts by a factor of to reduce shot noise. SNe Ia with were rejected. For each remaining source, we solved the lens equation using glafic (Oguri, 2010) to determine the magnification and image multiplicity.
Given the redshift of each lens galaxy, the peak implied by the redshift of the lens (“apparent host”) was calculated for each multiply imaged system according to Equation 1, taking to be the total magnification of the images. Multiply imaged SNe Ia satisfying and , where is the limiting magnitude of the survey in filter , were counted as “detections.”
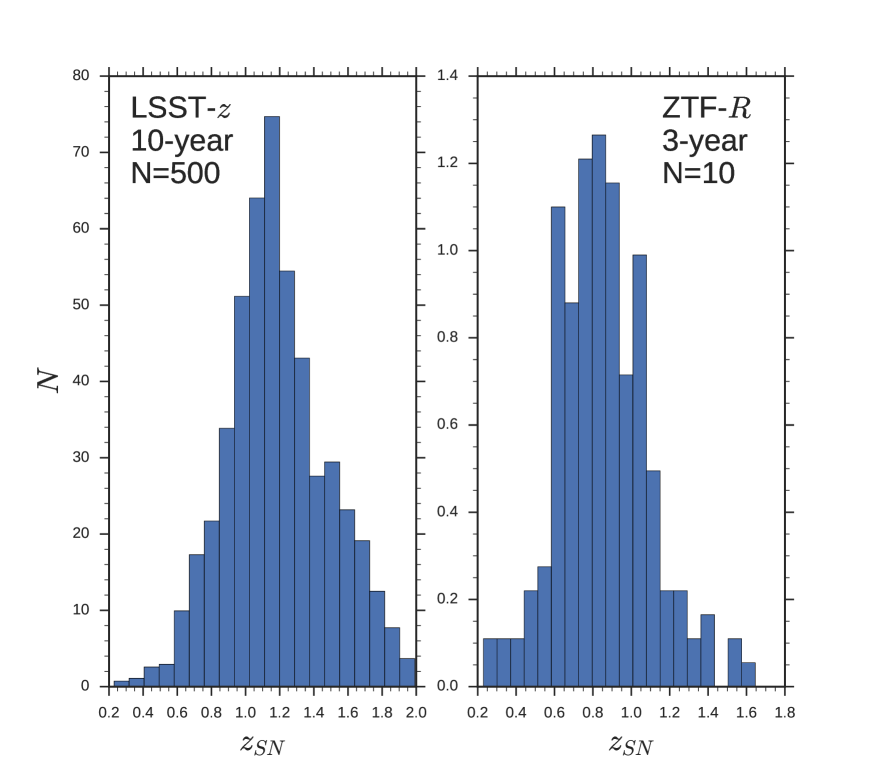
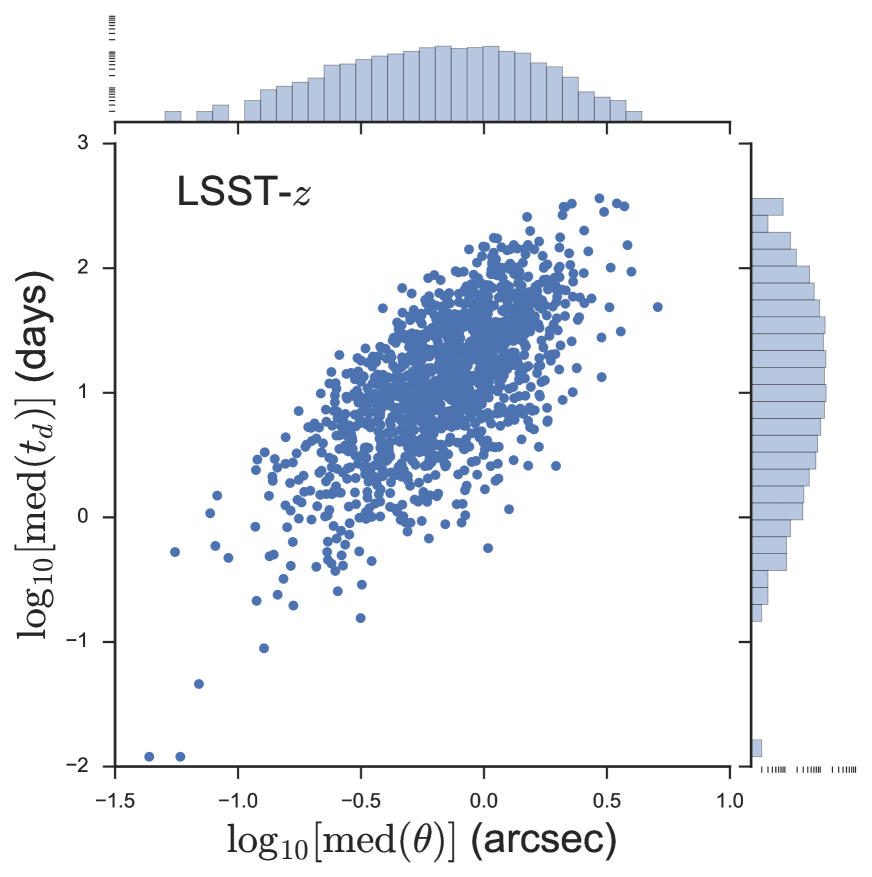
Given a nominal 20,000 □∘ search in LSST to () we would find 500 (281) multiply lensed SNe Ia via this method over a 10 year period (the drop in rest-frame SN Ia flux below 4000Å makes -band more efficient than -band at high-redshift). A 3 year, 10,000 □∘ ZTF survey to (obtained through weekly image co-addition) would yield 10 such SNe Ia. Assuming the magnification is due solely to the brightest image gives a conservative lower limit on yields: 220 SNe Ia for LSST- and 3 for ZTF-. Figure 4 shows the redshift distribution of multiply imaged SNe Ia that can be discovered in the total magnification case and Figure 5 shows the joint time delay-image separation distribution.
4 Discussion
As this technique will increase the detection of lensed SNe Ia in LSST by an order of magnitude and yield a few discoveries per year in ZTF, we now discuss potential improvements to this method as well as follow-up plans for these future discoveries. The most immediate improvement to this method is that one can not only use the incongruous brightness of a supernova to identify it as a potential lens candidate, but also its photometric evolution. Notwithstanding that a multiply imaged supernova will appear photometrically as the superposition of a few time-shifted lightcurves, both the shape of lensed SN Ia lightcurves and their colors will reflect their origin in a supernova that is both incompatible with its apparent host galaxy and is at higher redshift. Thus one should be able to relax the constraint in Equation 1 and use all the information in the transient’s lightcurve to identify a lensed supernova candidate. Furthermore, one could relax the requirement that one examine only quiescent galaxies and take a statistical approach involving the probability of the candidate being a superluminous supernova at the redshift of the host or a lensed supernova behind it. Given the rarity of such events, the contamination will likely be small and could easily be screened via rapid follow-up spectroscopy on 8-m class telescopes. Lensed core-collapse supernovae could be discovered via similar techniques.
Turning our attention to follow-up, a major difference between the work presented here and that of Oguri & Marshall (2010) is that the vast majority of the SNe Ia discovered via this method will have unresolved supernova images or low flux ratios. While the survey itself will provide an absolute measurement of the total magnification, follow-up resources with higher resolution and/or depth will be required to measure the relative magnification of each of the lensed supernova images. Space based facilities such as HST, JWST and WFIRST (Gehrels et al., 2015), given its proposed low-resolution IFU spectrograph (Perlmutter, 2014), are ideally set up to make these measurements from the optical through near-IR. However, even ground-based LGSAO would be well suited for these measurements in the near-IR.
Finally, Dobler & Keeton (2006) showed that microlensing may affect many of these systems. The SN Ia yields should remain invariant under microlensing, as the microlensing magnification distributions are roughly symmetric and centered around zero. Since microlensing is achromatic, the color curves of SNe Ia will be unaffected and one can use the multiple inflections in these curves to carry out time delay measurements.
5 Conclusion
In this paper, we have presented a simple, new method for discovering strongly gravitationally lensed SNe Ia in high-cadence, wide-field imaging surveys. We have calculated the nominal multiply-imaged SN Ia discovery rates for LSST and ZTF, and found them to be roughly an order of magnitude higher than previous estimates. Due to its effectiveness and ease of implementation, this technique will greatly increase the utility of gravitationally lensed SNe Ia as cosmological probes. As such, a renewed focus should be placed on their role in cosmological studies and how to maximize their scientific return.
References
- Amanullah et al. (2011) Amanullah, R., Goobar, A., Clément, B., et al. 2011, ApJ, 742, L7
- Barbary (2014) Barbary, K. 2014, doi:10.5281/zenodo.11938
- Bellm (2014) Bellm, E. 2014, in The Third Hot-wiring the Transient Universe Workshop, ed. P. R. Wozniak, M. J. Graham, A. A. Mahabal, & R. Seaman, 27–33
- Bolton et al. (2008) Bolton, A. S., Burles, S., Koopmans, L. V. E., et al. 2008, ApJ, 682, 964
- Bolton et al. (2004) Bolton, A. S., Burles, S., Schlegel, D. J., Eisenstein, D. J., & Brinkmann, J. 2004, AJ, 127, 1860
- Bonvin et al. (2016) Bonvin, V., Tewes, M., Courbin, F., et al. 2016, A&A, 585, A88
- Brescia et al. (2015) Brescia, M., Cavuoti, S., & Longo, G. 2015, MNRAS, 450, 3893
- Brownstein et al. (2012) Brownstein, J. R., Bolton, A. S., Schlegel, D. J., et al. 2012, ApJ, 744, 41
- Chae (2003) Chae, K.-H. 2003, MNRAS, 346, 746
- Choi et al. (2007) Choi, Y.-Y., Park, C., & Vogeley, M. S. 2007, ApJ, 658, 884
- Chornock et al. (2013) Chornock, R., Berger, E., Rest, A., et al. 2013, ApJ, 767, 162
- Dobler & Keeton (2006) Dobler, G., & Keeton, C. R. 2006, ApJ, 653, 1391
- Gehrels et al. (2015) Gehrels, N., Spergel, D., & WFIRST SDT Project. 2015, Journal of Physics Conference Series, 610, 012007
- Goobar et al. (2016) Goobar, A., Amanullah, R., Kulkarni, S. R., et al. 2016, ArXiv e-prints, arXiv:1611.00014
- Gupta et al. (2011) Gupta, R. R., D’Andrea, C. B., Sako, M., et al. 2011, ApJ, 740, 92
- Holder & Schechter (2003) Holder, G. P., & Schechter, P. L. 2003, ApJ, 589, 688
- Keeton et al. (1997) Keeton, C. R., Kochanek, C. S., & Seljak, U. 1997, ApJ, 482, 604
- Kelly et al. (2015a) Kelly, P. L., Rodney, S. A., Treu, T., et al. 2015a, Science, 347, 1123
- Kelly et al. (2015b) Kelly, P. L., Brammer, G., Selsing, J., et al. 2015b, ArXiv e-prints, arXiv:1512.09093
- Kim et al. (1996) Kim, A., Goobar, A., & Perlmutter, S. 1996, PASP, 108, 190
- Kochanek (1991) Kochanek, C. S. 1991, ApJ, 373, 354
- Koopmans et al. (2009) Koopmans, L. V. E., Bolton, A., Treu, T., et al. 2009, ApJ, 703, L51
- Kormann et al. (1994) Kormann, R., Schneider, P., & Bartelmann, M. 1994, A&A, 284, 285
- Li et al. (2011) Li, W., Leaman, J., Chornock, R., et al. 2011, MNRAS, 412, 1441
- LSST Science Collaboration et al. (2009) LSST Science Collaboration, Abell, P. A., Allison, J., et al. 2009, ArXiv e-prints, arXiv:0912.0201
- Maoz et al. (2014) Maoz, D., Mannucci, F., & Nelemans, G. 2014, ARA&A, 52, 107
- More et al. (2016) More, A., Suyu, S. H., Oguri, M., More, S., & Lee, C.-H. 2016, ArXiv e-prints, arXiv:1611.04866
- Nugent et al. (2002) Nugent, P., Kim, A., & Perlmutter, S. 2002, PASP, 114, 803
- Oguri (2006) Oguri, M. 2006, MNRAS, 367, 1241
- Oguri (2010) —. 2010, PASJ, 62, 1017
- Oguri & Kawano (2003) Oguri, M., & Kawano, Y. 2003, MNRAS, 338, L25
- Oguri & Marshall (2010) Oguri, M., & Marshall, P. J. 2010, MNRAS, 405, 2579
- Oguri et al. (2008) Oguri, M., Inada, N., Strauss, M. A., et al. 2008, AJ, 135, 512
- Patel et al. (2014) Patel, B., McCully, C., Jha, S. W., et al. 2014, ApJ, 786, 9
- Pereira et al. (2013) Pereira, R., Thomas, R. C., Aldering, G., et al. 2013, A&A, 554, A27
- Perlmutter (2014) Perlmutter, S. 2014, in American Astronomical Society Meeting Abstracts, Vol. 223, American Astronomical Society Meeting Abstracts #223, 341.04
- Petrushevska et al. (2016) Petrushevska, T., Amanullah, R., Goobar, A., et al. 2016, A&A, 594, A54
- Planck Collaboration et al. (2016) Planck Collaboration, Ade, P. A. R., Aghanim, N., et al. 2016, A&A, 594, A13
- Quimby et al. (2014) Quimby, R. M., Oguri, M., More, A., et al. 2014, Science, 344, 396
- Refsdal (1964) Refsdal, S. 1964, MNRAS, 128, 307
- Rodney et al. (2015) Rodney, S. A., Patel, B., Scolnic, D., et al. 2015, ApJ, 811, 70
- Sheth et al. (2003) Sheth, R. K., Bernardi, M., Schechter, P. L., et al. 2003, ApJ, 594, 225
- Sullivan et al. (2000) Sullivan, M., Ellis, R., Nugent, P., Smail, I., & Madau, P. 2000, MNRAS, 319, 549
- Suyu et al. (2013) Suyu, S. H., Auger, M. W., Hilbert, S., et al. 2013, ApJ, 766, 70
- Tewes et al. (2013) Tewes, M., Courbin, F., Meylan, G., et al. 2013, A&A, 556, A22
- Tojeiro et al. (2013) Tojeiro, R., Masters, K. L., Richards, J., et al. 2013, MNRAS, 432, 359
- Treu (2010) Treu, T. 2010, ARA&A, 48, 87
- Vuissoz et al. (2008) Vuissoz, C., Courbin, F., Sluse, D., et al. 2008, A&A, 488, 481
- Witt & Mao (1997) Witt, H. J., & Mao, S. 1997, MNRAS, 291, 211
- York et al. (2000) York, D. G., Adelman, J., Anderson, Jr., J. E., et al. 2000, AJ, 120, 1579