CMS CR-2016/411
Measurement of top quark polarisation in t-channel single top quark production
Andres Tiko on behalf of the CMS collaboration
National Institute of Chemical Physics and Biophysics
Tallinn, Estonia
A first measurement of the top quark spin asymmetry, sensitive to the top quark polarisation, in -channel single top quark production is presented. It is based on a sample of pp collisions at a centre-of-mass energy of 8 TeV corresponding to an integrated luminosity of 19.7 . A high-purity sample of -channel single top quark events with an isolated muon is selected. Signal and background components are estimated using a fit to data. A differential cross section measurement, corrected for detector effects, of an angular observable sensitive to the top quark polarisation is performed. The differential distribution is used to extract a top quark spin asymmetry of , which is compatible with a p-value of with the standard model prediction of 0.44.
PRESENTED AT
International Workshop on Top Quark Physics
Olomouc, Czech Republic, September 19–23, 2016
1 Introduction
The top quark is the heaviest elementary particle discovered so far. Its lifetime ( s) is much shorter than the typical timescales of quantum chromodynamics (QCD).
Therefore, top is the only quark that decays before hadronising. Furthermore, the Standard Model (SM) predicts that only left-handed quarks are produced at the Wtb vertex. Thus, top quark’s decay products retain memory of its spin in their angular distributions, providing a probe to investigate the structure of the Wtb vertex.
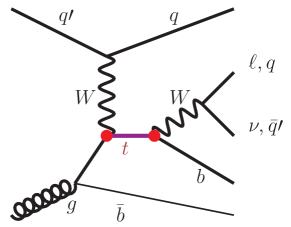
In electroweak -channel single top quark production, shown in figure 1, SM predicts that produced top quarks are highly polarised, as a consequence of the V–A coupling structure, along the direction of the momentum of the spectator quark (), which recoils against the top quark [2, 3].
New physics models can lead to a depolarisation in production by altering the coupling structure [4, 5, 6, 7]. In this way, measuring single top quark polarisation is an important test of SM.
2 Event selection and estimation of signal and background contributions
The decay products of the single top quark can be seen in Figure 1. We select the events where the W-boson decays to a muon and a corresponding neutrino, due to which we see a considerable amount of missing energy in the detector. We also observe 2 jets, one of which is b-tagged, corresponding to the jet from the top quark decay. The second jet (“spectator jet”) is light. There can also be a second b-jet, produced in association with the top quark, but usually it escapes detection.
The largest background processes mimicking the signal signature are top-antitop pair production (), production of a W-boson in association with jets (W+jets) and QCD multijet production. To discriminate between the signal and background processes, we train boosted decision tree (BDT) classifiers.
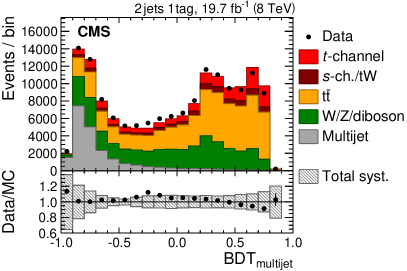
The first BDT, , is trained to separate signal and QCD multijet events. The most important variable is the transverse mass of the reconstructed W boson. The distribution can be seen in Figure 2.
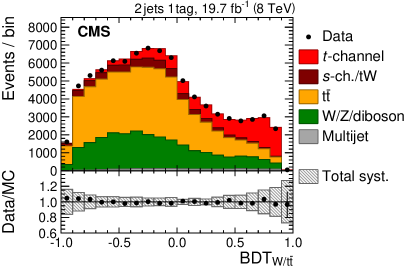
Another BDT, , is trained for separating out W+jets and backgrounds. Here, the variables having the largest influence on the BDT are the pseudorapidity of the light jet and reconstructed top quark mass.
The same same distribution is used to fit the contributions of signal and background components to data.
3 Polarisation and spin asymmetry
In this analysis, the top quark spin asymmetry
| (1) |
is used to probe the coupling structure, where represents the top quark polarisation in production and denotes the degree of the angular correlations of one of its decay products, denoted , with respect to the spin of the top quark, the so-called spin-analysing power. The variables and are defined, for each top quark decay product from the decay chain , as the number of instances in which that decay product is aligned or antialigned, respectively, relative to the direction of the recoiling spectator quark momentum. We choose muon as the spin analyser () because SM at leading order, as well as for its high identification efficiency in CMS.
The angle between a top quark decay product and an arbitrary polarisation axis in the top quark rest frame, , is distributed according to the following differential cross section:
| (2) |
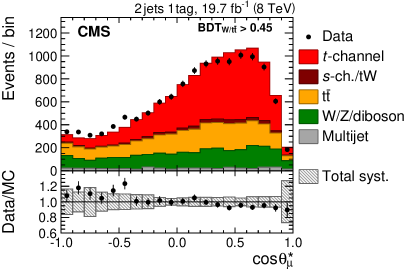
In SM, the top quark spin tends to be aligned with the direction of the spectator quark, so we expect a rising slope for the angle between the muon and the spectator jet. Hence, an excess of antialigned would be a clear indication of an anomalous coupling structure.
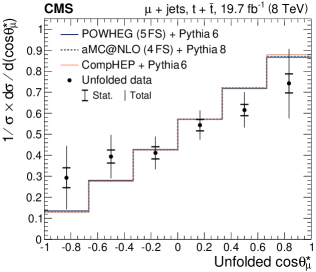
Figure 3 (left) shows the reconstructed distribution of (for ) The observed distribution is expected to differ from the parton-level prediction because of detector effects and the kinematic selection applied, with the most significant effect being the relatively small number of selected events close to . An overall trend in the ratio between data and simulation is observed that suggests a slightly less asymmetric shape than predicted by the SM.
4 Unfolding
In this analysis, we perform background subtraction and unfolding on the measured distribution.
Unfolding the distribution to parton level accounts for distortions from detector acceptance, selection efficiencies, imperfect top quark reconstruction, and the approximation of treating the untagged jet direction as the spectator quark direction. We use a regularised matrix inversion procedure for unfolding [9]. The unfolded distribution is shown on the right in Figure 3.
The value of asymmetry is obtained from the unfolded distribution by a -fit according to Eq. (2), taking into account correlations. The results are tested for bias by injecting anomalous Wtb-coupling events as pseudo-data.
5 Results
For the asymmetry, we obtain a value of: . Compared to the SM prediction of 0.44 by POWHEG at NLO, the result is compatible with a p-value of p( data — SM ) = 4.6%, which corresponds to a difference of 2.0 standard deviations. Separate results for top quarks and antiquarks are compatible with the combined result.
References
- [1] CMS collaboration, V. Khachatryan et al., JHEP 04, 1–42 (2016)
- [2] G. Mahlon and S. Parke, Phys. Lett. B, 476 323-330, 2000
- [3] M. Jeżabek and J.H. Kühn, Phys. Lett. B, 329 317-324, 1994
- [4] J. A. Aguilar-Saavedra and J. Bernabeu, Nucl. Phys. B, 840, 349 (2010)
- [5] J. A. Aguilar-Saavedra, Nucl. Phys. B, 804, 160 (2008)
- [6] J. A. Aguilar-Saavedra, Nucl. Phys. B, 812, 181 (2009)
- [7] F. Bach and T. Ohl, Phys. Rev. D, 86, 114026 (2012)
- [8] CMS Collaboration, JINST, 3, S08004, (2008)
- [9] V.Blobel, Advanced statistical techniques in particle physics. Proceedings, Durham, UK, 258 (2002)