Mid-infrared spectra of comet nuclei
Abstract
Comet nuclei and D-type asteroids have several similarities at optical and near-IR wavelengths, including near-featureless red reflectance spectra, and low albedos. Mineral identifications based on these characteristics are fraught with degeneracies, although some general trends can be identified. In contrast, spectral emissivity features in the mid-infrared provide important compositional information that might not otherwise be achievable. Jovian Trojan D-type asteroids have emissivity features strikingly similar to comet comae, suggesting that they have the same compositions and that the surfaces of the Trojans are highly porous. However, a direct comparison between a comet and asteroid surface has not been possible due to the paucity of spectra of comet nuclei at mid-infrared wavelengths. We present 5–35 µm thermal emission spectra of comets 10P/Tempel 2, and 49P/Arend-Rigaux observed with the Infrared Spectrograph on the Spitzer Space Telescope. Our analysis reveals no evidence for a coma or tail at the time of observation, suggesting the spectra are dominated by the comet nucleus. We fit each spectrum with the near-Earth asteroid thermal model (NEATM) and find sizes in agreement with previous values. However, the NEATM beaming parameters of the nuclei, 0.74 to 0.83, are systematically lower than the Jupiter-family comet population mean of 1.030.11, derived from 16- and 22-µm photometry. We suggest this may be either an artifact of the spectral reduction, or the consequence of an emissivity low near 16 µm. When the spectra are normalized by the NEATM model, a weak 10-µm silicate plateau is evident, with a shape similar to those seen in mid-infrared spectra of D-type asteroids. A silicate plateau is also evident in previously published Spitzer spectra of the nucleus of comet 9P/Tempel 1. We compare, in detail, these comet nucleus emission features to those seen in spectra of the Jovian Trojan D-types (624) Hektor, (911) Agamemnon, and (1172) Aneas, as well as those seen in the spectra of seven comet comae. The comet comae present silicate features with two distinct shapes, either trapezoidal, or more rounded, the latter apparently due to enhanced emission near 8 to 8.5 µm. The surfaces of Tempel 2, Arend-Rigaux, and Hektor best agree with the comae that present trapezoidal features, furthering the hypothesis that the surfaces of these targets must have high porosities in order to exhibit a spectrum similar to a comet coma. An emissivity minimum at 15 µm, present in the spectra of Tempel 2, Arend-Rigaux, Hektor, and Agamemnon, is also described, the origin of which remains unidentified. The compositional similarity between D-type asteroids and comets is discussed, and our data supports the hypothesis that they have similar origins in the early Solar System.
1 Introduction
At the heart of every comet is a nucleus composed of dust, ice, and gas. Under certain circumstances the nucleus can be observed with remote sensing techniques. Reflectance spectroscopy of comet nuclei has revealed spectral similarities akin to certain asteroid taxonomic classes (Tholen 1984, Bus and Binzel 2002, DeMeo et al. 2009). Classification in these taxonomy schemes is typically based on principal component analysis of color photometry or spectra, including tests for the presence or absence of certain spectral features and consideration of overall spectral slope. There are approximately two dozen classes and sub-classes of asteroids. The spectra of some cometary nuclei resemble those asteroid classes with red-sloped reflectance spectra lacking strong spectral features.
Comet nuclei tend to have linear reflectance spectra, with red slopes up to 20% in flux per 0.1 µm in the optical (see Jewitt 2002, Campins et al. 2007, and references therein). D-type asteroids have similar slopes (7–14% per 0.1 µm Fitzsimmons et al. 1994). Six comets studied by DeMeo and Binzel (2008) were classified as D-, T-, and X-type taxonomies (in a general sense, T-type spectra are intermediate to D-type and the more shallowly sloped X-type spectra). By contrast, spectroscopy of comets 133P/Elst-Pizarro and 176P/LINEAR (Licandro et al. 2011) reveals B-type asteroid class spectra, i.e., blue-to-neutrally sloped in the optical, with an apparent near-UV absorption feature. Both of these latter comets have orbits and spectral classifications similar to the Themis collisional family of the outer main asteroid belt (Hsieh and Jewitt 2006, Licandro et al. 2011), suggesting they have similar origins.
The paucity of features in the reflectance spectra of comets, and D-, T-, and X-type asteroids limits surface compositional interpretations. Campins et al. (2006) compared the nucleus spectrum of comet 162P/Siding Spring to those of chondritic meteorites, but found no appropriate matches. Instead, synthetic mixtures of amorphous carbon, pyroxenes, and/or organic compounds produced spectra similar to that of the comet surface. However, unambiguous and unique conclusions regarding the nucleus surface composition of 162P was not possible due to degeneracies in the models used to generate the synthetic spectra. Emery et al. (2011) also used synthetic mixtures of various silicates and carbon to reproduce the observed near-IR (0.7–2.5 µm) spectra of 58 Jovian Trojan asteroids with D- and X-type classifications. They concluded that the Trojan population has a bimodal composition, but refrained from identifying specific minerals.
Hiroi et al. (2001) examined samples of the Tagish Lake meteorite, an aqueously altered carbonaceous chondrite, and demonstrated that these meteorite fragments have optical to near-IR spectra similar to those of T- and D-type asteroids. This meteorite also has a 3-µm absorption band indicative of hydration, a feature that is present in spectra of the T-type asteroid (308) Polyxo (Hiroi and Hasegawa 2003, Takir and Emery 2012), but absent from the D-type population (Jones et al. 1990, Hiroi et al. 2001, Emery and Brown 2003). Clearly, without the 3-µm study, an incorrect assumption would have resulted, i.e., that all three samples (Tagish Lake, D-types, and T-types) have similar compositions. These examples demonstrate the difficulty in understanding the composition of spectrally bland surfaces over limited wavelength regimes.
Mid-infrared spectroscopy ( µm) of asteroids, dominated by thermal emission from the surface, is also sensitive to surface composition. Thermal emission spectra can present diagnostic spectral features from asteroids that would otherwise be featureless in reflectance (Dotto et al. 2004, Marchis et al. 2012). Considering, again, the Tagish Lake meteorite, Vernazza et al. (2013) find an excellent match in the mid-infrared with asteroid (368) Haidea but poor agreement with (617) Patroclus, despite the fact that both asteroids have nearly identical near-infrared reflectance spectra.
Emery et al. (2006) observed three Jovian Trojans (D-types) with the Spitzer Space Telescope, revealing an emissivity plateau near 10 µm and a broad rise in the 18–28 µm spectral region, including narrow and subtle spectral features at 20 and 34 µm. The gross shapes and locations of the features were remarkably similar to those found in the spectra of the comae around comets C/1995 O1 (Hale-Bopp) and 29P/Schwassmann-Wachmann 1 (Crovisier et al. 1997, Stansberry et al. 2004). Emery et al. (2006) attribute the spectral similarity to the presence of small silicate grains on the surfaces of these asteroids. They posit that the grains are suspended in a transparent matrix or porous structure (i.e., the “fairy-castle” structures described by Hapke and van Horn 1963), enabling the silicates to emit without interference from nearby absorbing or scattering grains, much as an isolated grain would in a comet coma.
Comets 10P/Tempel 2 and 49P/Arend-Rigaux are Jupiter-family comets (JFCs) well known for having large nuclei and weak or negligible coma activity during their approach to perihelion. Thus, the bare nuclei of these comets can be studied and contrasted with asteroid spectra at optical and mid-infrared wavelengths. Here, we present Spitzer Space Telescope spectroscopy and imaging of the nuclei of comets Tempel 2 and Arend-Rigaux. We also present a spectrum of the nucleus of comet 9P/Tempel 1 from Lisse et al. (2005). In Section 2, we summarize the known properties of each comet, the observations, and our reduction methods. In Section 3, we describe the near-Earth asteroid thermal model (NEATM) of Harris (1998) as it applies to comets. In Section 4, we apply the NEATM to our data, and present derived thermal parameters and emissivity spectra. We compare the spectra of these three comet nuclei to spectra of Jovian D-type asteroids, and active comets. Our conclusions are summarized in Section 5.
2 Targets, Observations, and Reduction
Comet Tempel 2, discovered on 4 July 1873, is a JFC with a period of 5.4 yr and a perihelion distance of 1.42 au (comet discovery and orbital data are from JPL HORIZONS; Giorgini et al. 1996). The comet’s coma is faint, and appreciable activity is usually not seen until 100 days before perihelion at heliocentric distances, , 1.75 au (Sekanina 1979). Jewitt and Luu (1989) found that the coma onset began near au in 1988 (160 days pre-perihelion). However, observations of the comet by Reach et al. (2013) at 3.2 au in 2009 (340 days pre-perihelion) revealed a faint gas coma (CO2 or CO) without a clear dust counterpart. A’Hearn et al. (1989) presented simultaneous optical and infrared photometry of Tempel 2. They found a moderate coma contribution (%) to the optical light, but that the coma was undetectable at the 10% level in the IR. The optical and IR light curves are in phase, leading A’Hearn et al. (1989) to conclude that most of the radiation comes from a rotating nucleus with a maximum effective radius of 5.9 km (using the standard thermal model for asteroids; Lebofsky et al. 1986), an axial ratio , and a geometric albedo, , of 0.022 in the optical with a reflectivity gradient of 15% per 0.1 µm. Jewitt and Luu (1989) later revised the albedo to . Comet Tempel 2 has an extensive dust trail, stretching out to 60∘ of mean anomaly from the nucleus as observed by the Infrared Astronomical Satellite (Sykes et al. 1990).
Comet Arend-Rigaux, discovered on 5 February 1951, has a period of 6.7 yr and a perihelion distance of 1.43 au. Similar to the behavior of Tempel 2, Arend-Rigaux also has a delayed onset of pre-perihelion activity, and weak overall activity. Activity is not readily apparent in the comet’s total magnitude until 100 days before perihelion111For example, see Seichii Yoshida’s compiled lightcurves: http://www.aerith.net/comet/catalog/0049P/index.html. Tokunaga and Hanner (1985) observed the comet in the infrared in January 1985 (1.54 au, 0.57 au), and found a nucleus-dominated aperture profile with no evidence for a dust coma. They estimate an effective radius of 4.4–5.1 km by fitting the thermal emission with a 310 K blackbody sphere. Brooke and Knacke (1986) interpreted their own infrared observations taken about a month later with the thermal model of Morrison and Lebofsky (1979) and derived an effective radius of km with . The low albedo and size was confirmed by Veeder et al. (1987) and Millis et al. (1988); the latter team estimated the nucleus to have an equivalent prolate spheroidal shape of km ( km effective radius at their observed maximum) and . Several investigators pointed out the similarity of the reflectance spectra of Arend-Rigaux’s nucleus to those of D-type asteroids (Brooke and Knacke 1986, Veeder et al. 1987, Millis et al. 1988). Luu (1993) describes optical spectra of this comet at 2.2–2.4 au with a reflectivity gradient of 9–11% per 0.1 µm.
Comet Tempel 1, discovered 3 April 1867, has a period of 5.6 yr and a perihelion distance of 1.54 au. In contrast to Tempel 2 and Arend-Rigaux, Tempel 1 has a typical activity level for its size. Lisse et al. (2005) estimated the active fraction, the ratio of the surface area required to match the water production rate to the surface area of the nucleus, to be 92%. This fraction is much larger than the estimates for Tempel 2 and Arend-Rigaux approximately 1% and 1%, respectively (Millis et al. 1988, A’Hearn et al. 1989). Based on the compilation of photometry by Meech et al. (2005), the first signs of activity of comet Tempel 1 occur between 600 and 400 days before perihelion (4–3 au). Spitzer images of the comet at 478 and 464 days pre-perihelion (3.7 au) show no evidence for near aphelion activity (Lisse et al. 2005, Reach et al. 2007), and neither do -band images at 4.2 au post-perihelion (Hergenrother et al. 2007). The comet was the target of the 2005 Deep Impact mission to excavate material from the near surface of a nucleus (A’Hearn et al. 2005), and the 2011 Stardust-NExT mission to image the impact crater and other surface feature variations (Veverka et al. 2013). Based on the spacecraft images and photometry, the nucleus has a mean radius of 2.80.1 km (Thomas et al. 2013a), , and a reflectivity gradient of 12.51% per 0.1 µm in the optical (Li et al. 2007).
We and others obtained mid-infrared spectra of comets Tempel 2, Arend-Rigaux, and Tempel 1 using the Infrared Spectrograph (IRS; Houck et al. 2004) on the Spitzer Space Telescope (Werner et al. 2004, Gehrz et al. 2007). A summary of the observing geometry for each comet is presented in Table 1. The observations were made with the short-wavelength low-resolution (SL) and the long-wavelength low-resolution (LL) modules. Both modules have a spectral resolving power of . The low-resolution IRS modules each use two slits to record data via two different spectral orders. The first-order SL slit (SL1) covers 7.5–14.3 µm, and the second-order slit simultaneously covers 5.1–7.6 (SL2) and 7.3–8.7 µm (SL3). Similarly, LL covers 19.9–39.9 (LL1), 13.9–21.3 (LL2), and 19.2–21.6 µm (LL3). The Tempel 1 and Tempel 2 observations used the SL1 and all LL orders, whereas the Arend-Rigaux observations used all SL and LL orders. All three comets were observed with the 16-µm peak-up array for target acquisition. The Tempel 2 and Arend-Rigaux data were processed with the Spitzer Science Center’s S18.18 IRS pipeline (Spitzer Science Center 2012). Tempel 1 was processed with pipeline version S10.5 (Lisse et al. 2005).
Target Inst. AOR Key Start Time Phase (UT) (s) (days) (AU) (AU) (∘) 9P/Tempel 1a IRS 9347328 2004-03-26 03:05 2880 -466.2 3.70 3.52 15.6 10P/Tempel 2 IRS 6616576 2004-06-25 19:34 612 -234.9 2.57 2.31 23.3 10P/Tempel 2 MIPSb 6614272 2004-07-08 10:22 140c -221.6 2.49 2.39 24.0 49P/Arend-Rigaux MIPSb 10300416 2004-12-05 14:18 42c -81.0 1.64 0.99 35.3 49P/Arend-Rigaux IRS 16206592 2006-03-07 02:31 900 375.4 3.56 3.43 16.3
Table columns—Inst.: Spitzer instrument; AOR Key: Spitzer astronomical observation request key; : total time on source; : Difference between observation date, , and perihelion date, ; : heliocentric distance; : Spitzer-comet distance; Phase: Sun-comet-Spitzer angle.
a Lisse et al. (2005). The other AORs used in our Tempel 1 analysis (9347584, 9348608, and 9348864) are taken within 21 hr of the listed observation. The listed exposure time is for all four observations.
b Reach et al. (2007).
c Time per pixel at the comet location.
2.1 Peak-up acquisition images
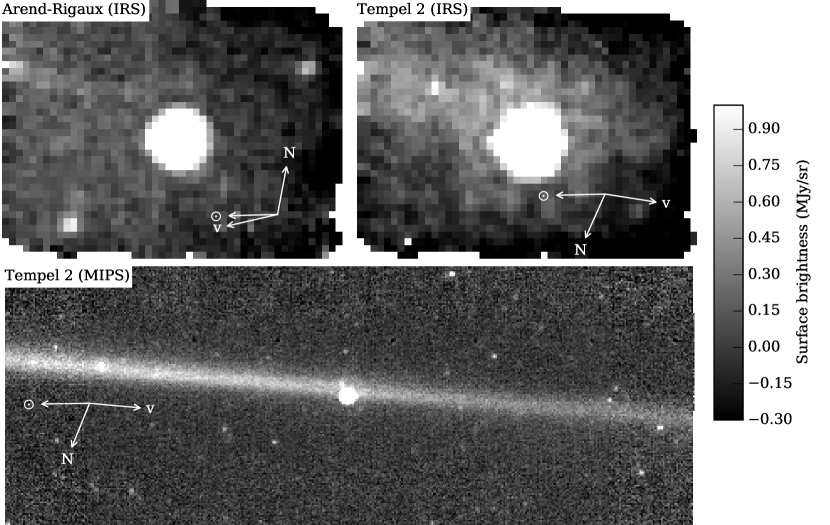
Images of each comet (Fig. 1) were taken with the IRS peak-up arrays in peak-up acquisition mode. The images were used by Spitzer to acquire the nucleus to provide positioning of the object in the IRS slits. The peak-up acquisition photometric calibration uncertainty is 3% for the 16-µm array (Spitzer Science Center 2012). We averaged all acquisition images of Tempel 2 and Arend-Rigaux in the rest frame of each comet using the MOPEX software package (Makovoz and Khan 2005).
2.2 Other images
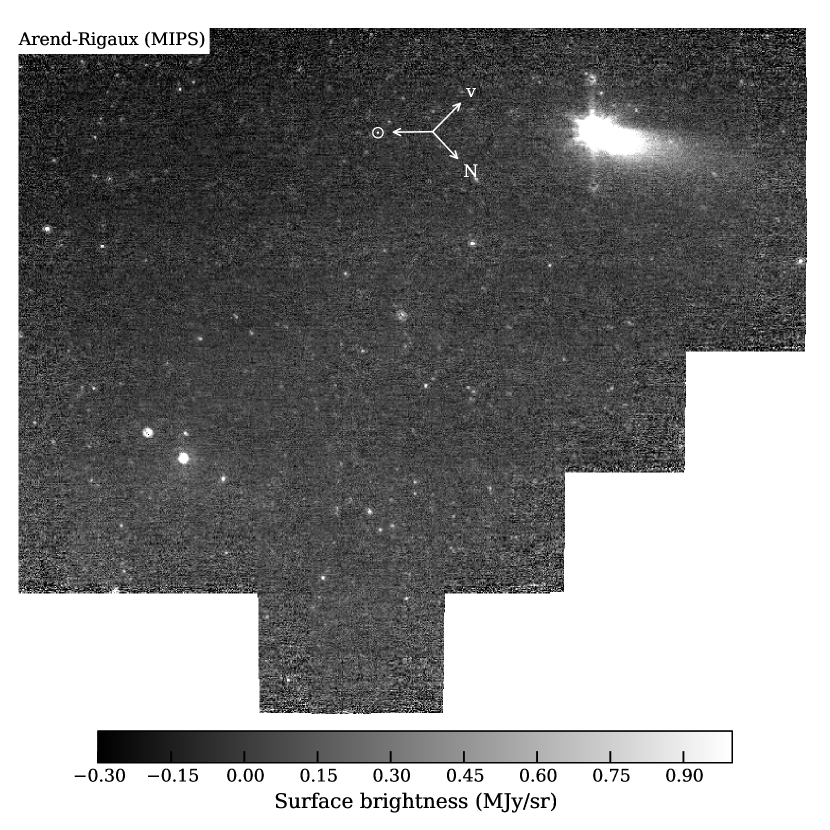
For additional context, we obtained images of comets Tempel 2 and Arend-Rigaux with Spitzer’s Multiband Imaging Photometer (MIPS) 24-µm camera (Rieke et al. 2004) from Reach et al. (2007). This instrument uses a broad-band 24-µm filter and a 128128 pixel array with a pixel scale of 2.55′′. The observing details for each comet at the epoch of the MIPS observations are listed in Table 1. The MIPS image of comet Tempel 2 was taken just two weeks after our IRS data (Fig. 1), and the MIPS image of comet Arend-Rigaux was taken 15 months before our IRS data with the comet much more active at 1.6 au from the Sun (Fig. 2).
2.3 Spectra
The Tempel 2 and Arend-Rigaux spectra were reduced with the Spitzer Science Center’s SPICE reduction package222Available at the NASA/IPAC Infrared Science Archive, http://irsa.ipac.caltech.edu/data/SPITZER/docs/dataanalysistools/. We used the default point source aperture sizes to extract the spectra from each observation. The point source aperture sizes are tuned to follow the wavelength dependence of the point-spread function. Our targets appear to be point sources, and an aperture correction typically needed for observations of extended sources is not necessary. The targets were placed at two or three positions within each slit, with three array readouts at each position. For each wavelength, we averaged the redundant spectra together, rejecting outliers at the 2.5- level or greater.
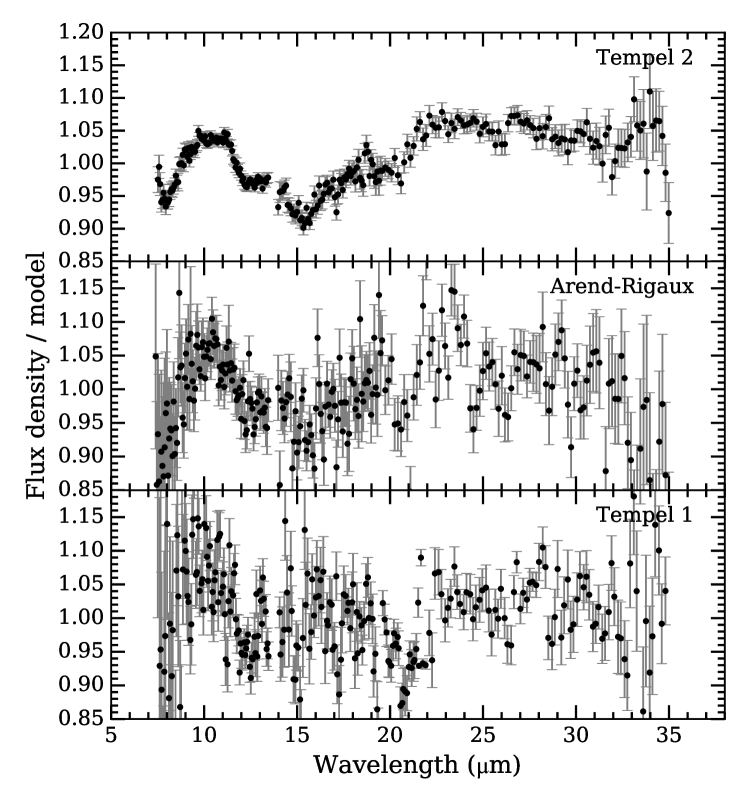
The spectra of comet Tempel 2 from each slit were combined, removing order overlaps, to produce a near-continuous spectrum. We corrected an apparent module-to-module offset, potentially caused by a misalignment of the source and slit (Spitzer Science Center 2012), by scaling the SL spectra by 1.12. The scaling constant was derived by linear interpolation of the SL and LL spectra over the gap at 14 µm. The SL1 module has a data artifact of additional emission at 13.5–14.2 µm known as the “teardrop,” most likely due to an internal reflection (Spitzer Science Center 2012). Visual inspection of the raw images reveals its presence in our data. We remove this portion of the spectrum, and present the final spectrum of comet Tempel 2 in Fig. 3 and in the on-line supplementary material.
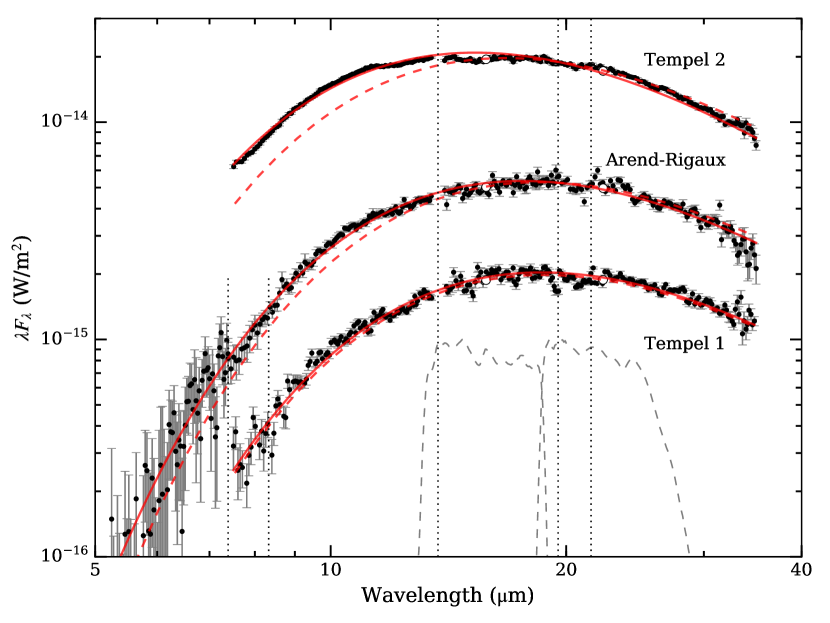
The spectra of Arend-Rigaux were combined in a similar manner as was done for the Tempel 2 data. The SL1 order (8.4–13.4 µm) was scaled by a factor of 1.20 to account for an apparent offset with the LL module. The SL2 and SL3 orders (5.2–8.3 µm) were scaled by a factor of 1.03 to match the newly scaled SL1 order. The final spectrum of comet Arend-Rigaux is presented in Fig. 3 and in the on-line supplementary material.
The spectra of the nucleus of comet Tempel 1 from Lisse et al. (2005) have lower signal-to-noise ratios than the Arend-Rigaux and Tempel 2 spectra. To compensate, we combined the four brightest epochs to produce the spectrum presented in Fig. 3. Spectral uncertainties were not provided by Lisse et al. (2005). We generated spectral uncertainties from the point-to-point scatter in the spectra after removing the gross spectral shape defined by Guassian smoothing.
3 Thermal Models
The near-Earth asteroid thermal model (NEATM; Harris 1998) has successfully reproduced comet nucleus effective radii (as determined through spacecraft encounters) based on thermal emission photometry from remote sensing. The NEATM assumes the surface of a spherical body is in instantaneous thermal equilibrium with insolation, placing the hottest spot at the sub-solar point, i.e., the surface has a thermal inertia of zero. In general, the NEATM is conceptionally appropriate as a modeling tool if the surface has a low thermal inertia ( a few hundred J K-1 m-2 s-1/2). The thermal properties of three spatially resolved comet surfaces have been studied and modeled. Temperature maps of the nucleus of comets Tempel 1 and 103P/Hartley 2 derived from the Deep Impact flyby spacecraft show that these nuclei have low to moderate thermal inertias (Groussin et al. 2007, Davidsson et al. 2013, Groussin et al. 2013). Davidsson et al. (2013) demonstrated that the flux from Tempel 1 terrains with the highest thermal inertia values (150–200 J K-1 m-2 s-1/2), deviate from 0 to 30% from an instantaneous model. Sub-millimeter observations of comet 67P/Churyumov-Gerasimenko with the Rosetta/MIRO instrument suggest the surface has a thermal inertia near 10–50 J K-1 m-2 s-1/2 (Gulkis et al. 2015). Thus, comet nuclei likely have low thermal inertia surfaces.
In terms of thermal inertia, the NEATM assumptions seem appropriate for comet nuclei. However, the shapes of our targets deviate significantly from the spherical assumption. Brown (1985) compare the thermal emission from ellipsoidal model asteroids to that from a spherical model. He shows that the ellipsoids have relatively stronger 20-µm emission than would otherwise be predicted, due to the presence of more facets with cooler thermal equilibrium temperatures. In the context of the NEATM, this would be accounted for by an increase in the beaming parameter (described below). Accounting for nucleus shape is beyond the scope of this paper. We primarily use the NEATM to establish an effective continuum spectrum for each target, which we will use to estimate an approximate emissivity spectrum. We report beaming parameters and effective radii in order to promote efficient comparison with other comet nucleus and asteroid observations (e.g., the infrared photometric survey of Fernández et al. 2013).
Within the NEATM formalism, the temperature, , of a sun-lit surface element of a sphere is
| (1) |
where is the bolometric Bond albedo (related to the geometric albedo, , through the relation , where is the phase integral; Hanner et al. 1981), is the incident solar flux (e.g., W m-2), is the Sun-zenith angle, is the infrared emissivity, is the Stefan-Boltzmann constant, and is a unitless scale factor referred to by the model as the “beaming parameter.” In practice, is a proxy for the combined effects of thermal inertia, bulk shape, and surface roughness (e.g., Lagerros 1998, Delbó and Harris 2002, Wolters et al. 2008). Surface roughness and shape cause “beaming” that can lower or raise the derived depending on the phase angle of the observation. Meanwhile, thermal inertia and rotation causes energy to propagate into the body and persist beyond the day/night terminator, raising the observed (Spencer et al. 1989, Spencer 1990). Based on a two-color (16 and 22 µm) photometric survey of 57 comet nuclei with Spitzer, Fernández et al. (2013) derive a JFC population averaged assuming and a geometric albedo . We also use and allow to freely vary when fitting spectra, but adopt the measured albedos for each nucleus: 0.022 for Tempel 2 (A’Hearn et al. 1989), 0.028 for Arend-Rigaux (Millis et al. 1988). The uncertainties in these albedos (0.005) are ignored in our fits. In order to convert from geometric albedo to Bond albedo, we set the phase parameter (of the , magnitude system; Bowell et al. 1989) to the nominal asteroidal value of 0.15. Thus, the geometric to Bond albedo conversion becomes (see Delbó and Harris 2002). The flux from the surface is integrated over the area visible to the observer to produce the model spectrum.
4 Results and Analysis
4.1 Imaging
We first examine the images of our targets to determine if they show any evidence of a dust coma, tail, or trail. All of the IRS and MIPS images of comets Tempel 2 and Arend-Rigaux show a strong point source, and the Tempel 2 images additionally show this comet’s dust trail. The MIPS image of comet Arend-Rigaux, taken 15 months prior to our spectra when the comet was closer to the Sun, has a prominent dust tail. This image was taken at a heliocentric distance of 1.64 au. No dust coma or tail is seen in any of our other images. Comet Arend-Rigaux’s activity seems to have been extinguished by the time it was observed with IRS at 3.56 au.
In Fig. 4, we plot the radial surface brightness profiles of all images of our target comets. We include the MIPS image of Arend-Rigaux to demonstrate how emission from a dust tail affects the radial profile and point source fitting. For comparison, we have included the spatial profile of asteroid 2004 BL11 (Campins et al. 2009) observed with the same IRS peak-up array as our comets (16-µm array in peak-up acquisition mode). For a comparison to the MIPS images, we have chosen asteroid (273) Atropos from the Spitzer archive (observed on 2008 Jan 20 at 1.02 au from the Sun). These asteroids are important references as they provide real world spatial profiles of bright solar system point sources. We reduced the asteroid data with the same procedures as used for the comet images and show their surface brightness profiles in Fig. 4.
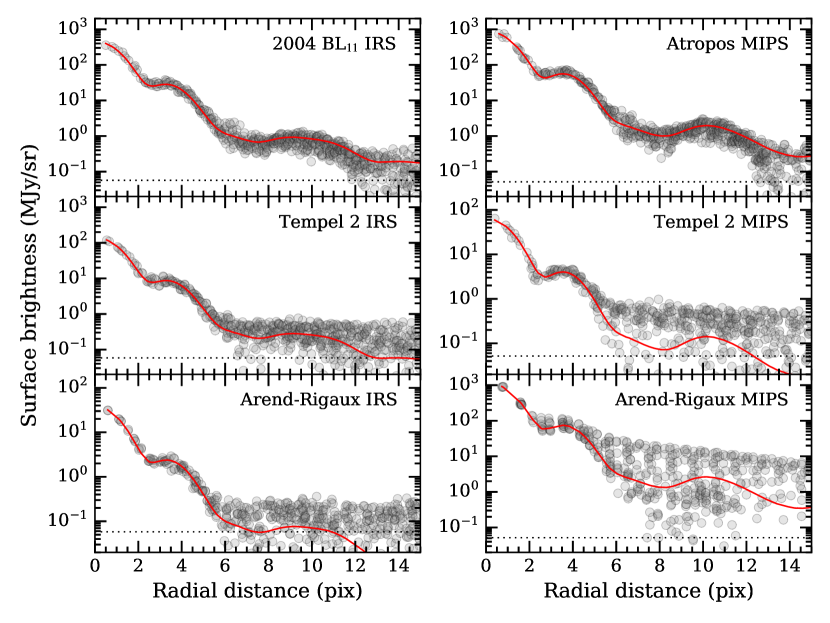
Comparing the spatial profiles to the point-response functions (PRFs) of the instruments may reveal the presence of a coma or tail. We use the term point-response function when we incorporate the effects of the detector and mosaicking process into a super-sampled image of the point-spread function (cf. Makovoz and Marleau 2005). Synthetic point-spread functions (PSFs) were generated using the Spitzer Science Center’s STinyTim software333Available at the NASA/IPAC Infrared Science Archive, http://irsa.ipac.caltech.edu/data/SPITZER/docs/dataanalysistools/ at a one-tenth pixel scale. The PSF changes significantly over the broad wavelength ranges of the IRS and MIPS filters. To ensure the PSFs are appropriate for our targets, they were generated with template spectra based on each target’s best-fit thermal model. The NEATM models for Tempel 2 and Arend-Rigaux are described in Section 4.2, the Atropos model is from Ryan and Woodward (2010), and the BL11 model from Campins et al. (2009).
The point-spread functions generated by STinyTim do not match the spatial profiles of our example asteroids BL11 and Atropos. This discrepancy exists because STinyTim does not account for any pixel-level instrument effects, or our image mosaicking procedures. Smoothing the IRS PSF with a boxcar kernel of width 1.9 pixels produced a PRF that matched the spatial profile of asteroid BL11. We similarly smoothed the PSFs for each of the IRS peak-up images.444This smoothing function (1.9-pixel-wide boxcar) may only be valid for peak-up acquisition mode observations, i.e., not for peak-up imaging mode. The STinyTim MIPS PSF required a smoothing of 1.7 pixels to best approximate the Atropos profile; however, smoothing with a 1.3 pixel kernel better matched the Tempel 2 profile. For consistency, we adopted 1.7 pixels for all MIPS observations. Engelbracht et al. (2007) used a similar sized filter (1.8 pixels) to match their MIPS 24-µm observations of calibration star HD 159330.
Each observation’s best-fit radial profile is included in Fig. 4, and the flux densities and effective radii given in Table 2. The IRS target flux densities have been color corrected by dividing by 0.98 (the pipeline is calibrated assuming a spectral energy distribution with proportional to 1). The magnitude of the color correction was computed using the best-fit NEATM models and the 16-µm-filter transmission profile. The photometry from the MIPS instrument, calibrated under different assumptions, do not require a color correction given our best-fit models. Flux uncertainties include a 2% absolute calibration uncertainty for IRS and 4% for MIPS.
The comet cores and first diffraction rings are well matched by the smoothed synthetic PRFs confirming that they are dominated by point sources, with the Arend-Rigaux MIPS observation as an exception. At this epoch, Arend-Rigaux has a wide distribution of fluxes above its model PRF due to the presence of the dust tail at this epoch (Fig. 2). The Tempel 2 IRS profile exhibits the same deviations, but to a lesser degree due to the increased contrast between the nucleus and that comet’s dust trail. Finally, both the Arend-Riguax and Tempel 2 IRS profiles have deviations from the PRF beyond 6 pixels due to the gradient in the image background. A gradient with the same morphology is seen in the red peak up arrays, which are offset from the target by about 1′, indicating it is not related to the comet. We conclude there is no evidence for a dust coma or tail in the Tempel 2 or Arend-Rigaux IRS data sets based on this analysis.
| IRS | MIPS or IRS Peak-Up | ||||||
|---|---|---|---|---|---|---|---|
| Target | |||||||
| (µm) | (mJy) | (mJy) | (km) | (km) | |||
| 9P/Tempel 1 | 0.831 | 0.005 | - | - | - | - | - |
| 10P/Tempel 2 | 0.813 | 0.002 | 15.8 | 99.5 | 2.0 | 4.48 | 0.05 |
| 23.7 | 92.9 | 3.8 | 4.35 | 0.09 | |||
| 49P/Arend-Rigaux | 0.743 | 0.005 | 15.8 | 27.4 | 0.7 | 4.57 | 0.06 |
| 23.7 | 1710b | 68 | 5.40b | 0.11 | |||
| (273) Atropos | 0.97a | 0.13 | 23.7 | 1296 | 52 | 14.8 | 0.3 |
| (276703) 2004 BL11 | 2.45a | 0.01 | 15.8 | 322 | 6 | 0.60 | 0.01 |
Table columns—, : NEATM IR beaming parameter based on spectra in this work (Tempel 1, Tempel 2, Arend-Rigaux), or based on the literature (Atropos, 2004 BL11); , : color-corrected best-fit flux density and uncertainty, from image photometry; , , NEATM effective radius and uncertainty.
a The mean IR emissivity is 0.90 for these objects, to be consistent with Campins et al. (2009) and Ryan and Woodward (2010).
b This observation is contaminated by dust.
4.2 Spectroscopy
Given that each comet’s spatial profile agrees with that of a point source, we fit the spectra of our targets with the NEATM, minimizing the statistic and allowing and the radius, , to vary as free parameters. The parameter uncertainties are based on the co-variance matrix returned by the least-squares routine (Bevington and Robinson 1992). Our best-fit model spectra are presented in Fig. 3 and the best-fit values are given in Table 2. These values are used to convert the IRS peak-up photometry into effective radii, as discussed in Section 4.1. Our value for Tempel 1, , is equivalent to that derived by Lisse et al. (2005), .
The Tempel 2 images have a prominent dust trail with a peak 24-µm surface brightness of 0.6 MJy sr-1 near the nucleus. We use the 24-µm image to estimate the contribution of the dust trail to our IRS spectrum. We define an aperture using the IRS LL1 slit width (10.7′′), our spectral extraction width (33′′ at 24 µm, Section 2.3), and orientation (long dimension 169∘ from the projected trail direction). With this aperture, we measure the trail flux on both sides of the nucleus and average them together. The trail signal is estimated to be % of the total spectral flux density at 24 µm in the IRS spectrum. We expect this fraction to increase with wavelength due to the wider spectral extraction aperture used at longer wavelengths (Section 2.3). The trail signal is 1% of the total flux density in the SL slit due to the narrower slit width and extraction apertures. Spherical trail dust, with radii near 0.1–1 mm, would have color temperatures near that of an isothermal sphere in local thermodynamic equilibrium. The spectrum of the trail would thus have a cooler color temperature than the nucleus, which primarily re-radiates absorbed energy through the daytime hemisphere. This spectral difference also increases the relative trail contribution at longer wavelengths. The stronger dust contribution to the longer wavelengths introduces a bias in the IR beaming parameter of Tempel 2 toward larger values. Comparing the Arend-Rigaux (dust free) and Tempel 2 (dust contaminated) beaming parameters suggests the bias is .
Normalizing the comet spectra with their respective best-fit NEATM models reveals significant spectral features (Fig. 5). Sivaraman et al. (2015) examined Arend-Rigaux’s 5–14 µm spectrum based on the same data set. They identified a curvature in the spectrum near 12–13 µm and suggested this was an absorption feature due to amorphous water ice on the surface. Rather than an absorption feature near 12–13 µm, our examination of Tempel 2 and Arend-Rigaux together led us to identify the presence of a plateau from 9 to 11 µm with a spectral contrast of about 10%. In addition, there is a minimum near 15 µm with a depth of about 5%, and local peaks near 19 and 23 µm. We interpret the 10-µm plateau and the 19- and 23-µm peaks as emission from silicate materials. The 15-µm feature remains unidentified and will be further discussed below.
4.3 Comparison to photometry of comet nuclei
Fernández et al. (2013) observed 57 comet nuclei at 16 and 22 µm with Spitzer’s IRS peak-up arrays. They fit their two-band photometry with the NEATM and derived a population averaged beaming parameter . In Section 3, we fit our nucleus spectra with the NEATM and found beaming parameters between 0.74 and 0.86 (Table 2), 1.5 to 2.6 lower than the population average from Fernández et al.. That all three spectroscopically-derived beaming parameters are lower than the photometrically-derived beaming parameters suggests there is some systematic difference in the two approaches. The best comparison would be through a comet-to-comet basis, but this is not possible as Tempel 1, Tempel 2, and Arend-Rigaux were not observed by Fernández et al.. However, the analytical approaches are essentially the same: thermal emission data are fit using the NEATM assuming an emissivity of 0.95 and a fixed geometric albedo, allowing radius and beaming parameter to vary. That Fernández et al. assumed a geometric albedo of 0.04 for all targets and that we used the known albedos of Tempel 1 and Tempel 2 is not significant; the difference in thermal emission from a surface with =0.02 and one with =0.04 is negligible.
To investigate the apparent discrepancy between the photometrically-derived and spectroscopically-derived beaming parameters, we generated 16- and 22-µm synthetic photometry based on the IRS spectra of Tempel 1, Tempel 2, and Arend-Rigaux using the IRS filter transmission profiles. We then fitted a beaming parameter and radius to the photometry. To make fits that are equivalent to the Fernández et al. nucleus survey, we assumed a fixed geometric albedo of 0.04 and a 3% photometric uncertainty. We derived , , and for Tempel 1, Tempel 2, and Arend-Rigaux, respectively. Although the uncertainties are quite broad due to our artificial 3% uncertainty factor, the photometrically retrieved values for Tempel 2 and Arend-Rigaux are higher than were obtained from the full spectra; the Tempel 1 value is essentially unchanged. The photometry and models are presented in Fig. 3.
Beaming parameters derived from either method may be affected by wavelength range and emissivity features. To explore these effects, we performed additional tests with the NEATM and fit: (1) the short-wavelength orders only ( µm); and (2) the long-wavelength orders only. All derived -values are presented in Table 3. There are two consistent trends among all the fits: the beaming parameters based on the shortest wavelengths are smaller than those that include longer wavelength data, and the fits that are only based on longer wavelengths have the highest values. As one may expect, the most representative beaming parameters for NEATM modeling should be based on a wide range of wavelengths. This is a partial explanation for the systematically higher beaming parameters derived from the synthetic 16- and 22-µm photometry.
| Target | µm | All | µm | 16 & 22 µm | ||||
|---|---|---|---|---|---|---|---|---|
| Tempel 2 | 0.785 | 0.003 | 0.813 | 0.002 | 1.09 | 0.01 | 1.17 | 0.19 |
| Arend-Rigaux | 0.69 | 0.01 | 0.742 | 0.005 | 0.85 | 0.02 | 0.97 | 0.13 |
| Tempel 1 | 0.72 | 0.02 | 0.860 | 0.005 | 0.96 | 0.01 | 0.88 | 0.12 |
Aside from wavelength range, emissivity features provide an additional systematic offset. As shown in Figs. 5 and 6, the 22-µm region can have a significantly higher relative emissivity than the 16-µm region, due to the presence of silicate materials. We find that increasing the 16-µm flux density by 1 (here, 3%) decreases by 1 (here, 0.15), at least for our two-band photometry fits. If the spectra in Fig. 5 are representative of the comet population, then a 3% bias can easily be present in the Fernández et al. (2013) photometry. Lowering the Fernández et al. population mean beaming parameter by 1 from 1.03 to 0.92, results in a better agreement (2) with each of our spectroscopically derived values. Thus, we suggest emissivity features due to silicates are common in the comet population, and that the beaming parameters of Fernández et al. (2013) are slightly biased by these features at the 1 level. If true, then the effective radius estimates by Fernández et al. are higher than would otherwise be retrieved. However, such an effect appears to be subtle, given the statistical agreement between the Fernández et al. survey and previous reflected light surveys of comet nuclei.
In contrast to this discussion, analysis of the nucleus of comet Schwassmann-Wachmann 1 by Schambeau et al. (2015), using photometry spanning a broad wavelength range (5 to 70 µm), results in a beaming parameter of 0.99. The best-fit range is large, but it is centered near 1.0 and biased towards larger values. Moreover, 12- and 22-µm photometry of 22 nuclei with the WISE spacecraft suggests =1.0 to 1.2 (Bauer et al. 2015). As an alternative explanation for the discrepancy between our results and those of Fernández et al., Bauer et al., and Schambeau et al., the spectroscopy may be in error. In Section 2.3, we corrected apparent module-to-module offsets in our Tempel 2 and Arend-Rigaux spectra. The corrections were derived by linear interpolation across the 14-µm teardrop artifact present in the IRS spectra. It is possible that the linear approximation is a poor one, and that the resulting scale factors are in error, which would have consequence on the best-fit NEATM models. Fitting the unscaled Tempel 2 and Arend-Rigaux spectra does indeed raise the beaming parameters to near 0.9. We do not have a solution for this aspect, but we surmise that spectral scaling is a better approach given potential uncertainties in the IRS pointing (Section 2.3). Future dedicated spectroscopic observations of these or other bare nuclei in the 5 to 30 µm range with missions such as the James Webb Space Telescope should be carefully obtained, and with supporting photometry if order-to-order corrections might be needed.
4.4 Comparison to spectra of Jovian Trojan D-types, and other asteroids
Comet nuclei tend to have D-type classifications based on their reflectance spectra (Section 1). We find that this similarity can be extended to their thermal emission spectra. Figure 6 shows our spectrum of Tempel 2 along with the spectra of Jovian Trojan D-types (624) Hektor, (911) Agamemnon, and (1172) Aneas from Emery et al. (2006). The 9- to 11-µm plateau is slightly stronger in the Trojans. Asteroid Hektor’s feature has a trapezoidal shape like Tempel 2, but the Agamemnon and possibly the Aneas features are slightly rounded. All four objects have the two emissivity peaks near 19 and 23 µm. The 15-µm feature of Tempel 2 is the strongest, followed by those of Hektor and Agamemnon. Asteroid Aneas’s 15-µm feature is weak, if present at all. We summarize the parameters of the emissivity features of our three comets and the three Trojan D-types in Table 4.
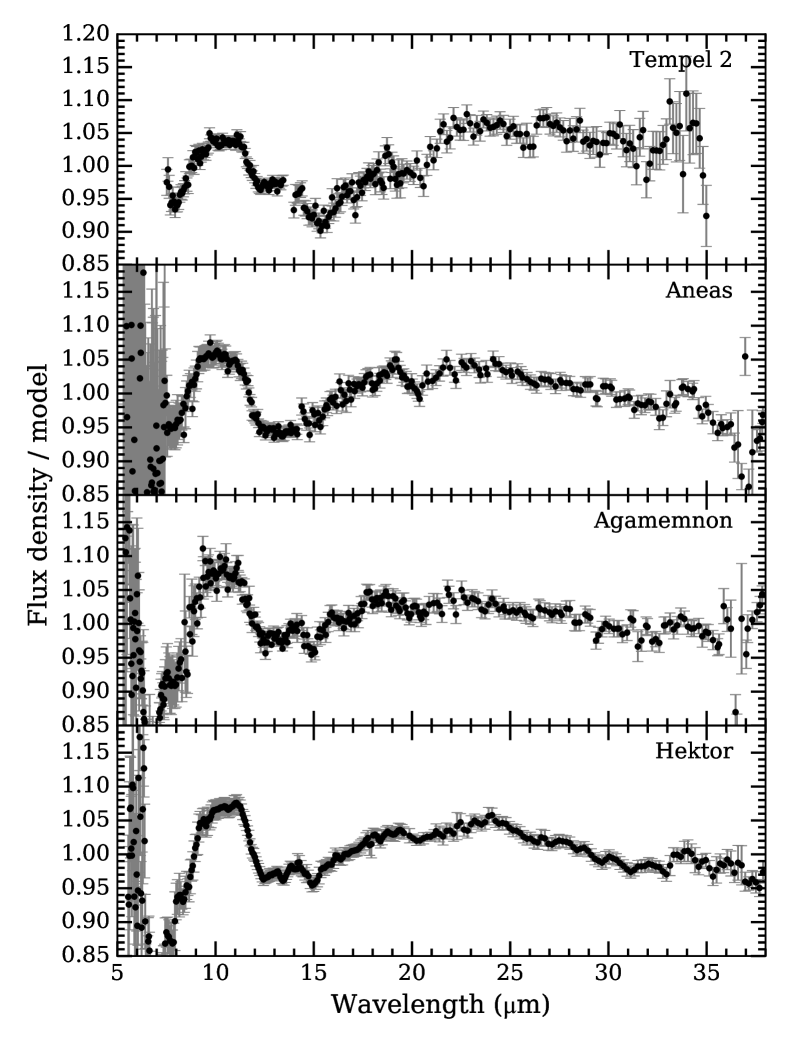
Asteroid Hektor and comet Tempel 2 have the most similar spectra. The dust grains in comet nuclei are primarily composed of silicates of mixed Mg and Fe content, Mg-rich silicates, carbonaceous dust, and metal sulfides (Wooden 2002, Hanner and Zolensky 2010, Frank et al. 2014). The spectral similarity between Hektor and Tempel 2 suggests that at least some Jovian Trojan D-types have surface compositions and structures similar to comet nuclei.
Target 9–11 µm 15-µm 20-µm 26-µm 28-µm 34-µm plateau minimum minimum minimum maximum maximuma Tempel 2 trapezoidal present present strong none ? Arend-Rigaux present present present ? ? none Tempel 1 present ? ? ? ? ? Hektor trapezoidal present present none subtle present Agamemnon rounded present present none none ? Aneas rounded none present none none present
aThe apparent presence of the 34 µm peak, being at the edge of the wavelength range, is strongly affected by the thermal model in our comet spectra.
Spectral features exist in mid-infrared spectra of many asteroids. We examined the Spitzer IRS spectra of: E-type asteroid (2867) Šteins (Barucci et al. 2008, Groussin et al. 2011); M-type asteroid (21) Lutetia (Barucci et al. 2008); the 28 C-, X-, V-, and S-type spectra of Marchis et al. (2012); the X-type asteroid (617) Patroclus (Mueller et al. 2010); the T-type (308) Polyxo (Dotto et al. 2004); and the V-type (956) Elisa (Lim et al. 2011) to compare with our comet nuclei spectra. Of these asteroids, the C- and X-type spectra presented by Marchis et al. (2012) are most similar to Tempel 2, with broad maxima centered at 10 µm and 16–17 µm. However, these peaks tend to be more rounded in the asteroid spectra. Mueller et al. (2010) already noted similarities between X-type Patroclus and D-type Hektor, the former asteroid having weaker features. Except for the Jovian Trojans Hektor, Agamemnon, and Patroclus (Emery et al. 2006, Mueller et al. 2010), none of the above investigations showed any 15-µm feature similar to that seen in the spectra of Tempel 2 and Arend-Rigaux.
4.5 Comparison to spectra of comet comae
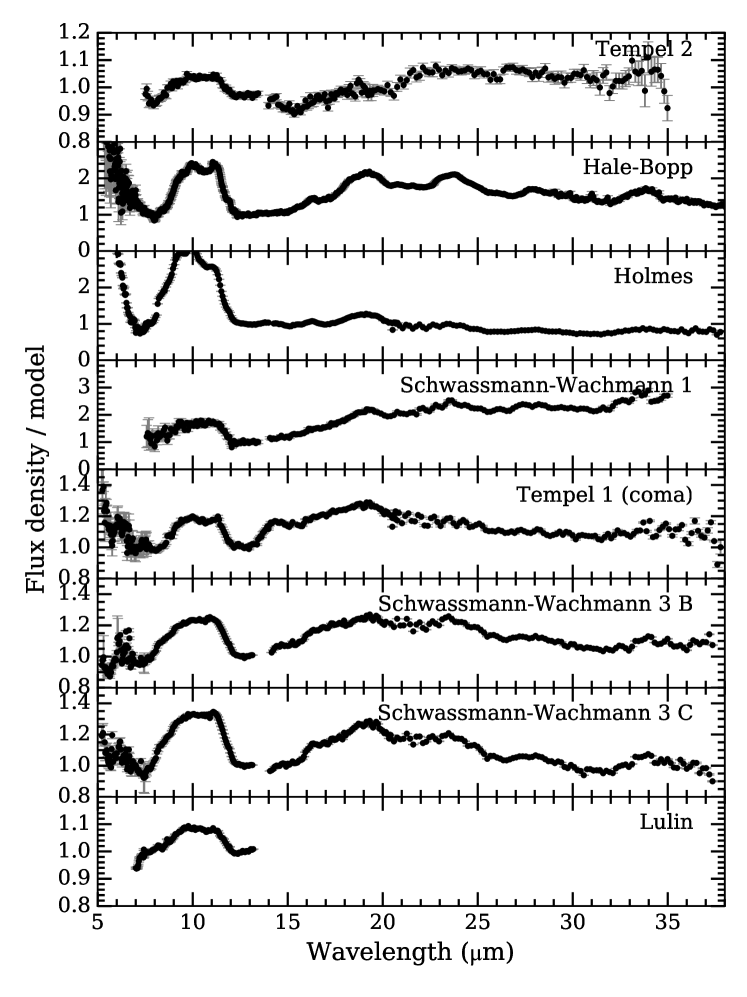
Emery et al. (2006) noted striking similarities between their D-type Jovian Trojan spectra and the spectra of the comae of comets Hale-Bopp and Schwassmann-Wachmann 1 (Crovisier et al. 1997, Stansberry et al. 2004), and hypothesized that the surfaces of the D-types are comprised of fine-grained silicate material embedded in a transparent or high porosity surface. To better understand this similarity, we compare the spectrum of the surface of Tempel 2 to the spectra of comet comae.
In addition to Hale-Bopp and Schwassmann-Wachmann 1, we selected comets from the literature that were observed with Spitzer/IRS at high signal-to-noise ratios: Tempel 1 (pre-Deep Impact experiment, nucleus removed; Lisse et al. 2006, Kelley and Wooden 2009), 17P/Holmes (post-mega-outburst; Reach et al. 2010), 73P/Schwassmann-Wachmann 3 fragments B and C (Sitko et al. 2011), and Oort cloud comet C/2007 N3 (Lulin) (Woodward et al. 2011). The Schwassmann-Wachmann 1 spectrum is based on our own processing and spectral extraction, following the methods of Kelley et al. (2006). This includes the removal of a model nucleus, based on the nucleus parameters of Schambeau et al. (2015). The properties of the spectra of the comet comae are summarized in Table 5.
4.5.1 Apparent continuum temperature
Each coma spectrum is fitted with a scaled Planck function, a common practice in comet infrared spectral analysis (e.g., Bregman et al. 1987, Hanner et al. 1994, Sitko et al. 2004). We used the 7.5–8.0 and 12.5–13.0-µm regions to establish the local 10-µm pseudo-continuum. We also fitted and include in Table 6 the spectra of the comet and asteroid surfaces to facilitate a one-to-one comparison. The best-fit temperatures are given in Table 6 and each comet’s spectrum is normalized by the best-fit Planck function and plotted in Fig. 7. Column 4 in Table 6 lists the color-temperature excess , i.e., the best-fit color temperature, , divided by the temperature of a blackbody sphere in local thermodynamic equilibrium with insolation , where is in au (Gehrz and Ney 1992). We have ignored the best-fit temperature for comet Schwassmann-Wachmann 1 as it does not agree with the longer wavelengths ( µm). The 10-µm spectrum is strongly dominated by the nucleus (Stansberry et al. 2004, Schambeau et al. 2015), and its high apparent temperature is likely due to uncertainties in the nucleus subtraction.
There is a clear dichotomy in our target sample: the spectra of the asteroid and comet nucleus surfaces have values of 1.35–1.41, yet the comae are cooler at 1.12–1.29. This grouping is expected. Slowly-rotating surfaces with low thermal inertia re-radiate most of their absorbed sunlight on the daytime hemisphere nominally raising the color temperature by a factor of (1.19), whereas the dust grains in comet comae, with numerous radii less than 100 µm in size, are more isothermal and can re-radiate in all directions. The similarity in the normalized temperatures between Tempel 2, Arend-Rigaux, and Hektor gives further evidence that these spectra are dominated by nucleus emission, rather than a spatially unresolved coma. A high color-temperature for comet Arend-Rigaux was already measured by Tokunaga and Hanner (1985), and they also concluded they observed nucleus-dominated photometry.
Target Class Instrument Note (au) 9P/Tempel 1 JF Spitzer/IRS 1.5 Pre-Deep Impact excavation, model nucleus removed. 17P/Holmes JF Spitzer/IRS 2.5 Post-mega-outburst. 29P/Schwassmann-Wachmann 1 Centaur Spitzer/IRS 5.7 Model nucleus removed. 73P/Schwassmann-Wachmann 3-B JF Spitzer/IRS 1.5 16 days post-outburst. 73P/Schwassmann-Wachmann 3-C JF Spitzer/IRS 1.5 C/1995 O1 (Hale-Bopp) OC ISO/SWS 2.8 C/2007 N3 (Lulin) OC Spitzer/IRS 1.9
Table columns—Class: dynamical classification (JF) Jupiter-family comet centaur, or (OC) Oort cloud comet; : heliocentric distance.
a See text for data sources.
4.5.2 Emissivity features
The 10-µm region has the strongest feature observed at the best signal-to-noise ratio. Figure 8 presents the 7–13 µm spectra of the surface of comet Tempel 2, asteroids Hektor and Aneas, and the comae of our comparison comets. All spectra have been normalized by the Planck function fit in Section 4.5.1, then offset and scaled to span the range 0 to 1.0. The comae of comets Holmes, and Hale-Bopp, and to a lesser extent Tempel 1, have pronounced emission from Mg-rich silicates at 10.0 and 11.2 µm. There is a peak near 9.8 µm in the Tempel 2 spectrum, but no 11.2 µm peak. On broader wavelength scales, the 10-µm plateaus appear to fall into two groups: (1) trapezoidal and similar to the feature in the spectrum of the surface of Tempel 2 (Hektor, Aneas, comets Tempel 1, Holmes, and Hale-Bopp), or (2) the same but with a short-wavelength shoulder that is more rounded due to enhanced emission at 8 to 8.5 µm (Schwassmann-Wachmann 1, Schwassmann-Wachmann 3-B, 3-C, and Lulin).
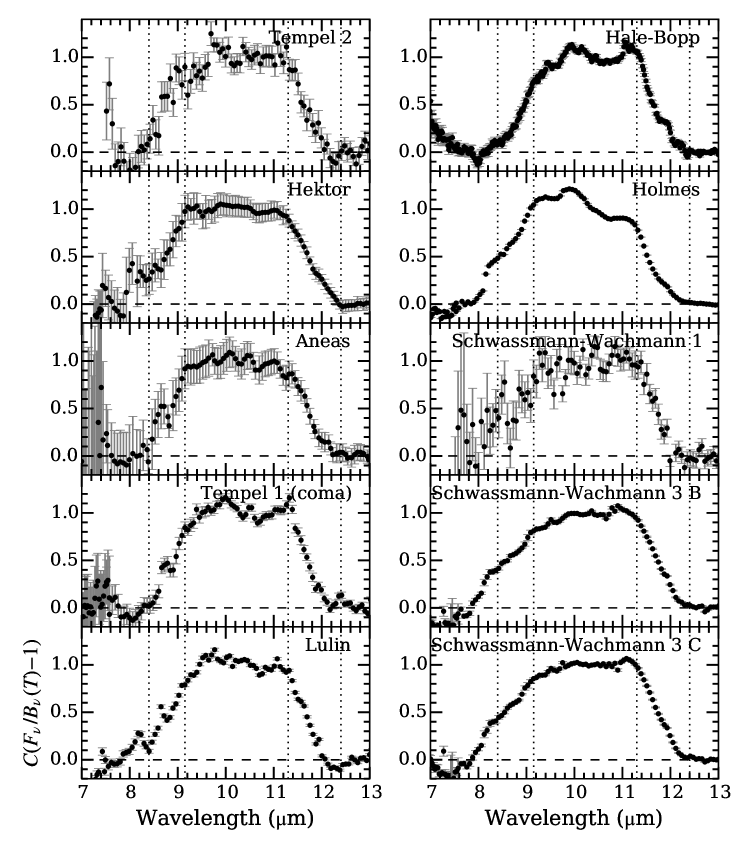
We examined the mineral decompositions of the spectra of comets Holmes, Hale-Bopp, Schwassmann-Wachmann 1, Schwassmann-Wachmann 3, and Lulin (Harker et al. 2002, Reach et al. 2010, Sitko et al. 2011, Woodward et al. 2011, Schambeau et al. 2015) but found no clear trend that would explain the differences. The analysis of the 7–13-µm spectra of comet Hale-Bopp by Wooden et al. (1999) indicates the shape of the short-wavelength shoulder is controlled by the relative amounts of amorphous and crystalline pyroxene (see their Figs. 5, 6, and 7), but in other comets the coma grain size distribution must also play a role.
In Table 6 we summarize the 10-µm feature of each target with the wavelength of onset (the short-wavelength edge of the whole feature), crest (the short-wavelength edge of the plateau), cliff (the long-wavelength edge of the plateau), and terminus (the long-wavelength edge of the whole feature). The positions were identified by visual inspection. Each spectrum’s crest, cliff, and terminus occurs within 0.1 µm of those of the other targets. As already suggested in Section 4.5, such differences may be the result of composition, or grain size and packing variations, the latter of which can change the origin of photons with wavelengths near the transition between surface and volume scattering domains (Hunt and Vincent 1968, Salisbury and Wald 1992). The largest variation occurs at the onset, ranging from 7.8 (Schwassmann-Wachmann 3 B and C) to 8.4 µm (Aneas). The surfaces, however, all have similar onsets at 8.2 to 8.4 µm. The best match for Tempel 2 is Aneas and the coma of Tempel 1.
Finally for the 10-µm region, we identify a subtle narrow peak at 12.4 to 12.5 µm in the Tempel 2 surface and the Tempel 1 coma spectra. A similar feature was seen in Gemini/Michelle spectra of material excavated from Tempel 1, but remains unidentified (Harker et al. 2007).
Target Type Onset Crest Cliff Terminus (K) (K) (µm) (µm) (µm) (µm) Arend-Rigaux nucleus 208.4 2.2 1.41 - - (11.3) (12.2) Tempel 2 nucleus 241.8 0.4 1.39 (8.2) (9.0) 11.3 12.2 Agamemnon asteroid 162.6 0.4 1.38 Aneas asteroid 161.1 0.3 1.39 8.4 9.2 11.4 12.2 Hektor asteroid 164.3 0.3 1.35 (8.4) 9.2 11.3 12.4 Hale-Bopp coma 214.5 0.5 1.29 8.2 9.2 11.2 12.3 Holmes coma 204.0 0.0 1.16 8.0 9.2 11.2 12.2 Lulin coma 226.7 0.1 1.12 8.0 (9.6) 11.3 12.2 Schwassmann-Wachmann 1 coma 198.0b 4.3 1.70b (8.0) (9.3) 11.4 12.2 Schwassmann-Wachmann 3 B coma 301.9 0.2 1.18 7.8 9.1 11.2 12.2 Schwassmann-Wachmann 3 C coma 268.0 0.2 1.17 7.8 9.1 11.2 12.2 Tempel 1 coma 273.5 0.7 1.39 8.2 9.2 11.3 12.2
Table columns — , : best-fit color temperature and uncertainty; : color-temperature excess, the ratio of the color temperature to the temperature of an isothermal spherical blackbody at the same heliocentric distance; Onset: the short-wavelength edge of the silicate feature; Crest: the short-wavelength edge of the plateau; Cliff: the long-wavelength edge of the plateau; Terminus: the long-wavelength edge of the silicate feature.
a Values in parentheses are estimates that are affected by low data quality or unclear spectral structure.
b Although this is the best-fit temperature for this comet, we do not consider it to be robust, as evidenced by its poor accounting for the longer wavelength emission in Fig. 7.
At longer wavelengths, the emission features from Mg-rich silicate grains at 16, 19, 23, 28, and 34 µm are stronger in the comae spectra than in the surface spectra. For example, the 19 µm peak has relative strengths of 10–25% in most of the comae, but only 5% at Tempel 2. In general, this may indicate a grain size difference—the relative strengths of crystalline silicate resonances vary with grain size (Lindsay et al. 2013)—or an abundance difference. The Tempel 2 features are not well aligned with the coma features, e.g., we estimate the Tempel 2 emissivity peaks are near 16.5, 18.9, 21.7–23.0, and 26.5 µm, whereas the corresponding Hale-Bopp peaks are near 16.2, 19.1, 23.7, and 27.8 µm. Such shifts may be the effect of grain-grain contact on the surface of the object, causing light scattering between grains.
4.6 The 15-µm feature
A 15 µm emissivity minimum is shown in detail in Fig. 9. We estimate the approximate wavelength position of the feature by fitting a Gaussian function plus a linear continuum to each 14–17-µm spectrum. The best-fit parameters and equivalent widths are presented in Table 7. The locations of Arend-Rigaux and Tempel 2 minima are consistent with each other.
| Target | ||||||
|---|---|---|---|---|---|---|
| (µm) | (µm) | (µm) | (µm) | |||
| Tempel 2 | -0.105 | 0.057 | 15.31 | 0.12 | -0.101 | 0.004 |
| Arend-Rigaux | -0.049 | 0.043 | 15.64 | 0.24 | -0.046 | 0.011 |
| Hektor, S12b | -0.024 | 0.006 | 15.03 | 0.07 | -0.023 | 0.003 |
| Hektor, S18b | -0.019 | 0.005 | 15.22 | 0.06 | -0.018 | 0.002 |
a Column headings: Gaussian function amplitude and uncertainty (, ), central wavelength and uncertainty (, ), and feature equivalent width and uncertainty (, ).
b The “Hektor, S12” spectrum (Emery et al. 2006) was processed with version S12 of the IRS reduction pipeline. The “Hektor, S18” spectrum (this work) was processed with version S18.
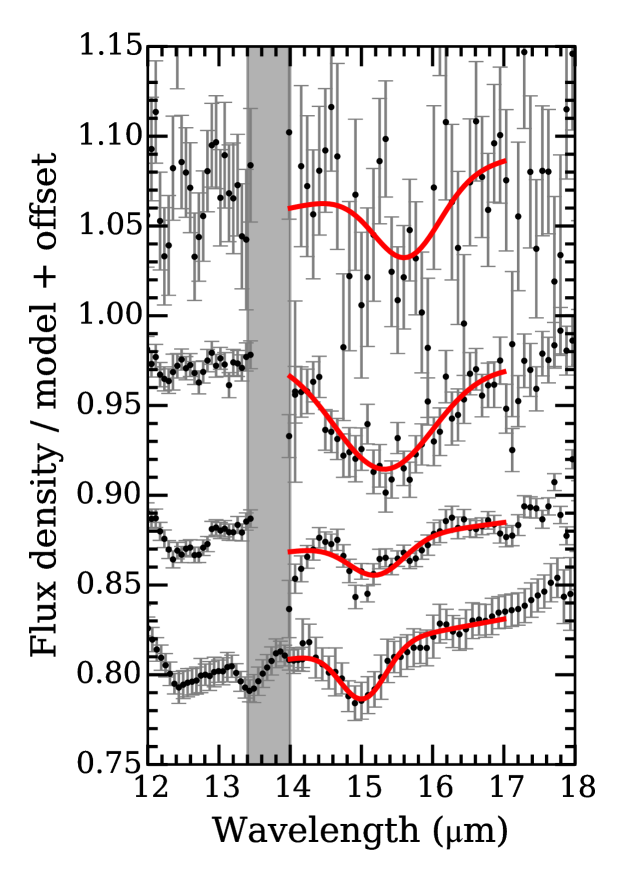
There have been several updates to the IRS data reduction pipeline since the study of Trojan asteroids by Emery et al. (2006), which used version S12.0. To investigate whether the spectrum of the 15-µm feature in Hektor is affected by the improved calibrations, we downloaded the Hektor observations processed with the latest IRS pipeline (S18.18, the same as Tempel 2 and Arend-Rigaux) from the Spitzer archive. The spectra were reduced as outlined in Section 2. The 15-µm feature was still present, although the shape and central wavelength changed from to . The position of the feature in the updated spectrum is consistent with the minimum in the spectrum of Tempel 2. The apparent feature at 13.4 µm in the original Emery et al. (2006) spectrum (bottom of Fig. 9) is likely the IRS teardrop artifact (Section 2.3).
Some Spitzer/IRS observations of young stellar objects show CO2-ice absorption near 15 µm (e.g., Bergin et al. 2005, Quanz et al. 2007). The CO2-ice feature has a minimum at 15.2 µm, consistent with the spectra of both Hektor and Tempel 2. However, the surfaces of our objects are too warm for CO2 ice to be present in any significant abundance. CO2 readily sublimates at , and to see this feature in absorption it must be obscuring a source of warm continuum. CO2 could be replenished from a comet’s interior, but this does not account for the presence of CO2 ice on the Trojan asteroids. If the volatile CO2 is present, then the less volatile water ice should also be present. Initial studies by Emery and Brown (2003) and Yang and Jewitt (2007) found little evidence for water ice on their surfaces. More recently, Brown (2016) has demonstrated that the less red Trojan asteroids have a wide 3-µm absorption feature in their reflectance spectra, but he argues that water ice is unlikely in such a substantial fraction of the population and suggests this feature is due to N–H bonds rather than water ice. Finally, surface CO2 ice, whether at 5 au or closer to the Sun, should induce cometary activity, but this has not been reported for any Jovian Trojan asteroid.
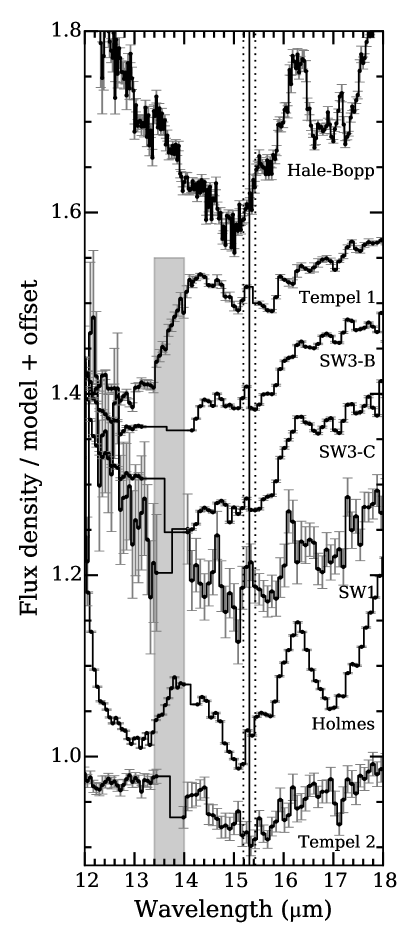
A 15-µm feature has not been previously described in any spectrum of a cometary coma. To investigate, we present spectra of the above comet comae in Fig. 10. The spectrum of the nucleus of Tempel 2 was normalized by its NEATM model, and the comet comae spectra were normalized by a Planck function simultaneously fit to the wavelength regions 8, 12.5–16, and 21–23 µm. Except for Tempel 2, there are no clear 15-µm minima, with the caveat that the broad 16.2-µm emission from Mg-rich olivine in several comets may be obscuring their respective 15-µm features. Comet Tempel 1 has the only spectrum with a possible broad 15.3-µm minimum, although this interpretation is not straightforward due to a narrow local maximum at the same location.
5 Summary
We presented spectra and images of comets 10P/Tempel 2 and 49P/Arend-Rigaux, observed with the Spitzer/IRS instrument. The spectra of these comets have high 10-µm color-temperature excesses, higher than those seen for comet comae, but similar to those of asteroid surfaces. The contemporaneously obtained mid-infrared images of these comets have radial surface brightness profiles that agree with those expected from point sources. Their measured mid-infrared flux densities are commensurate with object radii similar to those already published in the literature using other techniques. We conclude that the IRS spectra of these two comets represent the thermal emission of bare nuclei, i.e., free from coma contamination. We estimated, however, that the spectrum of comet Tempel 2 does has a small (5%) contribution from the comet’s dust trail at the longest wavelengths in our spectrum.r
Including previous spectra of the nucleus of comet 9P/Tempel 1 (Lisse et al. 2005), we fit each spectrum with a near-Earth asteroid thermal model (NEATM) to derive their effective surface beaming parameters. We found a systematic discrepancy between our spectroscopically-derived IR beaming parameters and those derived for the JFC population by Fernández et al. (2013) based on 16- and 22-µm photometry. The spectroscopically-derived beaming parameters are near 0.8, meanwhile the Fernández et al. (2013) study found a population mean of 1.030.11. We suggest this may be due to the limited wavelength range of the two-band photometry, and the presence of emissivity features throughout the 7–30 µm range. The Fernández et al. (2013) derived radii are consistent with optical surveys of comet nuclei, so any bias caused by the potentially high beaming parameter is statistically unimportant to the nucleus sizes. However, we necessarily applied scale factors to our spectra to correct for apparent IRS module-to-module offsets. This approach, based on a linear interpolation over a known instrument artifact, may also be in error. New observations of bare nuclei by the MIRI instrument on the James Webb Space Telescope (Rieke et al. 2015) should help us understand this discrepancy.
By normalizing our spectra with a best-fit thermal model, we find emissivity features in which we identify a 9–11 µm trapezoidal plateau, and weaker peaks near 18–19, 22–24, and 34 µm. These are the signatures of silicates, including Mg-rich olivine. That all three comets inspected, Tempel 1, Tempel 2, and Arend-Rigaux, exhibit a 10-µm plateau indicates that its presence is not correlated with the unusually low activities of the larger nuclei (Tempel 2 and Arend-Rigaux). This interpretation is in contrast to that of Sivaraman et al. (2015), who conclude a broad depression near 13 µm in the 5–14-µm spectrum of Arend-Rigaux indicates the presence of amorphous water ice.
There are strong similarities between the emissivity spectra of our comet nuclei and those of D-type asteroids. Emery et al. (2006) has already compared three D-type Jovian Trojan asteroids to comet comae and found the same similarities. That asteroid surfaces and dust in comet comae present the same features in emission is not completely expected, even if they have the same composition. Emery et al. (2006) consider this point in detail, and conclude that the Trojan surfaces are either highly porous, or have fine-grained silicate species that are suspended in a mid-infrared-transparent matrix. Vernazza et al. (2012) adds that the low surface thermal inertia and red reflectance spectra of these asteroids provides additional evidence for highly porous surfaces. We note that the bulk densities of comets are also low suggesting porosities near 80% (Richardson et al. 2007, Ernst and Schultz 2007, Thomas et al. 2013a, b, Sierks et al. 2015), and the mid-infrared similarities between the Trojan and comet surfaces further emphasize that high porosity is an important characteristic.
We compared Spitzer and ISO spectra of comet comae to those of our comet surfaces. We find that the 10-µm silicate features of comet comae can be described as either having a trapezoidal shape, or having a more rounded or triangular shape. The latter is apparently due to enhanced emission near 8 to 8.5 µm. There has been evidence for a variety of shapes in previous ground-based coma spectroscopy (cf. Hanner et al. 1994 and Sitko et al. 2004), but none seem to have the more rounded shapes of Schwassmann-Wachmann 1 or Schwassmann-Wachmann 3. We will examine this aspect of comet comae further in a future paper. The 10-µm silicate features of our comet surfaces and those of Jovian Trojans Hektor and Aneas better match the comae with more trapezoidal-shaped silicate bands.
An emissivity minimum near 15.2 µm (2–5% depth) is seen in the spectra of Arend-Rigaux and Tempel 2. The feature is also found in the spectra of Jovian Trojans Hektor, Agamemnon (D-type), and Patroclus (X-type), but we did not find it in the spectra of other asteroids or comet comae. We also find a subtle narrow peak at 12.4–12.5 µm in the comet Tempel 2 surface spectrum, and in the Tempel 1 coma spectrum. Both of these features (at and 15 µm) remain unidentified.
Based on the comparisons between mid-infrared spectra of the comet surfaces and those of asteroids in the literature, the compositional similarity between comets and Jovian Trojans is strengthened. Thus, these two classes of objects possibly have similar origins in the early Solar System. However, comet comae show a wider diversity in the 10-µm features than do our the set of comet and Trojan D-type surfaces presented here. The anticipated James Webb Space Telescope mission should be capable of addressing this latter point with spectra of more asteroids and bare comet nuclei.
Acknowledgments
The authors thank the three referees for comments that improved this paper, J. P. Emery for sharing the Jovian Trojan spectra from Emery et al. (2006), and C. M. Lisse for sharing the Spitzer spectra of comet Tempel 1 from Lisse et al. (2005).
M.S.P.K. and D.E.H. were supported for this work by the NASA (USA) Planetary Astronomy Program award NNX13AH67G. C.E.W. was supported by Emerging Worlds Program award NNX16ADD33G.
This work is based in part on observations made with the Spitzer Space Telescope, which is operated by the Jet Propulsion Laboratory, California Institute of Technology under a contract with NASA (USA). R.D.G., C.E.W., and M.S.P.K. were supported for these observations by NASA (USA) through Contract Nos. 1256406 and 1215746 issued by JPL/Caltech to the University of Minnesota.
This research made use of Astropy, a community-developed core Python package for Astronomy (Astropy Collaboration et al. 2013). This research also made use of Tiny Tim/Spitzer (STinyTim), developed by John Krist for the Spitzer Science Center. The Center is managed by the California Institute of Technology under a contract with NASA (USA).
References
- A’Hearn et al. (2005) A’Hearn, M. F., et al., 2005. Deep Impact: Excavating Comet Tempel 1. Science 310, 258–264.
- A’Hearn et al. (1989) A’Hearn, M. F., Campins, H., Schleicher, D. G., Millis, R. L., 1989. The nucleus of Comet P/Tempel 2. Astrophys. J. 347, 1155–1166.
- Astropy Collaboration et al. (2013) Astropy Collaboration, et al., 2013. Astropy: A community Python package for astronomy. Astron. Astrophys. 558, A33.
- Barucci et al. (2008) Barucci, M. A., et al., 2008. Asteroids 2867 Steins and 21 Lutetia: surface composition from far infrared observations with the Spitzer space telescope. Astron. Astrophys. 477, 665–670.
- Bauer et al. (2015) Bauer, J. M., et al., 2015. The NEOWISE-Discovered Comet Population and the CO + CO2 Production Rates. Astrophys. J. 814, 85.
- Bergin et al. (2005) Bergin, E. A., Melnick, G. J., Gerakines, P. A., Neufeld, D. A., Whittet, D. C. B., 2005. Spitzer Observations of CO2 Ice toward Field Stars in the Taurus Molecular Cloud. Astrophys. J., Lett. 627, L33–L36.
- Bevington and Robinson (1992) Bevington, P. R., Robinson, D. K., 1992. Data reduction and error analysis for the physical sciences, 2nd Edition. McGraw-Hill, New York.
- Bowell et al. (1989) Bowell, E., Hapke, B., Domingue, D., Lumme, K., Peltoniemi, J., Harris, A. W., 1989. Application of photometric models to asteroids. In: Binzel, R. P., Gehrels, T., Matthews, M. S. (Eds.), Asteroids II. Univ. Arizona Press, Tucson, AZ, pp. 524–556.
- Bregman et al. (1987) Bregman, J. D., et al., 1987. Airborne and groundbased spectrophotometry of comet P/Halley from 5-13 micrometers. Astron. Astrophys. 187, 616–620.
- Brooke and Knacke (1986) Brooke, T. Y., Knacke, R. F., 1986. The nucleus of Comet P/Arend-Rigaux. Icarus 67, 80–87.
- Brown (2016) Brown, M. E., 2016. The 3-4 m Spectra of Jupiter Trojan Asteroids. Astron. J. in press.
- Brown (1985) Brown, R. H., 1985. Ellipsoidal geometry in asteroid thermal models - The standard radiometric model. Icarus 64, 53–63.
- Bus and Binzel (2002) Bus, S. J., Binzel, R. P., 2002. Phase II of the Small Main-Belt Asteroid Spectroscopic Survey A Feature-Based Taxonomy. Icarus 158, 146–177.
- Campins et al. (2009) Campins, H., Kelley, M. S., Fernández, Y., Licandro, J., Hargrove, K., 2009. Low Perihelion Near-Earth Asteroids. Earth, Moon, Planets 105, 159–165.
- Campins et al. (2007) Campins, H., et al., 2007. Nuclear Spectra of Comet 28P Neujmin 1. Astron. J. 134, 1626–1633.
- Campins et al. (2006) Campins, H., et al., 2006. Nuclear Spectra of Comet 162P/Siding Spring (2004 TU12). Astron. J. 132, 1346–1353.
- Crovisier et al. (1997) Crovisier, J., et al., 1997. The spectrum of Comet Hale-Bopp (C/1995 01) observed with the Infrared Space Observatory at 2.9 AU from the Sun. Science 275, 1904–1907.
- Davidsson et al. (2013) Davidsson, B. J. R., et al., 2013. Thermal inertia and surface roughness of Comet 9P/Tempel 1. Icarus 224, 154–171.
- Delbó and Harris (2002) Delbó, M., Harris, A. W., 2002. Physical properties of near-Earth asteroids from thermal infrared observations and thermal modeling. Meteoritics Planet. Sci. 37, 1929–1936.
- DeMeo and Binzel (2008) DeMeo, F., Binzel, R. P., 2008. Comets in the near-Earth object population. Icarus 194, 436–449.
- DeMeo et al. (2009) DeMeo, F. E., Binzel, R. P., Slivan, S. M., Bus, S. J., 2009. An extension of the Bus asteroid taxonomy into the near-infrared. Icarus 202, 160–180.
- Dotto et al. (2004) Dotto, E., Barucci, M. A., Brucato, J. R., Müller, T. G., Carvano, J., 2004. 308 Polyxo: ISO-SWS spectrum up to 26 micron. Astron. Astrophys. 427, 1081–1084.
- Emery and Brown (2003) Emery, J. P., Brown, R. H., 2003. Constraints on the surface composition of Trojan asteroids from near-infrared (0.8-4.0 m) spectroscopy. Icarus 164, 104–121.
- Emery et al. (2011) Emery, J. P., Burr, D. M., Cruikshank, D. P., 2011. Near-infrared Spectroscopy of Trojan Asteroids: Evidence for Two Compositional Groups. Astron. J. 141, 25.
- Emery et al. (2006) Emery, J. P., Cruikshank, D. P., Van Cleve, J., 2006. Thermal emission spectroscopy (5.2 38 m) of three Trojan asteroids with the Spitzer Space Telescope: Detection of fine-grained silicates. Icarus 182, 496–512.
- Engelbracht et al. (2007) Engelbracht, C. W., et al., 2007. Absolute Calibration and Characterization of the Multiband Imaging Photometer for Spitzer. I. The Stellar Calibrator Sample and the 24 m Calibration. Publ. Astron. Soc. Pac. 119, 994–1018.
- Ernst and Schultz (2007) Ernst, C. M., Schultz, P. H., 2007. Evolution of the Deep Impact flash: Implications for the nucleus surface based on laboratory experiments. Icarus 191, 123–133.
- Fernández et al. (2013) Fernández, Y. R., et al., 2013. Thermal properties, sizes, and size distribution of Jupiter-family cometary nuclei. Icarus 226, 1138–1170.
- Fitzsimmons et al. (1994) Fitzsimmons, A., Dahlgren, M., Lagerkvist, C.-I., Magnusson, P., Williams, I. P., 1994. A spectroscopic survey of D-type asteroids. Astron. Astrophys. 282, 634–642.
- Frank et al. (2014) Frank, D. R., Zolensky, M. E., Le, L., 2014. Olivine in terminal particles of Stardust aerogel tracks and analogous grains in chondrite matrix. Geochim. Cosmochim. Acta 142, 240–259.
- Gehrz and Ney (1992) Gehrz, R. D., Ney, E. P., 1992. 0.7- to 23-micron photometric observations of P/Halley 2986 III and six recent bright comets. Icarus 100, 162–186.
- Gehrz et al. (2007) Gehrz, R. D., et al., 2007. The NASA Spitzer Space Telescope. Rev. Sci. Instrum. 78 (1), 011302.
- Giorgini et al. (1996) Giorgini, J. D., et al., 1996. JPL’s On-Line Solar System Data Service. Bull. Am. Astron. Soc. 28, 1158 (abstract).
- Groussin et al. (2007) Groussin, O., et al., 2007. Surface temperature of the nucleus of Comet 9P/Tempel 1. Icarus 187, 16–25.
- Groussin et al. (2011) Groussin, O., Lamy, P., Fornasier, S., Jorda, L., 2011. The properties of asteroid (2867) Steins from Spitzer Space Telescope observations and OSIRIS shape reconstruction. Astron. Astrophys. 529, A73.
- Groussin et al. (2013) Groussin, O., et al., 2013. The temperature, thermal inertia, roughness and color of the nuclei of Comets 103P/Hartley 2 and 9P/Tempel 1. Icarus 222, 580–594.
- Gulkis et al. (2015) Gulkis, S., et al., 2015. Subsurface properties and early activity of comet 67P/Churyumov-Gerasimenko. Science 347 (1), aaa0709.
- Hanner et al. (1981) Hanner, M. S., Giese, R. H., Weiss, K., Zerull, R., 1981. On the definition of albedo and application to irregular particles. Astron. Astrophys. 104, 42–46.
- Hanner et al. (1994) Hanner, M. S., Lynch, D. K., Russell, R. W., 1994. The 8-13 micron spectra of comets and the composition of silicate grains. Astrophys. J. 425, 274–285.
- Hanner and Zolensky (2010) Hanner, M. S., Zolensky, M. E., 2010. The Mineralogy of Cometary Dust. In: T. Henning (Ed.), Lecture Notes in Physics, Berlin Springer Verlag. Vol. 815 of Lecture Notes in Physics, Berlin Springer Verlag. pp. 203–232.
- Hapke and van Horn (1963) Hapke, B., van Horn, H., 1963. Photometric studies of complex surfaces, with applications to the Moon. J. Geophys. Res. 68, 4545–4570.
- Harker et al. (2002) Harker, D. E., Wooden, D. H., Woodward, C. E., Lisse, C. M., 2002. Grain Properties of Comet C/1995 O1 (Hale-Bopp). Astrophys. J. 580, 579–597.
- Harker et al. (2007) Harker, D. E., Woodward, C. E., Wooden, D. H., Fisher, R. S., Trujillo, C. A., 2007. Gemini-N mid-IR observations of the dust properties of the ejecta excavated from Comet 9P/Tempel 1 during Deep Impact. Icarus 190, 432–453.
- Harris (1998) Harris, A. W., 1998. A Thermal Model for Near-Earth Asteroids. Icarus 131, 291–301.
- Hergenrother et al. (2007) Hergenrother, C. W., Mueller, B. E. A., Campins, H., Samarasinha, N. H., McCarthy, D. W., 2007. R- and J-band photometry of Comets 2P/Encke and 9P/Tempel 1. Icarus 191, 45–50.
- Hiroi and Hasegawa (2003) Hiroi, T., Hasegawa, S., 2003. Revisiting the search for the parent body of the Tagish Lake meteorite - Case of a T/D asteroid 308 Polyxo -. Antarctic Meteorite Research 16, 176–184.
- Hiroi et al. (2001) Hiroi, T., Zolensky, M. E., Pieters, C. M., 2001. The Tagish Lake Meteorite: A Possible Sample from a D-Type Asteroid. Science 293, 2234–2236.
- Houck et al. (2004) Houck, J. R., et al., 2004. The Infrared Spectrograph (IRS) on the Spitzer Space Telescope. Astrophys. J., Suppl. Ser. 154, 18–24.
- Hsieh and Jewitt (2006) Hsieh, H. H., Jewitt, D., 2006. A Population of Comets in the Main Asteroid Belt. Science 312, 561–563.
- Hunt and Vincent (1968) Hunt, G. R., Vincent, R. K., 1968. The Behavior of Spectral Features in the Infrared Emission from Particulate Surfaces of Various Grain Sizes. J. Geophys. Res. 73, 6039.
- Jewitt and Luu (1989) Jewitt, D., Luu, J., 1989. A CCD portrait of Comet P/Tempel 2. Astron. J. 97, 1766–1790.
- Jewitt (2002) Jewitt, D. C., 2002. From Kuiper Belt Object to Cometary Nucleus: The Missing Ultrared Matter. Astron. J. 123, 1039–1049.
- Jones et al. (1990) Jones, T. D., Lebofsky, L. A., Lewis, J. S., Marley, M. S., 1990. The composition and origin of the C, P, and D asteroids - Water as a tracer of thermal evolution in the outer belt. Icarus 88, 172–192.
- Kelley and Wooden (2009) Kelley, M. S., Wooden, D. H., 2009. The composition of dust in Jupiter-family comets inferred from infrared spectroscopy. Planet. Space Sci. 57, 1133–1145.
- Kelley et al. (2006) Kelley, M. S., et al., 2006. A Spitzer Study of Comets 2P/Encke, 67P/Churyumov-Gerasimenko, and C/2001 HT50 (LINEAR-NEAT). Astrophys. J. 651, 1256–1271.
- Lagerros (1998) Lagerros, J. S. V., 1998. Thermal physics of asteroids. IV. Thermal infrared beaming. Astron. Astrophys. 332, 1123–1132.
- Lebofsky et al. (1986) Lebofsky, L. A., et al., 1986. A refined ’standard’ thermal model for asteroids based on observations of 1 Ceres and 2 Pallas. Icarus 68, 239–251.
- Li et al. (2007) Li, J.-Y., et al., 2007. Deep Impact photometry of Comet 9P/Tempel 1. Icarus 187, 41–55.
- Licandro et al. (2011) Licandro, J., et al., 2011. (65) Cybele: detection of small silicate grains, water-ice, and organics. Astron. Astrophys. 525, A34.
- Lim et al. (2011) Lim, L. F., Emery, J. P., Moskovitz, N. A., 2011. Mineralogy and thermal properties of V-type Asteroid 956 Elisa: Evidence for diogenitic material from the Spitzer IRS (5-35 m) spectrum. Icarus 213, 510–523.
- Lindsay et al. (2013) Lindsay, S. S., Wooden, D. H., Harker, D. E., Kelley, M. S., Woodward, C. E., Murphy, J. R., 2013. Absorption Efficiencies of Forsterite. I. Discrete Dipole Approximation Explorations in Grain Shape and Size. Astrophys. J. 766, 54.
- Lisse et al. (2005) Lisse, C. M., et al., 2005. Rotationally Resolved 8-35 Micron Spitzer Space Telescope Observations of the Nucleus of Comet 9P/Tempel 1. Astrophys. J., Lett. 625, L139–L142.
- Lisse et al. (2006) Lisse, C. M., et al., 2006. Spitzer Spectral Observations of the Deep Impact Ejecta. Science 313, 635–640.
- Luu (1993) Luu, J. X., 1993. Spectral diversity among the nuclei of comets. Icarus 104, 138–148.
- Makovoz and Khan (2005) Makovoz, D., Khan, I., 2005. Mosaicking with MOPEX. In: P. Shopbell, M. Britton, & R. Ebert (Ed.), Astronomical Data Analysis Software and Systems XIV. Vol. 347 of Astronomical Society of the Pacific Conference Series. p. 81.
- Makovoz and Marleau (2005) Makovoz, D., Marleau, F. R., 2005. Point-Source Extraction with MOPEX. Publ. Astron. Soc. Pac. 117, 1113–1128.
- Marchis et al. (2012) Marchis, F., et al., 2012. Multiple asteroid systems: Dimensions and thermal properties from Spitzer Space Telescope and ground-based observations. Icarus 221, 1130–1161.
- Meech et al. (2005) Meech, K. J., et al., 2005. The Deep Impact Earth-Based Campaign. Space Sci. Rev. 117, 297–334.
- Millis et al. (1988) Millis, R. L., A’Hearn, M. F., Campins, H., 1988. An investigation of the nucleus and coma of Comet P/Arend-Rigaux. Astrophys. J. 324, 1194–1209.
- Morrison and Lebofsky (1979) Morrison, D., Lebofsky, L., 1979. Radiometry of asteroids. In: Gehrels, T. (Ed.), Asteroids. Univ. Arizona Press, Tucson, AZ, pp. 184–205.
- Mueller et al. (2010) Mueller, M., et al., 2010. Eclipsing binary Trojan asteroid Patroclus: Thermal inertia from Spitzer observations. Icarus 205, 505–515.
- Quanz et al. (2007) Quanz, S. P., et al., 2007. Evolution of Dust and Ice Features around FU Orionis Objects. Astrophys. J. 668, 359–383.
- Reach et al. (2007) Reach, W. T., Kelley, M. S., Sykes, M. V., 2007. A survey of debris trails from short-period comets. Icarus 191, 298–322.
- Reach et al. (2013) Reach, W. T., Kelley, M. S., Vaubaillon, J., 2013. Survey of cometary CO2, CO, and particulate emissions using the Spitzer Space Telescope. Icarus 226, 777–797.
- Reach et al. (2010) Reach, W. T., Vaubaillon, J., Lisse, C. M., Holloway, M., Rho, J., 2010. Explosion of Comet 17P/Holmes as revealed by the Spitzer Space Telescope. Icarus 208, 276–292.
- Richardson et al. (2007) Richardson, J. E., Melosh, H. J., Lisse, C. M., Carcich, B., 2007. A ballistics analysis of the Deep Impact ejecta plume: Determining Comet Tempel 1’s gravity, mass, and density. Icarus 191, 176–209.
- Rieke et al. (2015) Rieke, G. H., et al., 2015. The Mid-Infrared Instrument for the James Webb Space Telescope, I: Introduction. Publ. Astron. Soc. Pac. 127, 584–594.
- Rieke et al. (2004) Rieke, G. H., et al., 2004. The Multiband Imaging Photometer for Spitzer (MIPS). Astrophys. J., Suppl. Ser. 154, 25–29.
- Ryan and Woodward (2010) Ryan, E. L., Woodward, C. E., 2010. Rectified Asteroid Albedos and Diameters from IRAS and MSX Photometry Catalogs. Astron. J. 140, 933–943.
- Salisbury and Wald (1992) Salisbury, J. W., Wald, A., 1992. The role of volume scattering in reducing spectral contrast of reststrahlen bands in spectra of powdered minerals. Icarus 96, 121–128.
- Schambeau et al. (2015) Schambeau, C. A., Fernández, Y. R., Lisse, C. M., Samarasinha, N., Woodney, L. M., 2015. A new analysis of Spitzer observations of Comet 29P/Schwassmann-Wachmann 1. Icarus 260, 60–72.
- Sekanina (1979) Sekanina, Z., 1979. Fan-shaped coma, orientation of rotation axis, and surface structure of a cometary nucleus. I - Test of a model on four comets. Icarus 37, 420–442.
- Sierks et al. (2015) Sierks, H., et al., 2015. On the nucleus structure and activity of comet 67P/Churyumov-Gerasimenko. Science 347 (1), aaa1044.
- Sitko et al. (2011) Sitko, M. L., et al., 2011. Infrared Spectroscopy of Comet 73P/Schwassmann-Wachmann 3 Using the Spitzer Space Telescope. Astron. J. 142, 80.
- Sitko et al. (2004) Sitko, M. L., Lynch, D. K., Russell, R. W., Hanner, M. S., 2004. 3-14 Micron Spectroscopy of Comets C/2002 O4 (Hönig), C/2002 V1 (NEAT), C/2002 X5 (Kudo-Fujikawa), C/2002 Y1 (Juels-Holvorcem), and 69P/Taylor and the Relationships among Grain Temperature, Silicate Band Strength, and Structure among Comet Families. Astrophys. J. 612, 576–587.
- Sivaraman et al. (2015) Sivaraman, B., Venkataraman, V., Kalyaan, A., Arora, S., Ganesh, S., 2015. Exposed amorphous water ice on comet 49P/Arend-Rigaux. Adv. Space Res. 56, 2428–2431.
- Spencer (1990) Spencer, J. R., 1990. A rough-surface thermophysical model for airless planets. Icarus 83, 27–38.
- Spencer et al. (1989) Spencer, J. R., Lebofsky, L. A., Sykes, M. V., 1989. Systematic biases in radiometric diameter determinations. Icarus 78, 337–354.
-
Spitzer Science Center (2012)
Spitzer Science Center, 2012. IRS Instrument Handbook. Spitzer Science
Center, Pasadena.
URL http://ssc.spitzer.caltech.edu/irs/irsinstrumenthandbook/ - Stansberry et al. (2004) Stansberry, J. A., et al., 2004. Spitzer Observations of the Dust Coma and Nucleus of 29P/Schwassmann-Wachmann 1. Astrophys. J., Suppl. Ser. 154, 463–468.
- Sykes et al. (1990) Sykes, M. V., Lien, D. J., Walker, R. G., 1990. The Tempel 2 dust trail. Icarus 86, 236–247.
- Takir and Emery (2012) Takir, D., Emery, J. P., 2012. Outer Main Belt asteroids: Identification and distribution of four 3-m spectral groups. Icarus 219, 641–654.
- Tholen (1984) Tholen, D. J., 1984. Asteroid taxonomy from cluster analysis of photometry. Ph.D. thesis, University of Arizona, Tucson.
- Thomas et al. (2013a) Thomas, P., et al., 2013a. The nucleus of Comet 9P/Tempel 1: Shape and geology from two flybys. Icarus 222, 453–466.
- Thomas et al. (2013b) Thomas, P. C., et al., 2013b. Shape, density, and geology of the nucleus of Comet 103P/Hartley 2. Icarus 222, 550–558.
- Tokunaga and Hanner (1985) Tokunaga, A. T., Hanner, M. S., 1985. Does comet P/Arend-Rigaux have a large dark nucleus? Astrophys. J., Lett. 296, L13–L16.
- Veeder et al. (1987) Veeder, G. J., Hanner, M. S., Tholen, D. J., 1987. The nucleus of comet P/Arend-Rigaux. Astron. J. 94, 169–173.
- Vernazza et al. (2012) Vernazza, P., et al., 2012. High surface porosity as the origin of emissivity features in asteroid spectra. Icarus 221, 1162–1172.
- Vernazza et al. (2013) Vernazza, P., et al., 2013. Paucity of Tagish Lake-like parent bodies in the Asteroid Belt and among Jupiter Trojans. Icarus 225, 517–525.
- Veverka et al. (2013) Veverka, J., et al., 2013. Return to Comet Tempel 1: Overview of Stardust-NExT results. Icarus 222, 424–435.
- Werner et al. (2004) Werner, M. W., et al., 2004. The Spitzer Space Telescope Mission. Astrophys. J., Suppl. Ser. 154, 1–9.
- Wolters et al. (2008) Wolters, S. D., Green, S. F., McBride, N., Davies, J. K., 2008. Thermal infrared and optical observations of four near-Earth asteroids. Icarus 193, 535–552.
- Wooden (2002) Wooden, D. H., 2002. Comet Grains: Their IR Emission and Their Relation to ISM Grains. Earth, Moon, Planets 89, 247–287.
- Wooden et al. (1999) Wooden, D. H., et al., 1999. Silicate Mineralogy of the Dust in the Inner Coma of Comet C/1995 01 (Hale-Bopp) Pre- and Postperihelion. Astrophys. J. 517, 1034–1058.
- Woodward et al. (2011) Woodward, C. E., et al., 2011. Dust in Comet C/2007 N3 (Lulin). Astron. J. 141, 181.
- Yang and Jewitt (2007) Yang, B., Jewitt, D., 2007. Spectroscopic Search for Water Ice on Jovian Trojan Asteroids. Astron. J. 134, 223–228.