There is something beyond the Twitter network
Abstract
How information spreads through a social network? Can we assume, that the information is spread only through a given social network graph? What is the correct way to compare the models of information flow? These are the basic questions we address in this work.
We focus on meticulous comparison of various, well-known models of rumor propagation in the social network. We introduce the model incorporating mass media and effects of absent nodes. In this model the information appears spontaneously in the graph. Using the most conservative metric, we showed that the distribution of cascades sizes generated by this model fits the real data much better than the previously considered models.
1 Introduction
Sociology, empirical investigation, critical analysis, social policy, political science and market analysis—it is just the beginning of the long list of research areas focused on the information diffusion. Today, when more and more communication can be tracked and logged, those fields of research can benefit from the analysis of the social networks. The research on the information diffusion can be applied to maximize the influence [12] and virality of the rumor, enhancing recommender systems or improving routing algorithms [8].
Current, state-of-the-art models of the information diffusion do not correctly predict the distribution of cascades sizes [7] (the cascade size is the number of nodes sharing a given information). Application of these models in the aforementioned areas can lead to a hardware overload, non-optimal recommendations erroneous predictions about influence. In this work we claim that, the main problem is the fact that the information does not diffuse only in the known social network. Namely, there is something beyond the easily observable relations. Our analysis on the Twitter network has showed that the information spreads not only by the known connections of acquaintance. To model the information diffusion one needs to incorporate effects of inoculating a rumor by absent nodes, different social networks, mass media or a word of mouth. All effects might be responsible for spawning the rumor by nodes that are not connected in social network. We introduce the multi-source model, that can be expressed as an extension to the standard compound Poisson process. This model incorporates the spontaneous rumor inoculation in the simple information diffusion model. The application of such well based method allows us to tune the cascade size distribution to a real data with almost no cost in the time complexity.
The contribution of this work is to propose a simple, replicable metric and an anonymised dataset to provide the measurable comparison between information diffusion models. Moreover, we provide the efficient source code to evaluate basic models [18]. Finally, we claim that the Kolmogorov-Smirnov test should be used to collate distributions of information cascades sizes. Based on that test, we showed that the effects of mass media are substantial to model the information diffusion.
1.1 Related Work
The dynamics of an information flow in social networks has been studied by numerous researchers [7, 19, 14].
Originally, the epidemiology and the solid-state physic areas suggested different models such as SIR (susceptible infectious recovered) or SIS (susceptible infectious susceptible). These models had been employed to predict dynamics of information spread. However, all of these models assume that everyone in the population is in the contact with everyone else [2], which is unrealistic in the large social network.
The classical example of a modified spreading process has been considered in [1] by adding the effect of stifler. Stiflers never spread the information, even if they were exposed to it multiple times. Nevertheless, stiflers can actively convert spreaders or susceptible nodes into stiflers. Nevertheless, it is unclear who would act as a stifler in the fast news propagating network like Twitter or Digg.
Leskovec et al. [15] proposed the cascade generation model and simulated it on the dataset of blog links. Their model assumed that every connection in the information propagation graph is equally important and used a single parameter that measures infectiousness of an average rumor. Then, they acknowledge a simple improvements in their model of the cascade generation. Most notably, they noted that exponential decrease of the infectiousness can also be considered to model the information spread.
Collaterally, researchers have analyzed properties of the social network graph [9, 1] and the distribution of the cascades sizes (or rumor popularities) [10]. Today, it is well known, that cascades sizes follow a heavy tail distribution [14] but due to the lack of appropriate data it is still unclear, whether it follows the power-law (Pareto) or the lognormal distribution.
Since then, computer scientists noticed that the state-of-the-art rumor propagation models do not predict such distribution. Steeg et al. [19] observed that information propagates onto an entire graph too often and Cui et al. [7] showed an evident phase transition for middle sized rumors. However, those observations lack the systematized metric to compare predictions with the real cascade size distribution. In this work we claim that K-S test is the most conservative benchmark for testing these features. Moreover, we propose that every experiment ought to be meticulously tested to avoid misinterpretations.
2 Modeling Information Cascades
2.1 Comparison Metric and Evaluation
Since heavy tailed distribution of cascade sizes had been observed, there has been many attempts to readjust the diffusion models to the real data [7, 19]. Unfortunately, none of them has proposed an adequate metric to measure this distribution.
It is tempting to propose a metric that would somehow punish errors on a tail of distribution (in contrary to exponential distribution, the large events do happen more often in the power-law distribution). Another naive idea is to assume that the power-law distribution is linear on a log-log plot and use the linear regression to fit it. Unfortunately, Clauset et al. [6] claim that both of those methods have serious problems with variation and many distributions might be misclasified by these metrics.
The method of analyzing a power-law distributed data should [6] involve goodness-of-fit test. The most commonly used is Kolmogorov-Smirnov test (K-S test):
which computes the maximal difference between cumulative distribution functions (CDF) of a real and predicted distributions ( is the CDF of a predicted data and the CDF of a real data). Recently, Bild et al. [3] showed that using the aforementioned methods, the lifetime of a tweet does not follow the Pareto distribution but in fact it is the type-II discrete Weibull distribution.
Introducing models with multiple parameters may lead to the serious overfitting. Because, when comparing to the Pareto distribution of cascade sizes, returnining only cascades with size smaller than can result K-S test smaller than . When one introduces a flexible model like ICM [11], one needs to carefully analyze the model to avoid overfitting. It might be tempting to use machine learning approach based on the large number of features. This might result in a better fit to the real distribution of cascades sizes. On the other hand, the reasoning based on this approach can be hard. In this paper, we focus on the models that describe the fundamental mechanisms of the information diffusion.
The analysed models are trained using grid search. We chose the parameters, so the empirical error of K-S test is smaller than .
2.2 Dataset Description
We analyzed the set of over 500 million tweets, extracted from 10% sample of Twitter tweets collected from May 19 to May 30 2013. In our dataset, each tweet beside the content of the tweet contained hashtags list, user id and if existed ids of the mentioned users, retweeted user id and id of the user this tweet was a reply to.
Based on that, we generated the graph of retweets: the vertices in graph are user ids that occurred in our dataset. If there exists a tweet with user retweeting, replying or mentioning user , then we add an edge from vertex to . The graph of retweets contained 71 million vertices and 230 million edges.
The popularity of the hashtag is the number of users that had used it. Recall, that our goal is to analyze the information diffusion on social network. Hence, we have focused merely on fresh hashtags: we keep hashtags that did not occur during the first day of our sample. The specific day used as the first day for new hashtags should not influence the results of the tests, because the majority of the cascades last less than few days [13]. Finally, we obtained 7.7 million of distinct, fresh hashtags. Based on these hashtags, we generated popularity distribution, that will be used to compare models of information diffusion.
The graph of retweets strongly depends on the number of gathered events. Be aware that the parameters of the presented algorithms depend on the specific retweet graph. The parameters for graph produced from all events from a given month will be probably different. For example, in the introduced models, the probability that an individual will retweet decreases with the density of the graph. On the other hand, we need general models independent from the instance of the network. A standard approach to avoid overfitting is to divide the set of tweets into two independent subsets: the training set used for tuning parameters and the test set used for the validation. We divided the set of the retweets into two sets each containing half of the available, consecutive, full days. We evaluated model , model and multi-source on both training and test sets. The grid search shows that the optimal parameters for training and test set are identical. The K-S test values for both sets are identical up to error. Overall ranking of the models is not changed. Hence, our analysis is not prone to overfitting. To achieve better precision, through the rest of the work, we use the graph based on all events.
To promote the study on information diffusion we share our dataset with the other researchers [17]. We have removed unnecessary parameters and anonymized our dataset according to the Twitter rules regarding public sharing.
2.3 The Graph of Retweets versus the Follower-Followee Graph
There is another choice of information dissemination graph, namely, the follower-followee graph. Bild et al. [3] claim, that people are more selective in what they say, rather than whom they listen. Moreover, Bild et al. [3] assert that the graph of retweets may encode the true interest among the users better than follower-followee graph. Since the cascades consist of interactions, the graph of retweets seems to be a better choice than the follower-followee graph. Note that follower-followee relationship is perturbed by a Twitter recommendation system. Altogether, we believe that the graph of retweets describes the relationships between the users much better than the follower-followee graph. Moreover, the current retweet graph can be obtained by using the Twitter API [20]. Unfortunately the up-to-date, follower-followee graph is currently unavailable.
2.4 Cascade Generation Model
The cascade generation model (CGM) introduced by [15] uses constant , which is the probability that the information is passed from a user to its follower.
According to [15] the cascade is generated in the following steps:
-
1.
Uniformly at random pick a starting point of the cascade and add it to the set of newly informed nodes.
-
2.
Every newly informed node, for each of his direct neighbors, makes a separate decision to inform the neighbor with the probability .
-
3.
Let newly informed be the set of nodes that have been informed for the first time in step and add them to the generated cascade.
-
4.
Add all newly informed nodes to the generated cascade.
-
5.
Repeat steps to until newly informed set is empty.
In CGM regime all nodes have an identical impact (). The final graph of the information spread is called a cascade.
2.5 Model Alpha
CGM is modeling communication with all connected nodes independently. That is, in the step , newly informed node might potentially pass the information only to some subset of its acquaintances. However, Twitter is a microblogging platform where messages posted by a user are instantly received by all of its followers. Then, each follower may share these messages with his followers by replying, retweeting or mentioning.
We propose the model which resembles the CGM, but is better suited for the schemes of communication in the Twitter network. The single cascade of model is generated as follows:
-
1.
Uniformly at random pick a starting point of the cascade and add it to the set of the newly informed nodes.
-
2.
Every newly informed node independently with the probability becomes a spreader and then informs all their direct neighbors.
-
3.
Let newly informed be the new set of nodes that have been informed for the first time in step .
-
4.
Add all new spreading nodes to the generated cascade.
-
5.
Repeat the steps to until the newly informed set is empty.
Indeed, the model differs from CGM:
-
•
The main difference is in the point , where in the model the newly informed node makes a single decision: either to inform all of his followers or to inform none of them.
-
•
In the CGM nodes might had multiple chances to become a spreader (after receiving an information from each of the followed nodes). However, in the model , each of the informed nodes has just one chance to become a spreader: only after being informed for the first time.
-
•
The final cascade size is the total number of spreaders, whereas in CGM it is the number of informed nodes.
2.5.1 Experimental Results
We simulated model on the graph of retweets. We used grid search algorithm with step to tune parameter . Subsequently, for every we ran 10 million simulations to generate the cascades size distribution. Then we computed K-S test for each distribution. The best K-S test was achieved for . Our experiments show that roughly of cascades in this model are larger than . On the other hand, in the real data, the large cascades constitute of all cascades. This amount of the large cascades is the main reason for such low K-S test result of the model . Hence, we need a model in which the number of extremely large cascades is heavily reduced.
2.6 Exponential Model
Twitter rumors have a limited lifetime. The information obeys the effect: the further from source, the lower the virality of the information. Model will simulate that process by decreasing the infectiousness of the information after each round. The only difference from model is decreasing probability of becoming a spreader:
-
•
In the first round each neighbor of a initial vertex is informed and then with probability becomes the spreader.
-
•
During the round no. each previously, not informed neighbor of the new spreaders from the round is informed and subsequently, with probability becomes a spreader.
2.6.1 Experimental Simulations of Exponential Model
Once again, we conducted simulations on Twitter retweets graph. We used grid search algorithm with step to tune parameter . For each we performed million simulations and then we computed K-S test on each distribution versus real distribution. For we obtained the best K-S test value which is roughly the half of the value of model . The K-S test value is mostly affected by the probabilities of a few smallest cascades sizes. Namely, in model of cascades have size , versus in the real data.
2.7 Multi-source Exponential Model
The exact structure of the connections between all people in the world is unknown. It can be modeled by the graph of followers [4] or the graph of retweets [7], which can successfully approximate the real connections. Because of existence of mass media, absent nodes or communications through channels unavailable for researchers such as telephones, private conversations or emails, sometimes the information emerges somehow randomly in the new source nodes.
We have a graph with extremely many nodes . Moreover, probability that a randomly selected node will spread the information it was not informed of, through our network is ridiculously low. Hence, the number of spreaders that get to known the information from a different source can be modeled by the Binomial distribution:
However, by the law of rare events, this can be approximated by Poisson distribution:
Of course here, we assume that we do not consider globally known rumors, where probability is not that low (e.g., the information concerning a soccer match TV transmission, where Twitter users share the exceptional achievements through a social network).
We can model the information diffusion as follows:
-
•
Randomly choose the first node that will be informed.
-
•
Propagate the information using the model from the previous section.
-
•
Until there are new, informed nodes, in each round randomly choose new source nodes and propagate information from those nodes by model .
This model has one additional parameter which is interpreted as the expected number of nodes randomly informed in each round. Leskovec et al. [15] show that, the single-sourced cascades very rarely collide with each other. Hence, if one assumes that all cascades are disjoint, then the final rumor size can be approximated by the sum of the cascades sizes. Procedure MultiSourceAlphaExp() (see Algorithm 1) computes the size of random rumor, where:
-
•
RandomAlphaExpCascade() returns properties (the total size and the number of rounds) of a random cascade generated by model .
-
•
RandomPoisson() gives a random integer from .
The distribution of cascade properties (pairs of the total size and the number of rounds) generated by the model can be precomputed. So choosing the random cascades will take time. Hence, the time complexity of Algorithm 1 is , where is the expected number of rounds. However, for sufficiently large values of the algorithm may not stop.
Now, the results of multi-source model can be reformulated as:
where:
-
•
is a total number of rounds in a single simulation.
-
•
Cascades sizes are independent random variables from a distribution generated by model .
-
•
is a Poisson process with rate .
Such definition of is called compound Poisson process. Because we always start with the initial cascade, multi-source model is a simple extension of this process.
2.7.1 Experimental Simulations
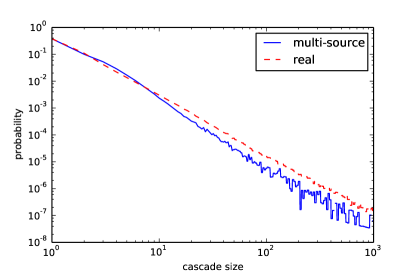
Based on the Algorithm 1, we simulated multi-source model on the Twitter retweets graph. We conducted an effective grid search algorithm over parameters and with step size . For each pair of parameters we run million simulations to obtain a cascade size distribution. Finally, for them, we computed K-S test. The minimal value of K-S test was obtained for and . The K-S test value is roughly the half of the value for model The results for are the same as the results of model , since implies that we generate only a single source of an information.
On Figure 1 one can see the comparison of the real distribution of cascades sizes and the distribution generated by multi-source model for the best pair of parameters and .
3 Discussion and Future work
The observation that rumor popularity follows the power-law enables researchers to precisely model the information diffusion in the social network. Here, we showed that simple, one parameter models are insufficient. These models produce cascades either extremely large or small. That phenomenon is known as the phase transition [7]. Gradually decreasing infectiousness of the information over time prevents this problem and results in more accurate predictions.
Our main contribution is that the rumor can spread through a different, unknown media. We proposed to model it by informing random nodes in the network. This improvement significantly boost the estimated distribution of cascade size. Finally, it demonstrates that the underlaying network of the social interactions is much more complex than just the graph of retweets and the study on the new ways of estimating it needs more attention.
Based on the observations made by Leskovec et al. [15] regarding the cascade collisions, we proposed the method based on the compound Poisson process. This enables us to produce accurate multi-sourced cascades with a very little cost. Moreover, this technique significantly lowered the simulation time.
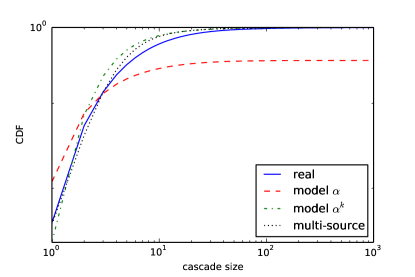
We present the final results and comparison of these models in Table 1. On Figure 2 we have shown the comparison between the CDFs computed for different models. Recall, that the K-S test responds to the maximal difference of the CDFs. The best K-S test value is obtained for the multi-source model. In order to speed up simulation of model , we have truncated simulations of of largest cascades. Cutting off these cascades does not change the final K-S test results, because in the real cascade size distribution the probability that the size of a cascade is larger than is less than .
| Model | K-S test |
|---|---|
| Model | 0.0447 |
| Model | 0.0207 |
| Model multi-source | 0.0116 |
To obtain even more accurate results, one would need to incorporate more complex effects, for example:
-
•
Geographically close nodes might be informed through an unknown social network. Close nodes should be informed with higher probability than distant [21].
-
•
The probability of randomly informing a node may decrease in time because the information may become obsolete [7].
-
•
The evolution of the social network structure within time [5].
As mentioned in Section 2.2, the probability of spreading the information (i.e., parameter in the model ) decrease with the size of the graph of retweets. It would be very interesting to investigate the dependence between the model parameters and the density of the graph of retweets. Moreover, it would be interesting to study the growth rate of the graph of retweets.
4 Acknowledgments
This work was supported by ERC StG project PAAl 259515 and FET project MULTIPLEX 317532. We would also want to thank Stefano Leonardi for sharing the data and Rafał Latała for meaningful discussions.
References
- Barthelemy et al. [2007] Marc Barthelemy, Alain Barrat, and Alessandro Vespignani. The role of geography and traffic in the structure of complex networks. Advances in Complex Systems, 10(1):5–28, 2007. doi: 10.1142/S021952590700091X. URL http://dx.doi.org/10.1142/S021952590700091X.
- Bayley [1975] N. Bayley. The mathematical theory of epidemics. Griffin, London, 1975.
- Bild et al. [2015] David R. Bild, Yue Liu, Robert P. Dick, Zhuoqing Morley Mao, and Dan S. Wallach. Aggregate characterization of user behavior in twitter and analysis of the retweet graph. ACM Trans. Internet Techn., 15(1):4:1–4:24, 2015. doi: 10.1145/2700060. URL http://doi.acm.org/10.1145/2700060.
- Brach et al. [2014] Pawel Brach, Alessandro Epasto, Alessandro Panconesi, and Piotr Sankowski. Spreading rumours without the network. In Alessandra Sala, Ashish Goel, and Krishna P. Gummadi, editors, Proceedings of the second ACM conference on Online social networks, COSN 2014, Dublin, Ireland, October 1-2, 2014, pages 107–118. ACM, 2014. ISBN 978-1-4503-3198-2. doi: 10.1145/2660460.2660472. URL http://doi.acm.org/10.1145/2660460.2660472.
- Brandt and Leskovec [2014] Christina Brandt and Jure Leskovec. Status and friendship: mechanisms of social network evolution. In Chin-Wan Chung, Andrei Z. Broder, Kyuseok Shim, and Torsten Suel, editors, 23rd International World Wide Web Conference, WWW ’14, Seoul, Republic of Korea, April 7-11, 2014, Companion Volume, pages 229–230. ACM, 2014. ISBN 978-1-4503-2745-9. doi: 10.1145/2567948.2577327. URL http://doi.acm.org/10.1145/2567948.2577327.
- Clauset et al. [2009] Aaron Clauset, Cosma Rohilla Shalizi, and Mark E. J. Newman. Power-law distributions in empirical data. SIAM Review, 51(4):661–703, 2009. doi: 10.1137/070710111. URL http://dx.doi.org/10.1137/070710111.
- Cui et al. [2014] Biru Cui, Shanchieh Jay Yang, and Christopher Homan. Non-independent cascade formation: Temporal and spatial effects. In Jianzhong Li, Xiaoyang Sean Wang, Minos N. Garofalakis, Ian Soboroff, Torsten Suel, and Min Wang, editors, Proceedings of the 23rd ACM International Conference on Conference on Information and Knowledge Management, CIKM 2014, Shanghai, China, November 3-7, 2014, pages 1923–1926. ACM, 2014. ISBN 978-1-4503-2598-1. doi: 10.1145/2661829.2662035. URL http://doi.acm.org/10.1145/2661829.2662035.
- Gaba et al. [2012] Albana Gaba, Spyros Voulgaris, Konrad Iwanicki, and Maarten van Steen. Revisiting gossip-based ad-hoc routing. In WiMAN 2012: Proceedings of the 6th International Workshop on Wireless Mesh and Ad Hoc Networks, Munich, Germany, July 2012. IEEE. doi: 10.1109/ICCCN.2012.6289312.
- Ghosh and Huberman [2013] Rumi Ghosh and Bernardo A. Huberman. Ultrametricity of information cascades. CoRR, abs/1310.2619, 2013. URL http://arxiv.org/abs/1310.2619.
- Iribarren and Moro [2011] José Luis Iribarren and Esteban Moro. Branching dynamics of viral information spreading. CoRR, abs/1110.1884, 2011. URL http://arxiv.org/abs/1110.1884.
- Kempe et al. [2003a] David Kempe, Jon Kleinberg, and Éva Tardos. Maximizing the spread of influence through a social network. In Proceedings of the Ninth ACM SIGKDD International Conference on Knowledge Discovery and Data Mining, KDD ’03, pages 137–146, New York, NY, USA, 2003a. ACM. ISBN 1-58113-737-0. doi: 10.1145/956750.956769. URL http://doi.acm.org/10.1145/956750.956769.
- Kempe et al. [2003b] David Kempe, Jon M. Kleinberg, and Éva Tardos. Maximizing the spread of influence through a social network. In Lise Getoor, Ted E. Senator, Pedro M. Domingos, and Christos Faloutsos, editors, Proceedings of the Ninth ACM SIGKDD International Conference on Knowledge Discovery and Data Mining, Washington, DC, USA, August 24 - 27, 2003, pages 137–146. ACM, 2003b. ISBN 1-58113-737-0. doi: 10.1145/956750.956769. URL http://doi.acm.org/10.1145/956750.956769.
- Kwak et al. [2010] Haewoon Kwak, Changhyun Lee, Hosung Park, and Sue Moon. What is twitter, a social network or a news media? In Proceedings of the 19th International Conference on World Wide Web, WWW ’10, pages 591–600, New York, NY, USA, 2010. ACM. ISBN 978-1-60558-799-8. doi: 10.1145/1772690.1772751. URL http://doi.acm.org/10.1145/1772690.1772751.
- Lerman and Ghosh [2010] Kristina Lerman and Rumi Ghosh. Information contagion: An empirical study of the spread of news on digg and twitter social networks. In William W. Cohen and Samuel Gosling, editors, Proceedings of the Fourth International Conference on Weblogs and Social Media, ICWSM 2010, Washington, DC, USA, May 23-26, 2010. The AAAI Press, 2010. URL http://www.aaai.org/ocs/index.php/ICWSM/ICWSM10/paper/view/1509.
- Leskovec et al. [2007] Jure Leskovec, Mary McGlohon, Christos Faloutsos, Natalie S. Glance, and Matthew Hurst. Patterns of cascading behavior in large blog graphs. In Proceedings of the Seventh SIAM International Conference on Data Mining, April 26-28, 2007, Minneapolis, Minnesota, USA, pages 551–556. SIAM, 2007. ISBN 978-0-89871-630-6. doi: 10.1137/1.9781611972771.60. URL http://dx.doi.org/10.1137/1.9781611972771.60.
- Milojevic [2010] Stasa Milojevic. Power law distributions in information science: Making the case for logarithmic binning. JASIST, 61(12):2417–2425, 2010. doi: 10.1002/asi.21426. URL http://dx.doi.org/10.1002/asi.21426.
- Pacuk et al. [2016a] Andrzej Pacuk, Karol Wegrzycki, and Piotr Wygocki. Retweet graph. http://social-networks.mimuw.edu.pl/data/, 2016a.
- Pacuk et al. [2016b] Andrzej Pacuk, Karol Wegrzycki, and Piotr Wygocki. Rumor spreading. https://github.com/approx-uw/rumor_spreading/, 2016b.
- Steeg et al. [2011] Greg Ver Steeg, Rumi Ghosh, and Kristina Lerman. What stops social epidemics? In Lada A. Adamic, Ricardo A. Baeza-Yates, and Scott Counts, editors, Proceedings of the Fifth International Conference on Weblogs and Social Media, Barcelona, Catalonia, Spain, July 17-21, 2011. The AAAI Press, 2011. URL http://www.aaai.org/ocs/index.php/ICWSM/ICWSM11/paper/view/2781.
- twitter.com [2016] twitter.com. Twitter api. https://dev.twitter.com/rest/public, 2016.
- West et al. [2013] Robert West, Ryen W. White, and Eric Horvitz. Here and there: goals, activities, and predictions about location from geotagged queries. In Gareth J. F. Jones, Paraic Sheridan, Diane Kelly, Maarten de Rijke, and Tetsuya Sakai, editors, The 36th International ACM SIGIR conference on research and development in Information Retrieval, SIGIR ’13, Dublin, Ireland - July 28 - August 01, 2013, pages 817–820. ACM, 2013. ISBN 978-1-4503-2034-4. doi: 10.1145/2484028.2484125. URL http://doi.acm.org/10.1145/2484028.2484125.