Massive Star Formation in the LMC. I. N159 and N160 Complexes
Abstract
We present images and spectral energy distributions (SEDs) of massive young stellar objects (YSOs) in three star-forming H II regions of the Large Magellanic Cloud: N159A, N159 Papillon, and N160. We use photometry from SOFIA/FORCAST at 25.3–37.1 µm to constrain model fits to the SEDs and determine luminosities, ages, and dust content of the embedded YSOs and their local environments. By placing these sources on mid-infrared color-magnitude and color-color diagrams, we analyze their dust properties and consider their evolutionary status. Since each object in the FORCAST images has an obvious bright near-infrared counterpart in Spitzer Space Telescope images, we do not find any evidence for new, very cool, previously-undiscovered Class 0 YSOs. Additionally, based on its mid-infrared colors and model parameters, N159A is younger than N160 and the Papillon. The nature of the first extragalactic protostars in N159, P1 and P2, is also discussed.
1 Introduction
Rich with H II regions and OB associations, the nearby Large Magellanic Cloud (LMC) is an excellent laboratory for the study of massive star formation. With a lower metallicity and significantly lower total galactic mass than the Milky Way, the LMC provides a unique opportunity to probe star formation under physical conditions that mirror those in dwarf galaxies and in the early universe. Stellar populations in the LMC provide tests for understanding both massive star formation and the interplay between star formation and the interstellar medium (ISM). The conditions of star formation in the LMC have both moderate dissimilarities to the Milky Way and many similarities, such as the presence of carbon monoxide, dust, and a strong UV field.
While much work has been done on low-mass star formation in dense molecular complexes (Allen et al., 2007; Galametz et al., 2009), massive star formation is still poorly understood. Commonly forming in tight clusters of OB stars, massive stars provide strong feedback mechanisms in shaping their local environments. A single O or B-type star, with a lifetime of just 2 Myrs, can significantly disrupt the surrounding molecular gas in the region in which it is embedded. Feedback mechanisms such as photoionization and momentum-driven winds can quench star formation for a million years or more (Dale et al., 2013a, b).
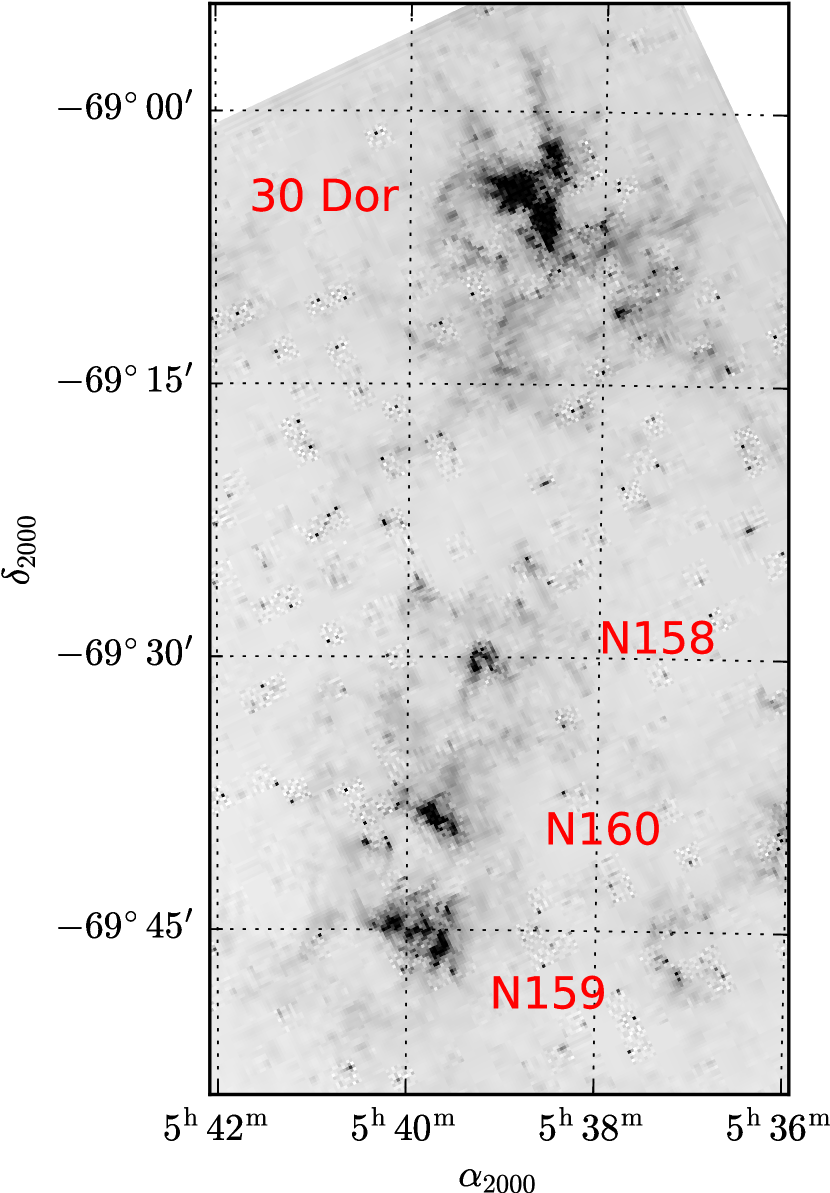
Several regions of massive star formation in the LMC that have been heavily studied are the H II region complexes stretching south from 30 Doradus. From north to south, these are commonly referred to as N158, N160, and N159 (see Figure 1). N159 hosts the first extragalactic “protostars” (P1, Gatley et al. 1981; and P2, Jones et al. 1986), the first extragalactic Type I OH maser (Caswell & Haynes, 1981), and an H2O maser (Scalise & Braz, 1981)—all indicators of recent star formation. N159 lies on a peak in the CO distribution in the LMC, with another peak just south of N159, an area that has yet to form stars (Johansson et al., 1998; Jones et al., 2005; Mizuno et al., 2010). This complex has been extensively studied in the near-infrared (NIR) with the Spitzer Space Telescope (Jones et al., 2005; Indebetouw et al., 2008; Chen et al., 2010), in the far-infrared (FIR) and sub-mm using the ESA Herschel Space Observatory (Seale et al., 2014) and The Large Apex BOlometer CAmera (LABOCA; Galametz et al., 2013), and numerous other methods.
The complete absence of M supergiants indicates that, unlike in 30 Dor, star formation in N159 is very recent, with no significant epoch of star formation earlier than a few million years (McGregor & Hyland, 1981).
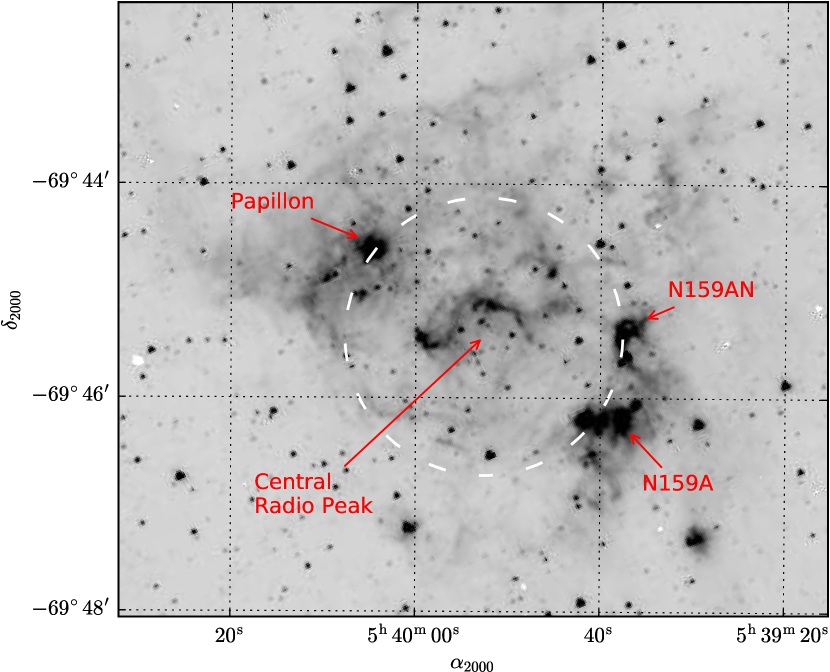
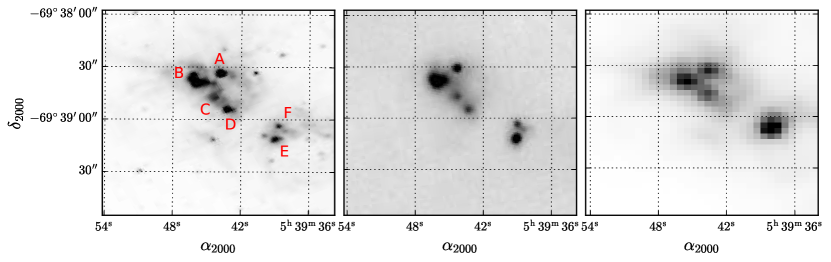
N159, presumably the youngest in the string, shows evidence for an internal triggered star formation event within the last 2 million years (Jones et al., 2005). Most Galactic H II regions tend to have dense luminous cores. N159, however, is composed of at least four H II regions separated from one another by 10–20 pc, each of which is roughly equivalent in luminosity to 3/4 of an M17 H II region (Kleinmann & Wright, 1973; Nielbock et al., 2001). These are the Papillon (N159-5; Heydari-Malayeri et al., 1999), N159A, N159AN, and the central radio peak, labeled in Figure 2.
The stellar population in N160 is even more evolved, with the parent molecular clouds cleared out by massive star formation (Oliveira et al., 2006; Galametz et al., 2013). Nakajima et al. (2005) showed that several optical stellar clusters and associations forming in both N159 and N160 were likely triggered by a supergiant shell, SGS 19, just northeast of N160. In this scenario, supported by HST imaging from Heydari-Malayeri et al. (2002) and spectroscopic observations from Fariña et al. (2009), star formation in both H II regions is stimulated by complex feedback interactions from 30 Doradus, SGS 19, and possibly from a nearby X-ray–emitting hot gas cloud ( K; Points et al., 2000) centered at (, )(05:41:50, -69:42:00) (Nakajima et al., 2005).
Recently, Bernard et al. (2016) conducted high spatial-resolution -band imaging of N159 with the Gemini South Adaptive Optics Imager (GSAOI; McGregor et al., 2004) on the Gemini Multi-conjugate adaptive optics System (GeMS; Rigaut et al., 2014; Neichel et al., 2014). They identified several infrared-bright sources, each active sites of massive star formation. In the NIR, these sources appear to be compact clusters, each hosting multiple components. However, they are unresolved in mid-infrared images. Spitzer observations from Chen et al. (2010) of N159 and N160 as well as the GeMS images from Bernard et al. (2016) of N159A both suggest that the stars present in each cluster are at different evolutionary stages. These clusters appear to host varied stellar populations of massive young stellar objects (YSOs) and main-sequence O- and B-type stars.
While the multiple sources in each compact cluster can be resolved in the optical and near-infrared, it is not possible to resolve these individual sources with Spitzer and Herschel mid- and far-infrared photometry due to the low spatial resolution at 24 µm and longer wavelengths. Galametz et al. (2013) showed that the unresolved sources in N159 and N160 imaged with Spitzer/MIPS (Rieke et al., 2004) and LABOCA with a large aperture radius (100″) are radiating strongly in the mid-IR (for N160: 145 Jy at 24 µm, 10 Jy at 100 µm). Spectral energy distributions (SEDs) constructed from this photometry can be questionable for unresolved multiple sources in the large aperture. However, the high-resolution images from Bernard et al. (2016) of sources in N159 reveal that the dominate component in the mid-infrared SEDs of the compact clusters is a single, massive YSO. Chen et al. (2010) suggest that, while the optical and near-infrared emission will by dominated by exposed stars and/or older protostars that have shed their dust envelopes, model fits to the mid-infrared SED will still provide valuable information on the single embedded YSO.
In this study, we present SEDs of the massive YSOs in the three star-forming regions, N159A, N159 Papillon, and N160. Using 25–37 µm FORCAST images from the NASA Stratospheric Observatory for Infrared Astronomy (SOFIA; Gehrz et al., 2009; Young et al., 2012) in combination with Spitzer/IRAC archive photometry from 3.6–8.5 µm and 100 µm data from Herschel/PACS, we conduct a census of the massive YSOs and their contribution to the total luminosity of the compact clusters in the mid- to far-infrared. Model fitting to the observed SEDs and analysis of color-magnitude diagrams enable us to characterize the luminosities, ages, and dust properties of the YSOs and their surrounding environments. Mid-infrared imaging with SOFIA reveals that there are no new, very cool, previously-undiscovered YSOs present in the three H II regions.
2 Observations
2.1 SOFIA/FORCAST
The N159A, N159 Papillon, and N160 fields were observed with SOFIA during missions OC3-D and F on June 19 and July 6, 2015, using the Faint Object infraRed CAmera for the SOFIA Telescope (FORCAST; Herter et al., 2012), which performs both imaging and spectroscopy from 5 to 40 µm. After post-processing, FORCAST yields a pixel scale of 0768 pix-1 providing a effective field-of-view and 3 to 35 spatial resolution.
We observed each of the three fields in three bands with effective wavelengths of 25.3, 31.5, and 37.1 µm. The data from each band were taken sequentially with a mirror in place of the dichroic, as single-channel observations provide higher throughput for each channel (see Herter et al. 2012 for a discussion of single/dual-channel mode). The bandpasses and total integration times for each filter are listed in Table 1.
The chopping secondary on SOFIA was configured for symmetric two-position chopping with nodding (C2N) with a chop throw of 4′ amplitude on the sky to cancel atmospheric emission and avoid nebulosity from the H II regions. The nod throw was performed parallel to the chop throw (NMC configuration), which places the array on blank sky (Herter et al., 2013). The data were calibrated and reduced with the FORCAST Redux pipeline software (v1.0.6; Clarke et al., 2015) at the SOFIA Science Center and released to the authors as level 3 results. The WCS plate solutions for the FORCAST images were recomputed using the IRAF CCMAP program to match the astrometry to the Spitzer/IRAC 3.6 µm images.
Image processing and aperture photometry was performed using the open-source Astropy (Astropy Collaboration et al., 2013)-affiliated photutils111photutils provides tools for detecting and measuring photometry of astronomical sources. The software is still in development with documentation available at https://photutils.readthedocs.io/. package. Apertures span 3 to 6″ for sources in the three fields, chosen to encompass the extended emission of each object. For adjacent sources with overlapping apertures, image masks were created from segmentation images generated by the photutils implementation of the SExtractor thresholding algorithm (Bertin & Arnouts, 1996). Background apertures were selected to represent the median nebulosity in each H II region and subtracted from each target aperture.
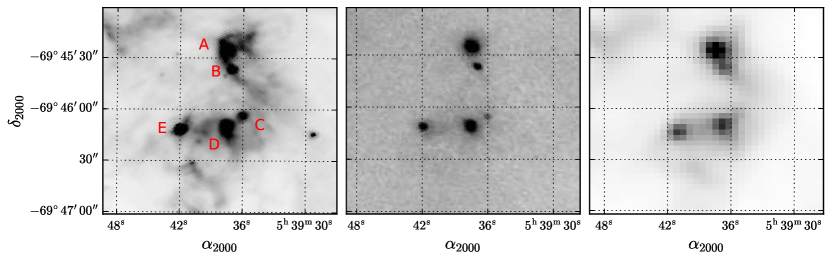
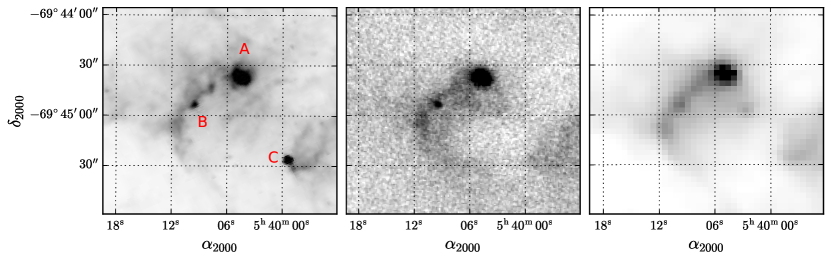
Sources in the FORCAST images were matched with point sources in Spitzer/IRAC images (see §2.2). Figures 3, 4, and 5 illustrate the sources analyzed in each cluster, labeled for matching to other figures and tables in this work. Coordinates and cross-identified names to other works can be found, along with the photometry, in Table 2. We note that there are no sources visible in the FORCAST 25–37 µm images that lack a near-infrared counterpart in the IRAC 3.6–8.0 µm images. As we discuss further in §4, this implies that there is no cooler, younger massive stellar population previously unaccounted for in any of the three H II regions.
| Field | Date | Exptime (s) | ||||
|---|---|---|---|---|---|---|
| N159A | 06/19/2015 | 05:39:40 | -69:45:45 | 25.3 | 1.9 | 420 |
| 31.5 | 5.7 | 440 | ||||
| 37.1 | 3.3 | 470 | ||||
| N159 Papillon | 06/19/2015 | 05:40:05 | -69:44:45 | 25.3 | 1.9 | 420 |
| 31.5 | 5.7 | 440 | ||||
| 37.1 | 3.3 | 470 | ||||
| N160 | 07/06/2015 | 05:39:45 | -69:38:30 | 25.3 | 1.9 | 520 |
| 31.5 | 5.7 | 560 | ||||
| 37.1 | 3.3 | 460 |
Note. — Filter parameters are from the SOFIA Observer’s Handbook. Exposure time is calculated as the total on-source integration time from the stacked C2NC2 images. On-source integration times for various observing strategies on FORCAST are discussed here: https://www.sofia.usra.edu/sites/default/files/FOR_Cyc_1_2_ExpTime.pdf.
2.2 Spitzer/IRAC
Observations were made in December 2004 using all four bands of the Infrared Array Camera (IRAC; Fazio et al., 2004) on the Spitzer Space Telescope (Werner et al., 2004; Gehrz et al., 2007) as part of a Guaranteed Time Observing Program (Program ID 124) conducted by Spitzer Science Working Group member R. D. Gehrz and his University of Minnesota team. Jones et al. (2005) processed each post-basic-calibrated data (PBCD) image through the Spitzer Science Center Legacy MOPEX pipeline, which provides point-spread function (PSF) and aperture photometry from the Astronomical Point Source Extraction (APEX) toolkit. For consistency with the SOFIA/FORCAST photometry, we have updated the PSF photometry from Jones et al. (2005) for the matching FORCAST sources, using the point-response-function (PRF) methods in photutils. The discrete PSFs for the images in the four IRAC bands were adapted from the -pixel sampled PRFs used by APEX.222Documentation on IRAC PSF/PRF available at http://irsa.ipac.caltech.edu/data/SPITZER/docs/irac/calibrationfiles/psfprf/.
The IRAC photometry is listed in Table 2. Note that the data presented for 2MASS -band through IRAC 8.0 µm is given in mJy, while the mid-infrared photometry is in Jy. We estimate the photometric error in the Spitzer/IRAC images to be based on RMS variation in the background. The positions listed in Table 2 for each object are calculated as the center-of-mass from 2D moments of the IRAC 3.6 µm images.
2.3 Herschel/PACS
We also include in our analysis the publicly-available 100 µm observations from the Herschel Space Observatory (Pilbratt et al., 2010) with the PACS instrument (Poglitsch et al., 2010) to constrain the Rayleigh-Jeans side of the thermal dust component of the SEDs. Observations were taken on 2010 Oct 05 as part of the HERschel Inventory of The Agents of Galaxy Evolution (HERITAGE) in the Magellanic Clouds open time key program (Meixner et al., 2013; Seale et al., 2014, Obs ID 1342202224). The Herschel Interactive Processing Environment (HIPE)333HIPE is a joint development by the Herschel Science Ground Segment Consortium, consisting of ESA, the NASA Herschel Science Center, and the HIFI, PACS, and SPIRE consortia. was used to download the images, but all processing and photometry was performed using photutils for consistency with the SOFIA and Spitzer data.
Since several of the unresolved sources in the 100 µm images are slightly overlapping, we cannot use segmentation maps as was done for the FORCAST images to perform photometry. Instead, we scale up the PSF images of Vesta provided with HIPE (FWHM ). Subtracting these scaled PSFs yields masked images with most of the target profile intact. PSF photometry was then performed on the resulting source profiles with the same Vesta PSFs. While this technique was successful for the brighter objects in the three H II regions, the Papillon sources and N160 D were too faint to yield meaningful PSF photometry. For these objects, we performed aperture photometry with 8” radius apertures. Comparing aperture and PSF photometric values requires a correction from “Encircled energy fraction” (EEF) curves.444Encircled energy diagrams, color-correction strategies, and calibration factors are discussed at http://herschel.esac.esa.int/twiki/pub/Public/PacsCalibrationWeb. For the chosen aperture size, the EEF correction is . The width of the PACS bandpasses also requires color corrections be applied to the 100 µm (green) images. Since we do not have mid-infrared spectra to convolve with the PACS response functions, we instead adopt color corrections based on the blackbody temperatures of the thermal dust component. For cool dust at 100 K, the peak of the SED will be at µm, corresponding to a color-correction calibration factor of 1.007 for the PACS green filter. We note that the color corrections for blackbody temperatures between 50 and 500 K vary only by a factor of .
2.4 2MASS
Jones et al. (2005) provides photometry from the Two Micron All Sky Survey (2MASS; Milligan et al., 1996) for several of the IRAC sources in N159. We adopt those values here, and include the 2MASS ID in Table 2 for the matching sources. For all other sources in N159, and every source in N160, if a match was not found in the 2MASS Point Source Catalog (Skrutskie et al., 2006) within 05 of the position measured in the IRAC images, we download Atlas Images from the Infrared Science Archive (IRSA; Berriman, 2008) in the three survey bands. As was done for the SOFIA/FORCAST images, image masks were created from segmentation images, background nebulosity was measured near each source, and aperture photometry was performed with radii spanning 3 to 6″, chosen to encompass the extended emission from each object. While aperture photometry performed here is not necessarily consistent with the profile-fit photometry for sources in the 2MASS Point Source Catalog,555See discussion on aperture vs. profile-fit photometry and curve-of-growth corrections in the IRSA documentation at http://www.ipac.caltech.edu/2mass/releases/allsky/doc/sec4_4c.html. the YSO age and dust properties are primarily constrained by the mid-infrared flux. As discussed in §3, our analysis of the SEDs is largely restricted to the mid-infrared colors (FORCAST 25.3–37.1 µm) and PACS 100 µm photometry. Any uncertainty in the near-infrared 2MASS photometry will have little impact on the results presented here.
While several of our sources have WISE (Wright et al., 2010) photometry, the angular resolution of 6 to 12″ for the WISE bands presents issues with spatially resolving, and cross-identifying, the YSOs in the three crowded fields. Thus, we do not include WISE in our analysis.
| Source | 2MASS ID | Other ID666Sources labeled C2–C5 in N159A are identified as compact clusters in Bernard et al. (2016). N159A A and N160 A are in Seale et al. (2014) (see §2.3). N160 sources are matched to sources in Heydari-Malayeri et al. (2002). | 777: 2MASS | 3.68883.6–8.0 µm: Spitzer/IRAC | 4.5 | 5.8 | 8.0 | 25.399925.3–37.1 µm: SOFIA/FORCAST | 31.5 | 37.1 | 100101010100 µm: Herschel/PACS 1010footnotetext: | ||||
| [mJy] | [mJy] | [mJy] | [mJy] | [mJy] | [mJy] | [mJy] | [Jy] | [Jy] | [Jy] | [Jy] | |||||
| N159A | |||||||||||||||
| A | C5, J84.905917-69.757105 | 05:39:37.44 | -69:45:25.5 | 11.75 | 23.54 | 71.88 | 217.39 | 12.09 | 27.31 | 40.89 | 149.14 | ||||
| B | 05393712-6945370 | 05:39:37.03 | -69:45:36.7 | 0.96 | 2.04 | 1.35 | 7.46 | 18.48 | 41.84 | 61.26 | 2.85 | 7.38 | 9.62 | 58.93 | |
| C | 05393608-6946039 | DCL 240, C4 | 05:39:35.97 | -69:46:04.2 | 0.97 | 1.78 | 2.65 | 8.69 | 8.51 | 31.56 | 68.34 | 2.43 | 3.97 | 4.42 | 28.06 |
| D | C3 | 05:39:37.56 | -69:46:09.3 | 17.51 | 22.65 | 81.56 | 256.64 | 10.08 | 18.32 | 24.65 | 99.53 | ||||
| E | 05394188-6946122 | P2, C2 | 05:39:41.80 | -69:46:11.9 | 1.22 | 2.48 | 9.12 | 43.71 | 78.13 | 154.49 | 232.54 | 3.48 | 6.75 | 9.07 | 76.5 |
| N159 Papillon | |||||||||||||||
| A | 05400448-6944375 | MSX6C, M371 | 05:40:04.34 | -69:44:37.3 | 6.35 | 7.15 | 13.55 | 59.06 | 69.2 | 284.78 | 900.28 | 11.06 | 19.39 | 28.44 | 9.22 |
| B | 05:40:09.43 | -69:44:53.9 | 5.52 | 3.67 | 25.62 | 65.05 | 0.50 | 1.29 | 2.20 | 1.26 | |||||
| C | 05395936-6945263 | P1, M210 | 05:39:59.32 | -69:45:26.4 | 0.42 | 2.64 | 12.24 | 47.11 | 59.60 | 90.72 | 140.06 | 0.28 | |||
| N160 | |||||||||||||||
| A | J84.932653-69.642627, H46-48 | 05:39:43.78 | -69:38:33.4 | 44.98 | 125.64 | 230.77 | 283.14 | 10.34 | 20.30 | 29.71 | 23.02 | ||||
| B | H56, H58 | 05:39:46.00 | -69:38:38.9 | 20.83 | 20.46 | 31.90 | 59.68 | 87.31 | 230.05 | 600.17 | 38.99 | 69.98 | 97.46 | 40.64 | |
| C | H36, H41 | 05:39:44.40 | -69:38:47.4 | 9.14 | 31.70 | 140.40 | 477.1 | 7.45 | 12.32 | 17.27 | 20.41 | ||||
| D | H35 | 05:39:43.19 | -69:38:53.9 | 17.71 | 13.38 | 20.22 | 34.58 | 68.84 | 189.28 | 593.95 | 10.76 | 14.73 | 18.75 | 6.97 | |
| E | H24 | 05:39:38.99 | -69:39:11.7 | 2.45 | 5.51 | 7.21 | 24.65 | 27.86 | 140.24 | 380.45 | 9.91 | 21.59 | 34.51 | 19.73 | |
| F | 05:39:38.70 | -69:39:04.0 | 0.49 | 2.22 | 17.20 | 15.99 | 116.55 | 339.00 | 4.65 | 8.21 | 12.46 | ||||
3 Spectral Energy Distributions and YSO Modeling
To derive the characteristics of the resolved YSOs in the FORCAST images, we use the 2D radiative transfer YSO model grid from Robitaille et al. (2007) and their SED fitter tool to determine physical parameters of YSOs from available photometry data from 2MASS -band through Herschel/PACS 100 µm. The models assume an accretion scenario for the star-formation process, where the central source is surrounded by a dusty accretion disk, an infalling flattened envelope, and the presence of bipolar cavities. We have used the command-line version of the SED fitting tool, which finds the best fitting SED (minimizing per photometric point) from precomputed models.111111Python port of the original Fortran SED fitter code (Robitaille et al., 2007) found at http://sedfitter.readthedocs.org/.
The model inputs include distance to the source, approximate foreground visual extinction (AV), the flux in each passband, and an estimate of photometric error for each filter. For the FORCAST and PACS filters, we convolve all of the precomputed models with normalized filter response functions to extend the SED fitting tool out to 100 µm. While AV can be left as a completely free parameter, we set a lower-limit of A mag, based on the Jones et al. (2005) discussion of H obscuration in N159AN. We assume no significant variation in foreground extinction across the H II regions, and we note that this assumption will have no impact on the SED fitting in the mid- to far-infrared where the extinction is very low.
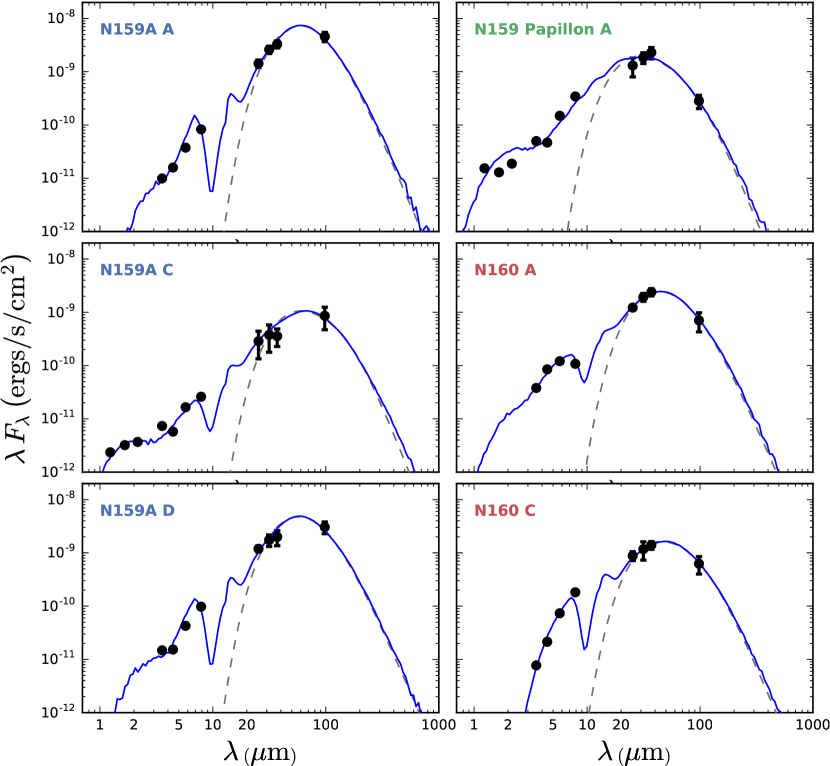
The output parameters from the model fitting are summarized in Table 3, and the best-fitting SEDs for selected sources in all three clusters plotted are plotted in Figure 6. Although the model SEDs are consistent with the observed flux densities, we note that the derived parameters must be treated with caution. PAH and small-grain thermal emission, which are strong sources of mid-infrared flux in YSOs with hot stellar sources (Robitaille et al., 2006; Seale et al., 2009; Nandakumar et al., 2016), are absent in the synthetic SEDs. Considering that the FORCAST 25–37 µm fluxes are the primary constraint for the models, the insufficient treatment of PAH emission creates some uncertainty in the shape of the SEDs in the mid-infrared.
Additionally, the precomputed YSO models assume that massive YSOs are simply scaled-up versions of their lower mass counterparts. The radii, temperatures, and ages are derived from pre-main sequence isochrones formulated from models of low- to intermediate-mass stars by Siess et al. (2000), not from isochrones that apply to the potentially massive YSOs embedded in the LMC H II regions. The Siess et al. (2000) isochrones and evolutionary tracks can differ significantly from the Geneva group evolutionary models of massive stars (Charbonnel et al., 1999; Ekström et al., 2012), particularly for isochrones less than years—a timescale comparable to the lifetimes of many high-mass stars. For example, though the SED modeling predicts an age of only years for cluster N159A, we would have expected ages between 0.1–0.5 Myrs based on their far-infrared colors and location on the color-magnitude diagram (see §4.1; Figures 7 and 8). As Siess (2001) describes in a review of his earlier work on pre-main sequence evolutionary tracks (Siess et al. 2000; the isochrones used by the Robitaille et al. 2007 models), much of the uncertainty in YSO ages stems from ambiguity in assigning “time zero” to the models, as well as treatment of rotation and convection in the stellar evolution code. Even modest uncertainty in metallicity, luminosity, and temperature can have a significant impact on the derived ages, with age estimates varying by a factor of 2 to 4 for stars younger than 1–2 Myrs (Siess, 2001). Therefore, we present the model ages in Table 3 with some caution.
To characterize the thermal dust emission, we fit a gray body spectrum to the mid- to far-infrared photometry following the SED modeling by Rathborne et al. (2010) of protostellar cores. The emissivity is characterized by a power-law dependence . While Jones et al. (2016) find a good fit for for two Galactic YSOs embedded in an infrared dark cloud, we find values of of 1.8 for sources in N159 and and 2.0 for those in N160. These emissivity parameters are consistent with the range of between 1.6 and 2.1 for the embedded cores in Rathborne et al. (2010). In Figure 6 we show the gray body fits as gray dashed lines, where the fitting was restricted to to fit only the long-wavelength thermal dust component, along with the full YSO model SEDs in blue. The average dust temperatures for sources in N159A, N159 Papillon, and N160 are , 100, and 90 K, respectively. The best-fitting dust temperatures for individual sources are included in Table 3.
| Source | Mean Fgd AVaaExtinction in the foreground of the models averaged by cluster. | Mean Age | bbOptical depth at 2.2 µm inside the model down to the stellar surface, assuming Indebetouw et al. (2005) extinction. | L⋆ | T⋆ | TdustccDust temperatures calculated from fitting modified gray bodies ( for N159, 2.0 for N160) to fluxes for µm (see Figure 6 and §3). | Mdisk | |
|---|---|---|---|---|---|---|---|---|
| [mag] | [yr] | [L⊙] | [K] | [K] | [M⊙] | [M⊙/yr] | ||
| N159A | 7.4 | |||||||
| A | 31.6 | 60 | ||||||
| B | 19.4 | 57 | ||||||
| C | 17.0 | 61 | ||||||
| D | 21.5 | 63 | ||||||
| E | 13.6 | 66 | ||||||
| N159 Papillon | 6.1 | |||||||
| A | 21.1 | 123 | ||||||
| B | 31.9 | 105 | ||||||
| C | 8.1 | 92 | ||||||
| N160 | 4.4 | |||||||
| A | 10.1 | 84 | ||||||
| B | 37.2 | 96 | ||||||
| C | 5.6 | 80 | ||||||
| D | 74.6 | |||||||
| E | 13.6 | 90 | ||||||
| F | 84.8 |
4 Discussion
4.1 Color-Magnitude Diagram
For the SEDs in Figure 6, we note a rise in energy from the FORCAST photometry (20–40 µm) out to 100 µm in the N159A sources. In the other two clusters, the SEDs appear to peak at shorter wavelengths. To explore this color difference among the clusters, we plot the far-infrared colors of the YSOs in each cluster against their bolometric luminosities on the color-magnitude diagram in Figure 7. Based on the fitting parameters in Table 3, the color difference between 31.5 and 100 µm suggests that the younger YSOs in N159A are young enough to have retained much of their cooler gas and dust envelopes. Therefore, the cooler thermal dust component dominates the mid- to far-infrared emission, which makes the sources in N159A appear redder. The older YSOs in N160 have shed their outer envelopes, revealing the warmer stellar cores. The temperature scale shown in Figure 7 is a rough correlation between the color and the dust temperatures found from the gray-body fitting discussed in §3. Discussed further in §4.2, the warm temperatures for the two Papillon sources is likely a result of internal triggered star formation in N159.
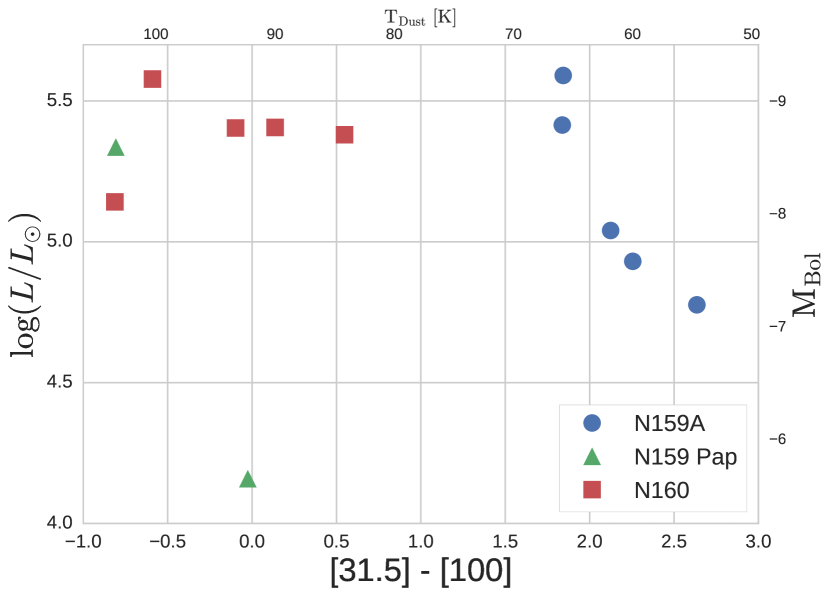
The luminosities in Figure 7 are calculated by integrating the SED model fits from the near- to far-infrared. This treatment of the broadband photometry implies that the H II regions are composed of singular, infrared-bright sources. However, the high-resolution images from Bernard et al. (2016) and Spitzer observations from Chen et al. (2010) indicate that each infrared source is actually a compact cluster, hosting as many as 12 stars in the case of C4 (here, identified as N159A C in Figure 3). Since Bernard et al. (2016) showed that the sources follow a distribution in ages, the mid- to far-infrared emission will be dominated by one, or at most two, embedded YSOs. The optical to near-infrared photometry may be contaminated by unobscured stars in addition to YSOs that have shed their dust envelopes. Thus, the model fits to the FORCAST and PACS photometry in the mid- to far-infrared will more accurately reflect the properties of a single massive YSO, with the caveat that the near-infrared fluxes may contain contributions from several sources. Regardless, the bolometric luminosities in Figure 7, as well as the color, should be unaffected by multiplicity, as the SEDs in Figure 6 indicate that little energy is radiated in the near-infrared relative to the thermal dust emission at wavelengths greater than 20 µm.
Two sources in the Papillon have the same color temperature as those in N160, as well as similar dust temperatures of K according to the thermal dust fitting in Figure 6. The third source in the Papillon (labeled C in Figure 4 and the tables) is P1 in Gatley et al. (1981) and was postulated by Jones et al. (2005) as a Class I YSO. However, with no mid-infrared emission detectable in the FORCAST 31.5 and 37.1 µm images, P1 is most likely not a YSO. As suggested in Jones et al. (2005), it may instead be a carbon star. If true, P2 (here, N159A source E), discovered by Jones et al. (1986), would then be the first extragalactic protostar discovered. P2 is in Bernard et al. (2016) compact cluster C2, which GeMS images revealed to contain two red sources. Chen et al. (2010) identify a Class I/II YSO at this location (object 053941.89–694612.0), which they suggest may have multiple components; however, they note that only one source is likely dominating the emission in the mid-infrared (source 123 from Testor et al., 2006, with VLT/NACO observations).
Due to deep obscuration in the optical and near-infrared, Bernard et al. (2016) could not resolve any stars in their compact cluster C5 (here, N159A source A). However, Chen et al. (2010) identify an embedded YSO, object 053937.56–694525.4, which they determine is a Class I with an inferred spectral type of O6 V based on its luminosity from SED fitting. More recently, Fukui et al. (2015) detected a complex filamentary structure of dense CO gas using ALMA at this location, and conclude that their YSO-N is Class 0/I with a mass of .
4.2 Color-Color Diagram
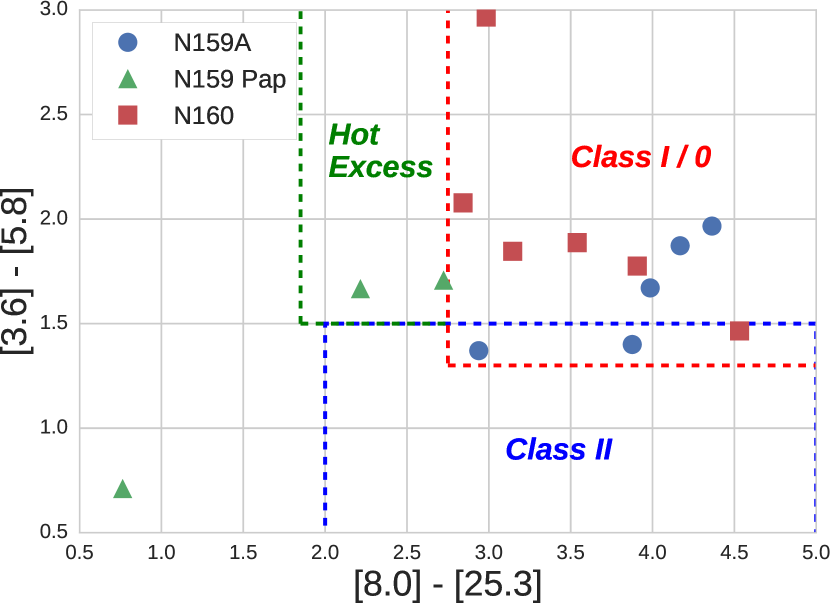
As discussed in §3, the ages derived from the SED fitting can be somewhat questionable for these high-mass protostars. Rather than definitively categorizing these sources based on model ages, we instead place them on a color-color diagram to qualitatively study the YSOs by H II region. In Figure 8, we plot sources by IRAC and FORCAST colors, with the YSO classification scheme from Reach et al. (2004) and Rho et al. (2006). While Reach et al. (2004) originally generated the Class 0/I and II regions based on Spitzer/MIPS 24 µm photometry, we substitute the FORCAST 25.3 µm data since MIPS lacked the spatial resolution for our cluster sources. The MIPS 24 µm filter is wider than the FORCAST filter suite,121212MIPS spectral response falls to 50% beyond 26 µm. so we note that this color substitution is justified for comparison to previous work. In this color-color space, main-sequence stars or unobscured photospheres would fall near the lower-left (). Class 0 to Class I protostars are the reddest sources, with a rise in their SEDs through the mid-infrared due to cool thermal dust emission. Class II YSOs, generally young objects with disks, will show an infrared excess relative to stellar photospheres in the near-infrared as they have not yet completely shed their outer envelopes. Since the foreground extinction in the near-infrared is not well measured, the classification of sources near the boundary between the two marked regions in Figure 8 is uncertain.
Rho et al. (2006) suggest three mechanisms for producing the “hot excess” region of their color-color diagram. These sources could be pre-main sequence Herbig Ae/Be stars with hot circumstellar dust creating an IR excess (as opposed to post-main sequence classical Be stars whose near-infrared excess is due to free-free emission). Indeed, Indebetouw et al. (2004) and Nakajima et al. (2005) identified several objects in the N159/N160 as Herbig Ae/Be stars, including one object in N159A C (C4 in Bernard et al. 2016, 053935.99–694604.1 in Chen et al. 2010), based on the Spitzer/IRAC colors.
Alternatively, Rho et al. (2006) propose “hot excess” protostars as Class 0/I YSOs with more active accretion than is typical, which would produce a brighter, hot component ( K) in the near-infrared SED. However, the derived YSO parameters in Table 3 from SED fitting suggest that while the Papillon sources have a higher disk mass than those in N159A, the masses and accretion rates are consistent with sources in N160, which do not appear as “hot excess” sources in the color-color diagram.
Finally, Rho et al. (2006) suggest a possible connection between the “hot excess” and star-forming environments in high UV radiation fields. While Rho et al. (2006) were studying Galactic YSOs in the Trifid Nebula (M20), Heydari-Malayeri et al. (1999) discovered that YSOs in the Papillon (and in N160; Heydari-Malayeri et al., 2002) were embedded in what they call high-excitation blobs (HEBs). HEBs are characterized by large [O III] /H line ratios, which suggest a hard radiation field capable of doubly-ionizing almost all the oxygen atoms in the Papillon (Heydari-Malayeri et al., 1999). With relatively high foreground extinction in the direction of the Papillon (), the gas and dust surrounding the embedded protostars is at a high enough density to prevent UV leakage, which implies that the H II region is thermalizing its UV radiation field. This energy would appear as a hot excess in the near-infrared SEDs of the YSOs, driving these sources to the left in Figure 8.
5 Conclusions
In this study we have provided a census of extremely young, luminous YSOs in three LMC H II regions. From 25–37 µm imaging with SOFIA/FORCAST and near-infrared observations with Spitzer/IRAC and 2MASS, to the far-infrared with Herschel/PACS, we construct SEDs for each of the massive YSO candidates in N159A, N160, and the Papillon. While the isochrones used by the Robitaille et al. (2007) YSO models provide uncertain ages for massive stars, the positions of the YSOs on the far-infrared color-magnitude diagram indicate increased dust obscuration in N159A sources, which implies that N159A is indeed younger than N160.
The Papillon, containing sources with a hotter color and infrared excess in the IRAC bands, is consistent with the Heydari-Malayeri et al. (1999) description of a high-excitation blob in a hard radiation field. This scenario is supported in the models: the dust temperatures and larger disk mass estimated from the model fitting and the warmer dust temperatures from the gray-body fitting suggest that the Papillon YSOs have shed some portion of their outer dust envelopes. The exposed, hotter disk components dominate the mid-infrared SEDs of the Papillon sources.
We note that the near-infrared photometry is possibly contaminated by other stars in the compact clusters. While the far-infrared color used in the color-magnitude diagram in Figure 7 is diagnostically useful for characterizing a single YSO in each cluster, the IRAC colors in Figure 8 should be viewed with caution. The Galactic YSOs observed by Reach et al. (2004) and Rho et al. (2006) were spatially resolved as single objects, and so applying their near-infrared color criteria and classification scheme to sources with possible multiplicity is uncertain.
The spatial resolution of FORCAST in the mid-infrared nonetheless provides a complete catalog of embedded protostars in these LMC H II regions. Since each object in the FORCAST images has an obvious bright near-infrared counterpart in Spitzer, we do not find any evidence for new, very cool, undiscovered Class 0 YSOs. The SOFIA/FORCAST observations support the conclusions from Chen et al. (2010) and Bernard et al. (2016) that only one massive YSO is present in each compact cluster, and that this single object dominates the mid- to far-infared component of the SED.
Finally, we conclude that since P1 is lacking a cold dust envelope, it is likely not a YSO, and perhaps a carbon star as suggested in Jones et al. (2005). This observation would make P2 the first extragalactic protostar to have been discovered by Jones et al. (1986).
We note that N158, the northernmost and oldest region in the string of LMC star-forming environments, is potentially evolved enough to have triggered a significant second generation of massive stars. Mid-infrared observations of this H II region will be discussed in Paper II of this series.
References
- Allen et al. (2007) Allen, L., Megeath, S. T., Gutermuth, R., et al. 2007, Protostars and Planets V, 361
- Astropy Collaboration et al. (2013) Astropy Collaboration, Robitaille, T. P., Tollerud, E. J., et al. 2013, A&A, 558, A33
- Barbá & Rubio (2002) Barbá, R. H., & Rubio, M. 2002, in IAU Symposium, Vol. 207, Extragalactic Star Clusters, ed. D. P. Geisler, E. K. Grebel, & D. Minniti, 199
- Bernard et al. (2016) Bernard, A., Neichel, B., Samal, M. R., et al. 2016, ArXiv e-prints, arXiv:1605.07846
- Berriman (2008) Berriman, G. B. 2008, in Proc. SPIE, Vol. 7016, Observatory Operations: Strategies, Processes, and Systems II, 701618
- Bertin & Arnouts (1996) Bertin, E., & Arnouts, S. 1996, A&AS, 117, 393
- Caswell & Haynes (1981) Caswell, J. L., & Haynes, R. F. 1981, MNRAS, 194, 33P
- Charbonnel et al. (1999) Charbonnel, C., Däppen, W., Schaerer, D., et al. 1999, A&AS, 135, 405
- Chen et al. (2010) Chen, C.-H. R., Indebetouw, R., Chu, Y.-H., et al. 2010, ApJ, 721, 1206
- Clarke et al. (2015) Clarke, M., Vacca, W. D., & Shuping, R. Y. 2015, in Astronomical Society of the Pacific Conference Series, Vol. 495, Astronomical Data Analysis Software an Systems XXIV (ADASS XXIV), ed. A. R. Taylor & E. Rosolowsky, 355
- Dale et al. (2013a) Dale, J. E., Ercolano, B., & Bonnell, I. A. 2013a, MNRAS, 430, 234
- Dale et al. (2013b) Dale, J. E., Ngoumou, J., Ercolano, B., & Bonnell, I. A. 2013b, MNRAS, 436, 3430
- de Boer et al. (1998) de Boer, K. S., Braun, J. M., Vallenari, A., & Mebold, U. 1998, A&A, 329, L49
- Ekström et al. (2012) Ekström, S., Georgy, C., Eggenberger, P., et al. 2012, A&A, 537, A146
- Fariña et al. (2009) Fariña, C., Bosch, G. L., Morrell, N. I., Barbá, R. H., & Walborn, N. R. 2009, AJ, 138, 510
- Fazio et al. (2004) Fazio, G. G., Hora, J. L., Allen, L. E., et al. 2004, ApJS, 154, 10
- Fukui et al. (2015) Fukui, Y., Harada, R., Tokuda, K., et al. 2015, ApJ, 807, L4
- Galametz et al. (2009) Galametz, M., Madden, S., Galliano, F., et al. 2009, A&A, 508, 645
- Galametz et al. (2013) Galametz, M., Hony, S., Galliano, F., et al. 2013, MNRAS, 431, 1596
- Gatley et al. (1981) Gatley, I., Becklin, E. E., Hyland, A. R., & Jones, T. J. 1981, MNRAS, 197, 17P
- Gehrz et al. (2009) Gehrz, R. D., Becklin, E. E., de Pater, I., et al. 2009, Advances in Space Research, 44, 413
- Gehrz et al. (2007) Gehrz, R. D., Roellig, T. L., Werner, M. W., et al. 2007, Review of Scientific Instruments, 78, 011302
- Herter et al. (2012) Herter, T. L., Adams, J. D., De Buizer, J. M., et al. 2012, ApJ, 749, L18
- Herter et al. (2013) Herter, T. L., Vacca, W. D., Adams, J. D., et al. 2013, PASP, 125, 1393
- Heydari-Malayeri et al. (2002) Heydari-Malayeri, M., Charmandaris, V., Deharveng, L., et al. 2002, A&A, 381, 941
- Heydari-Malayeri et al. (1999) Heydari-Malayeri, M., Rosa, M. R., Charmandaris, V., Deharveng, L., & Zinnecker, H. 1999, A&A, 352, 665
- Ikeda et al. (2008) Ikeda, H., Sugitani, K., Watanabe, M., et al. 2008, AJ, 135, 2323
- Indebetouw et al. (2004) Indebetouw, R., Johnson, K. E., & Conti, P. 2004, AJ, 128, 2206
- Indebetouw et al. (2005) Indebetouw, R., Mathis, J. S., Babler, B. L., et al. 2005, ApJ, 619, 931
- Indebetouw et al. (2008) Indebetouw, R., Whitney, B. A., Kawamura, A., et al. 2008, AJ, 136, 1442
- Johansson et al. (1998) Johansson, L. E. B., Greve, A., Booth, R. S., et al. 1998, A&A, 331, 857
- Jones et al. (2016) Jones, T. J., Gordon, M., Shenoy, D., et al. 2016, AJ, 151, 156
- Jones et al. (1986) Jones, T. J., Hyland, A. R., Straw, S., et al. 1986, MNRAS, 219, 603
- Jones et al. (2005) Jones, T. J., Woodward, C. E., Boyer, M. L., Gehrz, R. D., & Polomski, E. 2005, ApJ, 620, 731
- Kleinmann & Wright (1973) Kleinmann, D. E., & Wright, E. L. 1973, ApJ, 185, L131
- Ma et al. (2013) Ma, B., Tan, J. C., & Barnes, P. J. 2013, ApJ, 779, 79
- McGregor et al. (2004) McGregor, P., Hart, J., Stevanovic, D., et al. 2004, in Proc. SPIE, Vol. 5492, Ground-based Instrumentation for Astronomy, ed. A. F. M. Moorwood & M. Iye, 1033–1044
- McGregor & Hyland (1981) McGregor, P. J., & Hyland, A. R. 1981, ApJ, 250, 116
- Meixner et al. (2013) Meixner, M., Panuzzo, P., Roman-Duval, J., et al. 2013, AJ, 146, 62
- Meynadier et al. (2004) Meynadier, F., Heydari-Malayeri, M., Deharveng, L., et al. 2004, A&A, 422, 129
- Milligan et al. (1996) Milligan, S., Cranton, B. W., & Skrutskie, M. F. 1996, in Proc. SPIE, Vol. 2863, Current Developments in Optical Design and Engineering VI, ed. R. E. Fischer & W. J. Smith, 2–13
- Mills & Turtle (1984) Mills, B. Y., & Turtle, A. J. 1984, in IAU Symposium, Vol. 108, Structure and Evolution of the Magellanic Clouds, ed. S. van den Bergh & K. S. D. de Boer, 283–290
- Mizuno et al. (2010) Mizuno, Y., Kawamura, A., Onishi, T., et al. 2010, PASJ, 62, 51
- Nakajima et al. (2005) Nakajima, Y., Kato, D., Nagata, T., et al. 2005, AJ, 129, 776
- Nandakumar et al. (2016) Nandakumar, G., Veena, V. S., Vig, S., et al. 2016, ArXiv e-prints, arXiv:1607.01267
- Neichel et al. (2014) Neichel, B., Rigaut, F., Vidal, F., et al. 2014, MNRAS, 440, 1002
- Nielbock et al. (2001) Nielbock, M., Chini, R., Jütte, M., & Manthey, E. 2001, A&A, 377, 273
- Oliveira et al. (2006) Oliveira, J. M., van Loon, J. T., Stanimirović, S., & Zijlstra, A. A. 2006, MNRAS, 372, 1509
- Panwar et al. (2014) Panwar, N., Chen, W. P., Pandey, A. K., et al. 2014, MNRAS, 443, 1614
- Pilbratt et al. (2010) Pilbratt, G. L., Riedinger, J. R., Passvogel, T., et al. 2010, A&A, 518, L1
- Poglitsch et al. (2010) Poglitsch, A., Waelkens, C., Geis, N., et al. 2010, A&A, 518, L2
- Points et al. (2000) Points, S. D., Chu, Y.-H., Snowden, S. L., & Staveley-Smith, L. 2000, ApJ, 545, 827
- Rathborne et al. (2010) Rathborne, J. M., Jackson, J. M., Chambers, E. T., et al. 2010, ApJ, 715, 310
- Reach et al. (2004) Reach, W. T., Rho, J., Young, E., et al. 2004, ApJS, 154, 385
- Rho et al. (2006) Rho, J., Reach, W. T., Lefloch, B., & Fazio, G. G. 2006, ApJ, 643, 965
- Rieke et al. (2004) Rieke, G. H., Young, E. T., Cadien, J., et al. 2004, in Proc. SPIE, Vol. 5487, Optical, Infrared, and Millimeter Space Telescopes, ed. J. C. Mather, 50–61
- Rigaut et al. (2014) Rigaut, F., Neichel, B., Boccas, M., et al. 2014, MNRAS, 437, 2361
- Robitaille et al. (2007) Robitaille, T. P., Whitney, B. A., Indebetouw, R., & Wood, K. 2007, ApJS, 169, 328
- Robitaille et al. (2006) Robitaille, T. P., Whitney, B. A., Indebetouw, R., Wood, K., & Denzmore, P. 2006, ApJS, 167, 256
- Scalise & Braz (1981) Scalise, Jr., E., & Braz, M. A. 1981, Nature, 290, 36
- Seale et al. (2009) Seale, J. P., Looney, L. W., Chu, Y.-H., et al. 2009, ApJ, 699, 150
- Seale et al. (2014) Seale, J. P., Meixner, M., Sewiło, M., et al. 2014, AJ, 148, 124
- Siess (2001) Siess, L. 2001, in Astronomical Society of the Pacific Conference Series, Vol. 243, From Darkness to Light: Origin and Evolution of Young Stellar Clusters, ed. T. Montmerle & P. André, 581
- Siess et al. (2000) Siess, L., Dufour, E., & Forestini, M. 2000, A&A, 358, 593
- Skrutskie et al. (2006) Skrutskie, M. F., Cutri, R. M., Stiening, R., et al. 2006, AJ, 131, 1163
- Testor et al. (2006) Testor, G., Lemaire, J. L., Field, D., & Diana, S. 2006, A&A, 453, 517
- Testor & Niemela (1998) Testor, G., & Niemela, V. 1998, A&AS, 130, 527
- Werner et al. (2004) Werner, M. W., Roellig, T. L., Low, F. J., et al. 2004, ApJS, 154, 1
- Whitney et al. (2013) Whitney, B. A., Robitaille, T. P., Bjorkman, J. E., et al. 2013, ApJS, 207, 30
- Wright et al. (2010) Wright, E. L., Eisenhardt, P. R. M., Mainzer, A. K., et al. 2010, AJ, 140, 1868
- Young et al. (2012) Young, E. T., Becklin, E. E., Marcum, P. M., et al. 2012, ApJ, 749, L17