Operationalised Product Quality Models and Assessment:
The Quamoco Approach
Abstract
Context: Software quality models provide either abstract quality characteristics or concrete quality measurements; there is no seamless integration of these two aspects. Quality assessment approaches are, hence, also very specific or remain abstract. Reasons for this include the complexity of quality and the various quality profiles in different domains which make it difficult to build operationalised quality models.
Objective: In the project Quamoco, we developed a comprehensive approach aimed at closing this gap.
Method: The project combined constructive research, which involved a broad range of quality experts from academia and industry in workshops, sprint work and reviews, with empirical studies. All deliverables within the project were peer-reviewed by two project members from a different area. Most deliverables were developed in two or three iterations and underwent an evaluation.
Results: We contribute a comprehensive quality modelling and assessment approach: (1) A meta quality model defines the structure of operationalised quality models. It includes the concept of a product factor, which bridges the gap between concrete measurements and abstract quality aspects, and allows modularisation to create modules for specific domains. (2) A largely technology-independent base quality model reduces the effort and complexity of building quality models for specific domains. For Java and C# systems, we refined it with about 300 concrete product factors and 500 measures. (3) A concrete and comprehensive quality assessment approach makes use of the concepts in the meta-model. (4) An empirical evaluation of the above results using real-world software systems showed: (a) The assessment results using the base model largely match the expectations of experts for the corresponding systems. (b) The approach and models are well understood by practitioners and considered to be both consistent and well suited for getting an overall view on the quality of a software product. The validity of the base quality model could not be shown conclusively, however. (5) The extensive, open-source tool support is in a mature state. (6) The model for embedded software systems is a proof-of-concept for domain-specific quality models.
Conclusion: We provide a broad basis for the development and application of quality models in industrial practice as well as a basis for further extension, validation and comparison with other approaches in research.
keywords:
Quality Model , Product Quality , Quality Assessment1 Introduction
Despite great efforts in both research and practice, software quality continues to be controversial and insufficiently understood, and the quality of software products is often unsatisfactory. The economic impact is enormous and includes not only spectacular failures of software [49] but also increased maintenance costs [39], high resource consumption, long test cycles, and waiting times for users.
1.1 Quality Models – Benefits and Shortcomings
Software quality models tackle the issues described above by providing a systematic approach for modelling quality requirements, analysing and monitoring quality, and directing quality improvement measures [21]. They thus allow ensuring quality early in the development process.
In practice, however, a gap remains between the abstract quality characteristics described in quality models such as the current standard ISO/IEC 25010 [36] and concrete measurements and assessments [77, 1]. The quality models describe and structure general concepts that can be used to characterise software quality. Most of them, however, cannot be used for real-world quality assessment or improvement [1]. Concrete measurements, on the contrary, often lack the connection to higher-level quality goals. Thus, they make it difficult to explain the importance of quality problems to developers or sponsors and to quantify the potential of quality improvements.
A similar gap also exists for quality assessment methods. Effective quality management requires not only a definition of quality but also a method for assessing the overall quality of a software product based on measured properties. Existing quality models either lack assessment support completely or provide procedures that are too abstract to be operational (e. g. ISO/IEC 25040 [37]). As a consequence, quality assessment is inhibited and likely to produce inconsistent and misleading results.
Finally, the contents of many existing quality models (including quality metrics or evaluation formulas) are invariable. Software quality, however, is not the same in all contexts. It depends on the domain, on the technology used and on project constraints. Most quality engineers want to adapt and customise their quality models [77].
1.2 Research Objective
Our aim was to develop and validate operationalised quality models for software together with a quality assessment method and tool support to provide the missing connections between generic descriptions of software quality characteristics and specific software analysis and measurement approaches. As a single operationalised quality model that fits all peculiarities of every software domain would be extremely large and expensive to develop, we also set the goal of enabling modularised quality models with a widely applicable base model and various specific extensions. This also constrained the types of analyses and measurements to include: We included static analyses and manual reviews, because they are least dependent on the system context. In contrast, dynamic testing of a system would require specific test cases and execution environments. Furthermore, we focused on product quality and, hence, product aspects influencing quality, instead of on process or people aspects. While we consider the latter aspects important as well, we expected the product aspects to be easier and more direct to measure.
To achieve these goals, software quality experts from both academia and industry in Germany joined forces within the Quamoco research project. The project consortium consisted of Technische Universität München, SAP AG, Siemens, Capgemini, Fraunhofer IESE, and itestra. In total, these partners spent 558 person-months on the project.
1.3 Contribution
This article is an extension of an earlier one [75] and provides six major contributions overall: First, we developed a meta-model for software quality models. It provides the structure for the full spectrum from organising quality-related concepts to defining operational means for assessing their fulfilment in a specific environment including their modularisation. Second, the base quality model instantiates the meta-model and captures knowledge on how to conduct a basic quality assessment for different kinds of software. It serves as the basis for more specific quality models. We elaborated the base model in depth for the languages Java and C#.
Third, we contribute a clearly defined quality assessment method that is integrated with the meta-model. Fourth, we performed several validations of the base model with real software systems that showed the understandability of the model and the correspondence of the assessment results with expert opinions. Fifth, we developed extensive tool support for building and adapting operationalised quality models as well as for performing quality assessments. Sixth and last, we contribute a domain-specific quality model as an extension to the base model, which shows the usefulness of the modularisation and separation between base model and specific extensions. Preliminary versions of the meta-model, the base model, the quality assessment and the empirical analysis were partly described in the earlier conference paper [75].
1.4 Terms and Definitions
Here, we introduce the terms used most frequently in this article. Quality characteristic refers to the concept as used in ISO/IEC 9126 and ISO/IEC 25010 to decompose software quality, e. g. into maintainability or reliability. Quality characteristics can hence be thought of as “-ilities”. A quality aspect is more generally an area of interest that contributes to the quality of a software product for a certain stakeholder. In particular, we consider ISO/IEC’s quality characteristics as quality aspects but also allow for other decompositions of software quality to get increased precision and expressiveness within a quality model. We use one such alternative decomposition in the Quamoco base quality model. Quality aspects are typically not measurable or observable directly. While they describe quality on a rather abstract level, product factors are observable properties of certain entities within a software product. Product factors as well as their relationships to quality aspects are discussed in detail in Section 3.2. Finally, a quality requirement is a stakeholder’s stated desire to have a certain quality aspect or product factor fulfilled by a product.
1.5 Outline
The remainder of this article is structured as follows: Section 2 presents an overview of both related work and our own previous work in the research area of quality modelling and assessment. In Section 3, we discuss usage scenarios for quality models, introduce general concepts, and present our meta quality model. We instantiate this meta-model in Section 4 and present our base quality model for software products written in Java or C#. We describe our approach for assessing software quality with this model in Section 5. Section 6 describes the tool support for the application of the approach in practice. In Section 7, we describe the empirical evaluation we performed to validate the proposed model and tools. Section 8 presents one domain-specific quality model, which extends the base model for the specifics of embedded systems. Finally, Section 9 concludes the article and outlines future work.
2 Related Work
Quality models have been a research topic for several decades and a large number of quality models have been proposed [45]. We describe the predominant hierarchical models, important proposals for richer models, quality measurement approaches and tools, and a summary of our own preliminary work.
2.1 Hierarchical Models
The first published quality models for software date back to the late 1970s, when Boehm et al. [13] as well as McCall, Richards and Walter [57] described quality characteristics and their decomposition. The two approaches are similar and use a hierarchical decomposition of the concept quality into quality characteristics such as maintainability or reliability. Several variations of these models have appeared over time. One of the more popular ones is the FURPS model [29], which decomposes quality into functionality, usability, reliability, performance, and supportability.
This kind of quality model became the basis for the international standard ISO/IEC 9126 [38] in 1991. It defines a standard decomposition into quality characteristics and suggests a small number of metrics for measuring them. These metrics do not cover all aspects of quality, however. Hence, the standard does by no means completely operationalise quality. The successor to ISO/IEC 9126, ISO/IEC 25010 [36], changes a few classifications but keeps the general hierarchical decomposition.
In several proposals, researchers have used metrics to directly measure quality characteristics from or similar to ISO/IEC 9126. Franch and Carvallo [27] adapt the ISO/IEC quality model and assign metrics to measure them for selecting software packages. They stress that they need to be able to explicitly describe “relationships between quality entities”. Van Zeist and Hendriks [71] also extend the ISO/IEC model and attach measures such as average learning time. Samoladas et al. [65] use several of the quality characteristics of ISO/IEC 9126 and extend and adapt them to open source software. They use the quality characteristics to aggregate measurements to an ordinal scale. All these approaches reveal that it is necessary to extend and adapt the ISO/IEC standard. They also show the difficulty in measuring abstract quality characteristics directly.
Various critics (e. g. [23, 1]) point out that the decomposition principles used for quality characteristics are often ambiguous. Furthermore, the resulting quality characteristics are mostly not specific enough to be measurable directly. Although the recently published successor ISO/IEC 25010 has several improvements, including a measurement reference model in ISO/IEC 25020, the overall criticism is still valid because detailed measures are still missing. Moreover, a survey done by us [77, 78] shows that fewer than 28% of the companies use these standard models and 71% of them have developed their own variants. Hence, there is a need for customisation.
2.2 Richer Models
Starting in the 1990s, researchers have been proposing more elaborate ways of decomposing quality characteristics and thereby have built richer quality models. Dromey [25] distinguishes between product components, which exhibit quality carrying properties, and externally visible quality attributes.
Bansiya and Davis [7] build on Dromey’s model and propose QMOOD, a quality model for object-oriented designs. They describe several metrics for the design of components to measure what they call design properties. These properties have an influence on quality attributes. They also mention tool support and describe validations similar to ours (Section 7).
Bakota et al. [6] emphasise the probabilistic nature of their quality model and quality assessments. They introduce virtual quality attributes, which are similar to product factors in our quality model (cf. Section 3). The quality model uses only nine low-level measures, which are evaluated and aggregated to probability distributions. Our experience has been that practitioners have difficulties interpreting such distributions.
Kitchenham et al. [42] acknowledge the need for an explicit meta-model to describe the increasingly complex structures of quality models. They also propose a “build your own” method for quality models with their Squid approach.
All richer models show that the complex concept of quality needs more structure in quality models than abstract quality characteristics and metrics. They have, however, not established a corresponding quality assessment method, tool support and a general base quality model, which are necessary for comprehensively measuring and assessing quality.
2.3 Quality Measurement and Tool Support
Although not embedded in an operationalised quality model, a large number of tools for quality analysis are available. Examples include bug pattern identification (e. g. FindBugs111http://findbugs.sf.net, PMD222http://pmd.sf.net, Gendarme333http://www.mono-project.com/Gendarme, or PC-Lint444http://www.gimpel.com/html/pcl.htm), coding convention checkers (e. g. Checkstyle555http://checkstyle.sf.net), clone detection, and architecture analysis. These tools focus on specific aspects of software quality and fail to provide comprehensive quality assessments. Moreover, there are no explicit and systematic links to a quality model.
Dashboards can use the measurement data of these tools as input (e. g. SonarQube666http://www.sonarsqube.org or XRadar777http://xradar.sf.net) to provide a visual overview of the quality measurements taken from a software system. Nevertheless, they lack an explicit and well-founded connection between the metrics used and particular quality aspects. Hence, explanations of the impacts of defects on software quality and rationales for the used metrics are missing.
Experimental research tools (e. g. [53, 66]) take first steps towards integrating a quality model and an assessment toolkit. A more comprehensive approach is taken by the research project Squale [60, 61] which was carried out at the same time [11] as our project. Squale provides an explicit quality model based on [48] for describing a hierarchical decomposition of the ISO/IEC 9126 quality characteristics. Hence, it follows and extends the FCM model [57] by introducing an intermediate level of so-called practices which link measures with criteria and hence with quality factors. The model contains formulas for evaluating the associated metric values as well as weighting the sets of practices and criteria for the respective higher-ranked criteria and factors. For this, Squale provides tool support for evaluating software products and visualising the results. A shortcoming of Squale is that its quality model does not explicitly consider Dromey’s product components to which the quality issues could be related. These technical details regarding quality issues at the level of product components make the quality model more useful in practice as this allows for focused drilldowns of quality issues. Squale also lacks support for modularisation as well as for managing multiple quality models or multiple hierarchies of quality characteristics.
The CAST Application Intelligence Platform888http://www.castsoftware.com is a proprietary system that focuses on automatically determining technical debt based on the risk of quality deficiencies of business applications. Thus, it measures quality on a technical level and evaluates the risks of vulnerabilities. To do so, it is based on a simple model that pools measures into severity classes and does not allow comprehensive quality analysis. Users of CAST are provided with a dashboard to monitor quality deficiencies and resulting risks.
However, these tools and approaches do, to a certain extent, follow the same idea of an integrated quality model and its assessment as we do in this article. Regarding the quality models, the main difference is that we use a product model for structuring the (technical) product factors in the Quamoco quality models. Furthermore, Quamoco offers modularisation and an editor for creating, adjusting, and managing quality models for various application domains in contrast to fixed, predefined models. The Quamoco tool chain allows for flexible configuration and integration of measurement tools and even manually collected data without any changes in the source code of the tool chain.
2.4 Preliminary Work
In prior work, we investigated different ways of describing quality and classifying metrics, e. g. activity-based quality models [23] and technical issue classifications [63]. Based on the findings, we developed a meta-model for quality models and evaluated its expressiveness [46]. We experimented with different approaches for quality assessments and tool support [62, 73, 68, 44, 51]. Based on the experience gained, we developed a comprehensive tool chain for quality modelling and assessment [19].
We published a shorter, preliminary version of this article [75] which focuses on the base model and on a limited set of validations. We added more detailed descriptions, explanations and illustrations in various parts of the paper to make the work easier to understand. In particular, we added a detailed description of the approach we used for developing the base quality model. In addition, we added new contributions with the description of domain-specific quality models, model adaptation, tool support and additional empirical validations.
3 Quality Model Concepts
The first challenge in addressing the gap between abstract quality characteristics and concrete assessments is to formalise the structure for operationalised quality models in a suitable meta quality model. After describing how we use quality models, we will explain each of the concepts briefly and describe which problems they solve. Finally, we will combine the concepts into a meta-model to show the complete picture. These concepts and the meta-model were developed in three iterations spanning three years with corresponding evaluations [46] (see also Section 4.1).
3.1 Usage of Quality Models
Most commonly, we find quality models reduced to mere reference taxonomies or implicitly implemented in tools. As explicit and living artefacts, however, they can capture general knowledge about software quality, accumulate knowledge from their application in projects, and allow quality engineers to define a common understanding of quality in a specific context [54, 23, 31, 52].
We aim to use this knowledge as the basis for quality control. In the quality control loop [20], the quality model is the central element for identifying quality requirements, planning quality assurance activities, assessing the fulfilment of quality requirements, and reworking the software product based on the assessment results. The quality model is useful for defining what quality aspects are relevant, how we can measure them and how we can interpret the measurement data to understand the actual quality of a specific software product. This single source of quality information helps to avoid redundancies and inconsistencies which are typical for quality specifications and guidelines.
The quality model defines preferences regarding quality which we need to tailor to the product to be developed in that it specifies relevant quality aspects (not relevant ones are not included in the model) and the level of their relevance (reflected by the importance weights associated with the quality aspects).
In this article, we will focus on the usage of quality models for quality assessment purposes. In this scenario, a software product is measured according to the quality metrics defined in the quality model, and the measurement data are interpreted according to the utility functions defined in the model and then aggregated along the model’s structure to derive utilities for individual quality aspects and for product’s overall quality. Finally, the aggregated utilities are mapped onto more intuitive quality assessments, for instance ordinal-scale school grades. Please refer to Section 5.1 for a detailed description of the quality assessment method and an example of its usage.
Quality assessments may be used in a summative or in a formative way. Using the assessment results in a summative way allows quality engineers to assess a software product’s quality at specific quality gates and to initiate appropriate quality improvements. The assessment results of a product can be interpreted on its own but also serve as input for a trend analysis, or they can be compared with those of other products in a benchmarking setting. Furthermore, the results can be used in a formative way to spot software defects in the source code. Additionally, applying continuous quality assessments using a quality model may improve the quality awareness of practitioners as they learn from the quality knowledge contained in the quality model.
3.2 General Concepts
The previous work of all Quamoco partners on quality models, our joint discussions, and experiences with earlier versions of the meta-model led us to the basic concept of a factor. A factor expresses a property of an entity, which is similar to what Dromey [25] calls quality carrying properties of product components. We use entities to describe the things that are important for quality and properties for the attributes of the things we are interested in. Because the concept of a factor is general, we can use it on different levels of abstraction. As we focus on product quality and aspects of the product that are relevant for it, the entity will always be a part of the software product. For example, we have concrete factors such as cohesion of classes as well as abstract factors such as portability of the product. The factor concept as such would be generic enough to cover process or people aspects as well, but these are beyond the scope of the work in this article.
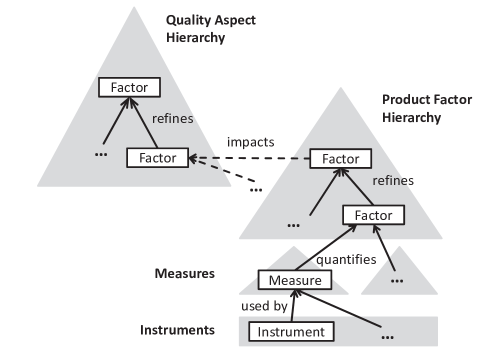
To clearly describe product quality from an abstract level down to concrete measurements, we differentiate between the two factor types quality aspects and product factors which represent two levels of abstraction. Both can be refined into sub-aspects and sub-factors, respectively, as illustrated in Figure 1. Quality aspects express abstract quality goals, for example the quality characteristics (or quality attributes) of ISO/IEC 25010 which always have the complete product as their entity because they describe the whole product. For example, valid quality aspects are maintainability of the product, analysability of the product or reliability of the product.
Product factors, in contrast, are attributes of parts of the product. We require the leaf product factors to be concrete enough to be measured. Examples are duplication of source code part, which we measure with clone coverage999Clone coverage is the probability that a randomly chosen line of code is duplicated., or detail complexity of method measured by length and nesting depth. This separation of quality aspects and product factors helps us to bridge the gap between abstract notions of quality and concrete implementations. In addition, separating the entities from their properties addresses the problem of the difficulty of decomposing quality attributes. Product factors can easily be decomposed regarding either their property or their entity. For example, the entity class, representing a part of an object-oriented program, can be decomposed straightforwardly into the entities attribute and method. Hence, we can exactly model for what a property holds.
Moreover, the concepts allow us to model several different hierarchies of quality aspects to express divergent views on quality. Quality has so many different facets that a single hierarchy is not able to express all of them. Even in the recent ISO/IEC 25010, there are two quality hierarchies: product quality and quality in use. We can model both as quality aspect hierarchies. Other types of quality aspects are also possible. We found that this gives us the flexibility to build quality models tailored, for example for different stakeholders. In principle, the concept also allows us to have different product factor hierarchies or more levels of abstraction. In our experiences building quality models, however, we found these two levels to be often sufficient, given the expressiveness gained from clearly separating entities and properties.
To close the gap between abstract quality aspects and measurable properties of a product, we need to put the two factor types into relation. Product factors can have impacts on quality aspects. This is similar to variation factors, which have impacts on quality factors in GQM abstraction sheets [70]. An impact is either positive or negative and describes how the degree of presence or absence of a product factor impacts a quality aspect. This gives us a complete chain from measured product factors to impacted quality aspects and vice versa. Not all product factors in our models have impacts because we sometimes use them only for structuring purposes. Yet, all product factors that we want to have included in assessments need to have at least one impact on a quality aspect.
Those product factors need to be concrete enough to be measured. Hence, we also have the concept of measures for product factors. A measure is a concrete description of how a specific product factor should be quantified for a specific context. For example, this could be the number of deviations from the rule for Java that strings should not be compared using the “==” operator or clone coverage as mentioned earlier. A product factor can have more than one measure if we need multiple measures to cover its concept.
Moreover, we separate the measures from their instruments. Instruments describe a concrete implementation of a measure. In the example of the string comparison, an instrument is the corresponding rule as implemented in the static analysis tool FindBugs. This gives us additional flexibility to collect data for measures either manually or with different tools in different contexts.
Having these relationships with measures and instruments, it is straightforward to assign evaluations to product factors and quality aspects to form a quality assessment. The evaluations aggregate the measurement results (provided by the instruments) for product factors and the evaluation results of impacting product factors for quality aspects. The intuition is that the evaluations hold some kind of formula to calculate these aggregations. We will describe a comprehensive quality assessment method showing concrete evaluations in Section 5.
Moreover, we can go the other way round. We can pick quality aspects, for example, ISO/IEC 25010 quality characteristics, which we consider important and costly for a specific software system, and trace what product factors affect them and what measures quantify them (cf. [73]). This allows us to put emphasis on the product factors with the largest impact on these quality aspects. It also gives us the basis for specifying quality requirements for which we developed an explicit quality requirements method [64, 50].
Building quality models with all these element types results in large models with hundreds of model elements. Not all elements are important in each context and it is impractical to build a single quality model that contains all measures for all relevant technologies. Therefore, we introduced a modularisation concept which allows us to split the quality model into modules. For example, in the concrete models described in this article, there is the root module containing general quality aspect hierarchies as well as basic product factors and measures. We add additional modules for specific technologies and paradigms, such as object orientation, programming languages, such as C#, and domains, such as embedded systems. This gives us a flexible way to build large and concrete quality models that fit together, meaning they are based on the same properties and entities.
Modularisation enables us to choose appropriate modules and extend the quality model with additional modules for a given context. To adapt the quality model for a specific company or project, however, this is still too coarse-grained. Hence, we also developed an explicit adaptation method, which guides a quality manager in choosing relevant quality aspects, product factors and measures for a particular project (see Section 6.2).
3.3 Meta-Model
We precisely specified the general concepts described so far in a meta-model. The core elements of the meta-model are depicted as an (abstracted) UML class diagram in Figure 2. Please note that we left out a lot of details such as the IDs, names and descriptions of each element to make it more comprehensible. A detailed description of the meta-model is available as a technical report [76]. The central element of the meta-model is the Factor with its specialisations Quality Aspect and Product Factor. Both can be refined and, hence, produce separate directed acyclic graphs. An Impact can only exist between a Product Factor and a Quality Aspect. This represents our main relationship between factors and allows us to specify the core quality concepts.

A Factor always has an associated Entity, which can be in an is-a as well as a part-of hierarchy. The property of an Entity that the Factor describes is expressed in the Factor’s name. Each Factor may also have an associated Evaluation. It specifies how to evaluate the Factor. For that, we can use the evaluation results from sub-factors or – in the case of a Product Factor – the values of associated Measures. To keep the UML class diagram readable, we omit these relationships there. A Measure can be associated with more than one Product Factor and has potentially several Instruments that allow us to collect a value for the Measure in different contexts, e. g. with a manual inspection or a static analysis tool.
We modelled this meta-model with all details as an EMF101010Eclipse Modeling Framework, http://emf.eclipse.org/ model which then served as the basis for the quality model editor (see Section 6).
4 Base Model
The base quality model’s main objective is to be an operationalised quality model that can be used directly to assess a wide range of software products and can also be extended for specific contexts with little effort. To reach this goal, the Quamoco project partners conducted several workshops and sprints to collaboratively transfer their knowledge and experience into the structure described in Section 3.
The resulting quality model represents our consolidated view on the basics of the quality of software source code and is, in principle, applicable to any kind of software. It details quality down to measures and instruments for the assessment of Java and C# systems and, hence, enables comprehensive, tool-supported quality assessment without requiring large adaptation or configuration effort.
4.1 Development of the Base Model
The development of the base model was a joint effort of all project partners in Quamoco. Overall, at least 23 people from industry and academia were involved in building the base model. We worked on it (and its underlying meta-model) throughout all three years of the project. This long time span led to changes and adaptations of the development approach over time. As the development of the model is crucial for judging how much it can be trusted, we describe the development approach and how we executed it.
4.1.1 Approach
Our general approach to developing the base model was to combine top-down and bottom-up modelling. This means that we started from general quality aspects and added product factors and measures that are important for these quality aspects based on our experiences or existing studies. Moreover, we also evaluated existing measures, mostly from static analysis tools, investigated their intention and selectively built suitable product factors and impacts on quality aspects. We believe both directions are necessary. Modelling bottom-up is attractive because we know we have measures, most of them automatically collectable, for the product factors we are building. Yet, to come to a comprehensive assessment of quality aspects, we need to identify which product factors and measures are missing. Therefore, the combination of top-down and bottom-up modelling supports the comprehensiveness of the model.
Because we knew that we had to learn while building the base model, we introduced three large, year-long iterations. Our aim was to have one base model after each iteration that we could further discuss and validate. This included a round of feedback from the whole consortium in each iteration, meaning we gave a base model to people not working on it directly for discussion. In addition, each iteration ended with detailed reviews by two reviewers from the consortium who were not directly involved in the base model development. Both the feedback rounds and the reviews ensured that all experiences of the project members were captured.
The central means for developing the base model and assuring its quality were regular workshops. We used workshops to work on the meta-model as well as on the base model. We conducted workshops at least at each status meeting (every two to three months) and added additional workshops as needed. Over time, we used various elicitation and analysis techniques, such as prototyping, design sketching or pair modelling. A special kind of workshop were tutorial days aimed at introducing all members of the consortium to the current state of the base model. This also helped us to integrate the experience of all project members.
As we learned that it is easy to build a quality model that cannot be used in a quality assessment, we introduced the concept of nightly quality analysis. This means that we executed a quality assessment every night on a set of open source projects using the current state of the base model. Hence, similar to continuous integration, we found problems in the quality model quickly.
Furthermore, we explicitly validated the results of each iteration. We developed four validation concepts to investigate the structure and contents of the base model as shown in Table 1. We wanted to understand the suitability of the structure, how much the base model assessment results differ between systems, how well the results fit to expert opinions, and how well practitioners understand and accept the base model and its results. Each of the validations for every iteration were also reviewed by two reviewers not directly involved in the validations. The final validations are described in Section 7.
| Meta-model suitability | We let experts transcribe (parts of) their existing, diverse quality models into the new structure as given by our meta-model and fill out a questionnaire on how well the structure fits their model and needs. Although this does not validate the base model directly, the underlying meta-model is a fundamental part in terms of the practicality of a quality model. We already published the results of this validation in [46]. |
|---|---|
| Degree of differentiation | A quality model that gives a very similar quality grade for all kinds of systems is not helpful. Hence, we ran quality assessments on open source and industrial systems to investigate to what degree the results differentiate the systems. We do not report detailed results in this article. Yet, the experiences helped us in the development of the base model by understanding what is important (Section 5.2). Furthermore, we shaped the interpretation model of the quality assessment approach (Section 5.1.4) to support this differentiation. |
| Criterion validity | To understand whether our quality assessment results from the base model matched independent assessments, we compared the assessment results based on the model with the independent results for existing systems. First, in case we had a quality ranking of a set of systems or sub-systems, we performed a quality assessment using the non-adapted base model and compared the resulting quality ranking with the existing one. We did this using expert opinions about open source and industrial systems (Section 7.1). Second, in case we knew that during certain time periods, changes to a software had been done specifically to improve its quality, we assessed the quality at several points in time using the base model and expected to see an improvement in the quality grade as well. We performed such a validation with one industrial system (Section 7.2). |
| Acceptance | Because it is essential that practitioners understand the base model structure, its contents and the assessment results, we conducted assessments of industrial systems and inspected the results together with experts for the systems. We elicited the experts’ understanding and acceptance of the base model and the result of the assessment conducted using the base model with a questionnaire. We performed these validations for industrial systems (Section 7.3). |
In iteration 1, most of the development of the base model was done by five people from one partner organisation. The difficult consolidation and the discussions at the workshops led us to change that approach. We realised that we needed to integrate all partners and set aside dedicated time slots for working on the base model. Therefore, we introduced the concept of sprints. Each sprint was two weeks long and included four to eight people from two to three partners. We started with two days of joint modelling in one location. Afterwards all participants worked independently on the base model and synchronised their work in daily conference calls. In iteration 2, the sprints were aimed at exploring different areas of what to include in the base model. In iteration 3, we aimed at consolidating and completing the base model.
4.1.2 Execution
In this section, we describe the execution of the approach to building the base model structured along the iterations. We show an overview of the activities of all three iterations in Table 2. We omitted the feedback rounds in the table because we performed one in each iteration to discuss the current status of the base model.
| It. | Focus | Meta-model workshops | Base model workshops | Sprints | Validation | Reviews |
|---|---|---|---|---|---|---|
| 1 | Structure and meta-model | 8 | 5 | – |
Meta-model suitability
Degree of differentiation Criterion validity |
4 |
| 2 | Exploring possible contents | 4 | 8 |
GUI and accessibility
C and maintenance Structuredness and portability Performance and efficiency |
Meta-model suitability
Degree of differentiation Criterion validity |
4 |
| 3 | Consolidation and completion | – | 3 |
Factor consolidation
Automation and consistency Visualisation Calibration and weighting Consolidation with specific quality models |
Criterion validity
Acceptance |
4 |
This section and particularly the six steps described below report on the third iteration in more detail because it had the largest influence on the final contents of the base model. The main work finalising the base model was done by nine people during a period of three months in which we held approx. three meetings or conference calls a week, each lasting about two hours. All in all, this sums up to approx. 80 hours of joint discussions.
-
1.
Selection of Tools: In the consortium we decided to finalise the base model for the programming languages Java and C#. We chose to use freely available tools as a basis for the measures to facilitate the application of the base model. Thus, we selected the commonly used tools FindBugs and PMD for Java and Gendarme for C#. Moreover, we included measures available in the quality assessment framework ConQAT111111http://www.conqat.org/. We captured the knowledge of our industry partners about important checks in manual reviews as manual measures.
-
2.
Distillation of Product Factors: We used a bottom-up approach to define product factors based on the measures collected in step 1. We created an entity hierarchy containing concepts of object-oriented programming languages, like classes, methods, or statements. Then we assigned each measure to a product factor in a series of meetings. If no suitable product factor existed, a new one was created. If no suitable entity existed, a new entity was also created. This process was guided by the goal of obtaining a consistent and comprehensible base model. Hence, there were extensive discussions in the meetings, leading to previously defined product factors being changed. For instance, previously defined product factors were split, merged, or renamed.
-
3.
Defining the Impacts: After the product factors had been created in step 2, the impacts of each product factor on a quality aspect were derived in workshops as in the earlier iterations. Each impact was documented in the quality model with a justification how the product factor influences the quality aspect.
-
4.
Reviewing and Consolidating: In the next step, the model – now consisting of instruments/measures, product factors, impacts, and quality aspects – was reviewed and consolidated. To validate the chain from measures to product factors to impacts, the reviewers asked the following question for each product factor: “Would the impacts assigned to a product factor be valid if they were directly assigned to each measure of that factor?” Asking this question meant evaluating whether the chosen granularity of the product factor was right. If this question could not be answered positively for a product factor, it had to be split into two or more factors, or a measure had to be reassigned to another product factor. In addition, we added the top-down view by asking ourselves whether the quality aspects were appropriately covered by the impacting product factors and whether the product factors were comprehensively measured by the assigned measures.
-
5.
Deriving Evaluations: The creation of all model elements concerned with measurement and the evaluation of the measurement results is described in detail in Section 5.2.
-
6.
Assessment of Coverage: To assess the completeness of the developed base model, we introduced an attribute Coverage to measure the evaluations. For each measure evaluation, we manually assessed to which extent the available measures covered the product factor. The values for coverage were determined in workshops and added to the model.
4.2 Contents
The Quamoco base model – available together with tool support (see Section 6) and in a Web version121212http://www.quamoco.de/ – is a comprehensive selection of factors and measures relevant for software quality assessment. In total, it comprises 92 entities and 284 factors. Since some factors are used for structuring purposes rather than for quality assessment, only 233 factors have evaluations assigned to them. Of these, 201 factors define impacts on other factors, leading to a total of 490 impacts. These numbers differ from the numbers in our previous publication in [75] because the model was consolidated at the conclusion of the Quamoco project, which took place after the publication of that paper. The relationship between ISO/IEC 25010 characteristics and base model elements is presented in Table 3. Note that product factors can have impacts on multiple quality aspects, and measures can contribute to multiple product factors, which is why the sum over a table column can be greater than the total number of distinct elements of that type. Also, tool-based measures may be implemented differently for C# than for Java, so there may be two tool-based instruments for the same measure.
| Product | Tool-Based | Manual | |
|---|---|---|---|
| Factors | Instruments | Instruments | |
| Maintainability | 146 | 403 | 8 |
| Functional Suitability | 87 | 271 | 1 |
| Reliability | 69 | 218 | 0 |
| Performance Efficiency | 59 | 165 | 1 |
| Security | 17 | 52 | 0 |
| Portability | 11 | 20 | 0 |
| Compatibility | 0 | 0 | 0 |
| Usability | 0 | 0 | 0 |
Since the model provides operationalisation for different programming languages (cf. Section 4.3), it contains considerably more measures than factors: In total, there are 194 measured factors and 526 measures in the model. For these measures, the model contains 544 instruments, which are divided into 8 manual ones and 536 that are provided by one of 12 different tools. The tools most relied upon are FindBugs (Java, 361 rules modelled) and Gendarme (C#, 146 rules). Other tools integrated into our model include PMD and several clone detection, size, and comment analyses, which are part of ConQAT.
The validity of metrics for measuring and evaluating the presence or absence of quality characteristics (e. g. maintainability) in a software product is well studied but controversial. While some studies (e. g. [9], [14], [18]) conclude that software metrics could be used as indicators of quality, others (e.g., [2], [10], [67]) deny the validity of metrics. However, since we put the emphasis on rules of static analysis and adhering to best practices, we ascribe less importance to the validity of other metrics for our models.
Rules of static code analysis can be used for ascertaining specific potential flaws within source code, e. g. to detect bug patterns often observed [32] or to check for established best practices. Thus, associating violations of both (due to such rules or best practices such as naming conventions) with factors can make it easier to understand their impact. No empirical study known to us is currently available, however, that provides statements about the validity of rule assignments to certain factors. In the specific quality model for embedded software systems (see section 8) we evaluated whether the associated rules and best practices are appropriate and sufficient for certain aspects.
In the following, we present example product factors including their respective measures and impacts to illustrate the contents of the base model. An important design decision was to use the product quality characteristics of ISO/IEC 25010 to describe quality aspects, because this is the best-known way of describing software quality. These characteristics all refer to the whole software product and are hence modelled in such a way that each characteristic refines the factor quality with the entity product and each sub-characteristic refines its respective characteristic.
4.2.1 Rules of Static Code Analysis Tools
As described above, the largest fraction of measures refers to static code analysis tools. One example is the FindBugs rule FE_TEST_IF_EQUAL_TO_NOT_A_NUMBER, which scans Java code for equality checks of floating point values with the Double.NaN constant. The Java language semantics defines that nothing ever equals NaN, not even NaN itself, so that (x == Double.NaN) is always false. To check whether a value is not a number, the programmer has to call Double.isNaN(x). This rule is an instrument for the doomed test for equality to NaN measure, which measures the product factor general expression applicability for comparison expressions, along with several other measures. This product factor in turn impacts functional correctness, because the developer intended to check a number for NaN but the actual code does not. It furthermore impacts analysability, because understanding the intention of this construct demands additional effort.
Using automatic source code analysis techniques for quality assessment implies the risk of false positives, i. e. findings reported by the analysis tools that do not reflect actual problems in the source code. While false positives have been reported to cause acceptance problems [12], providers of modern static analysis tools continuously work on reducing the number of false positives produced by their tools (e. g. [4, 33]). Another aspect is that the calibration (see Section 5.2) was performed in such a way that normalised measurement results were transformed into utility values based on the value range they produce. This means that the utility mapping functions already take false positives into account and therefore false positives will not severely impact the assessment results.
In the Quamoco approach, we adapted the concept of utility value from Multi-Attribute Utility/Value Theory (MAUT/MAVT) [72] where utility131313MAUT assumes that decision-making involves risk. For the sake of simplifying the initial quality assessment method, we assume quality assessment to have a riskless character and use the multi-attribute value theory (MAVT). Yet, we will use the term “utility” instead of “value” to avoid confusion between the meaning of the term “value” in the context of MAUT and its common understanding in the software engineering and measurement domains. represents the strength of preference a decision maker has among alternatives (in our case alternative software products) regarding a specific decision criterion (in our case a quality aspect). Transformation between normalised measurement results and corresponding utility values is performed with the help of utility functions. Utility maps measured, objective values of a quality aspect onto corresponding utilities.
Additionally, measures that we knew had a comparatively high rate of false positives were assigned lower weights during the modelling workshops (see Section 4.1).
4.2.2 Programming Best Practices
Rule-based code analysis tools cannot detect every kind of quality problem. Therefore, the base model also contains product factors based on metrics and best practices. For example, identifiers have been found to be essential for the understandability of source code. Whether identifiers are used in a concise and consistent manner can only partly be assessed automatically [22]. Therefore, the product factor conformity to naming convention for source code identifiers contains both automatic checks performed by several tools and manual instruments for assessing whether identifiers are used in a consistent and meaningful way.
Another well-known property related to software quality is code cloning. Source code containing large numbers of clones has been shown to be hard to understand and to maintain [41]. The concept of code cloning is represented in the product factor duplication of source code, which has negative impacts on both analysability and modifiability. It is measured by clone coverage as well as cloning overhead. Both these measures have corresponding instruments for Java and C#, which are obtained by ConQAT’s clone detection functionality.
4.2.3 Guidelines
To show that our concepts are not only applicable to static analysis of source code, we modelled a subset of W3C’s Web Content Accessibility Guidelines (WCAG) 2.0141414 http://www.w3.org/TR/WCAG, which is a guideline for making web content accessible to people with disabilities. The WCAG differs from the examples described above in several ways: Most of the contents are phrased as success criteria, outlining the best way to achieve accessibility and providing technology-independent instructions to test them. In addition, the entities of interest are UI components rather than source code elements. Due to the size of the guideline and the small fraction represented in our model, we decided to separate this GUI module from the base model and provide it separately as an example rather than a complete model.
4.3 Modular Structure
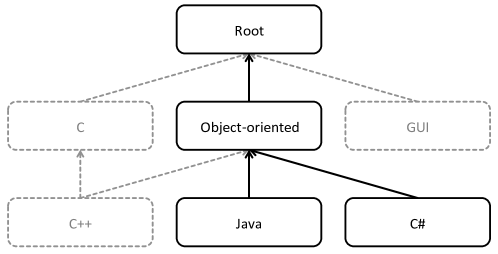
Modularisation is not only helpful by differentiating between the base model and specific models but also within the base model itself. It allows us to separate more abstract, context-independent elements from concrete, technology-specific elements. In Figure 3, the modules of the base model are depicted with black lines, while experimental modules are depicted in grey. In the base model, the module root contains the definitions of quality aspects as well as product factors that are independent of programming paradigms or languages. For these product factors, the root module also contains evaluations as well as impacts on quality aspects, ensuring a large amount of reusability across the other modules. We introduced our own module for each programming language in the quality model. An intermediate module object-oriented defines common concepts of object-oriented programming languages (Java, C#) such as classes or inheritance.
We also used the modularisation concept to integrate specific analysis tools for particular programming languages. In the module object-oriented, we defined a large number of general measures without connections to concrete tools (e. g., number of classes). The module for Java then defines a tool for measuring the number of classes in Java systems. This way, we support separation between general concepts and specific instruments.
The explicit definition of modules provides several benefits: First, it enables quality modellers to separately and independently work on modules for different technologies and domains. Second, it allows us to explicitly model the commonalities and differences between several programming languages. The module object-oriented defines 64 common factors to be reused in the modules Java and C#, which add only 1 and 8 language-specific product factors, respectively.
Furthermore, modularisation made it possible to create other modules for conducting various experiments without impairing the more stable contents of the base model. We created two modules for C and C++, which are not mature yet. Furthermore, we tested the modelling of non-source code factors in the module GUI for graphical user interfaces.
5 Quality Assessment Approach
A quality model specifies quality in terms of relevant properties of software artefacts and associated measures. Yet, to support the assessment of product quality, the quality model needs to be associated with an approach to synthesise and interpret the measurement data collected for the product. In this section, we specify a quality assessment method applicable for Quamoco quality models. We assume for the method that we have already adapted the quality model suitably for our context (see Section 6.2 for more detail on adapting quality models).
5.1 Quality Assessment Method
In this section, we propose a systematic method for assessing the quality of software products. The method relies on the requirements we identified in a systematic literature review and a small industrial survey [69]. These requirements are briefly summarized in Table 4.
| R01. Supports group decision-making and multiple viewpoints | SQA should be transparent and understandable for the quality stakeholders. If the assessment provided by the assessment method deviates from what is expected by the quality stakeholders, then they should be able to easily identify and understand the causes of the discrepancies. |
|---|---|
| R02. Comprehensible to quality stakeholders | SQA should be transparent and understandable for the quality stakeholders. If the assessment provided by the assessment method deviates from what is expected by the quality stakeholders, then they should be able to easily identify and understand the causes of the discrepancies. |
| R03. Handles uncertain information | SQA should be applicable to both certain and uncertain information. When uncertain information is provided, the assessment method should also indicate the uncertainty of the assessments it delivers. |
| R04. Correctly comprehends the preferences of the stakeholders | SQA should assess the quality of a software product as it is perceived (and as it would be assessed) by software decision makers whose quality requirements this software product should satisfy. |
| R05. Copes with incomplete information | SQA should be applicable for incomplete input. When applied to incomplete information, the method should provide reasonable outcomes, probably within a certain uncertainty range. |
| R06. Handles interdependencies between elements of the quality model | SQA should handle potential interdependencies between quality attributes (i.e., elements of the underlying quality model). It other words, the quality assessment should explicitly consider how the quality attributes interact with and constrain each other, and how they affect the achievement of other quality attributes. |
| R07. Combines compensatory and non-compensatory approach | SQA should support assessment for both comparable and non-comparable quality attributes. For comparable quality attributes, the method should support mutual compensation of their ”negative” and ”positive” values. |
| R08. Supported by an automatic tool | SQA should be supported by an automatic software tool. Moreover, configuring and operating the tool should not require much effort. After configuring, the tool should allow fully automatic quality assessment. |
| R09. Allows for incorporating subjective expert evaluations | SQA should allow for manual assessment of the selected quality attributes and for incorporating these intermediate assessments into the overall quality assessment process. |
| R10. Supports benchmarking | SQA should support comparing software products directly, using their quality assessment results. For this purpose, quality assessment results need to be comparable against each other for different software products, particularly for different versions of the same product. |
| R11. Provides repeatable results (assessments) | SQA should provide repeatable assessments when applied with the same set of alternatives. |
| R12. Custom-tailorable | SQA should allow for assessing quality regardless of the particular structure of the quality problem and the context of the quality assessment. The structure of a quality problem typically refers to the structure of the underlying quality model (e.g., flat list of effort factors or hierarchical structure of aspects and sub-aspects). |
| R13. Supports hierarchical quality model | SQA should operate on a hierarchically structured quality model. In other words, the method should be applicable to quality aspects that are organized in a hierarchical structure. |
| R14. Scalable and extensible | SQA should allow for assessing quality independent of the size and complexity of the underlying quality model (the number of quality attributes and their dependencies). In other words, the applicability of the method should not depend on the size and complexity of the underlying quality assessment problem. Moreover, the assessment method should also allow changing the size and complexity of the underlying quality model, that is, it should not be fixed for a specific quality model. |
| R15. Supports intermediate assessments | SQA should allow for assessing quality at intermediate levels of the hierarchical structure of the underlying quality model. In other words, it should be possible to assess quality aspects at any level of the quality model hierarchy instead of doing a single assessment for the root quality aspect. |
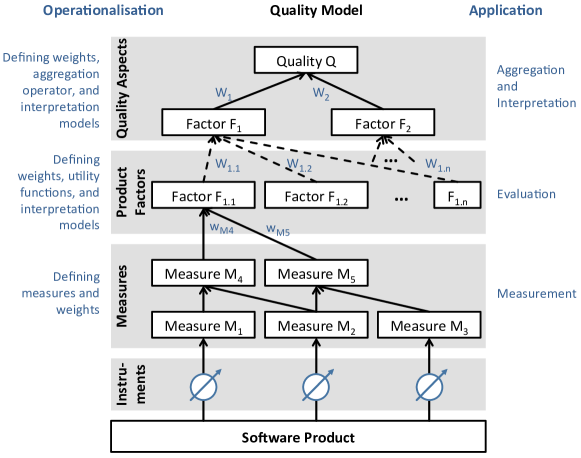
The quality assessment procedure comprises four basic steps: measurement, evaluation, aggregation, and interpretation. Measurement consists of the collection of measurement data for the factors specified at the lowest level of the quality model’s hierarchy according to the measures defined in the quality model. Evaluation comprises the determination of factor utility values for individual factors based on the collected measurement data. Aggregation comprises the synthesis of utilities obtained on individual factors into the total utility of a product under assessment. Finally, interpretation is the translation of the relatively abstract utility values into a quality assessment value that is intuitive for human decision makers. Before a quality assessment can be executed, it first needs to be operationalised. The measurement step may require defining additional measures to ensure that measurement data collected for the same measure across different products are comparable. The evaluation step requires defining utility functions to model the preferences of decision makers with respect to the measures defined for the factors. Aggregation requires defining the aggregation operator to synthesise the utilities of the individual factors across the quality model hierarchy into the total utility value. This includes assigning factors with numerical weights to reflect their relative importance to a decision maker during the aggregation. Finally, interpretation requires defining an interpretation model that will translate utility values into a quality assessment value that is intuitive for a human decision maker. Users of the quality model and the quality assessment method can (and should) perform operationalisation steps prior to quality assessment make the approach fit their specific context (e. g. they should adjust utility functions and factor weighting to reflect their specific preference regarding the importance of individual factors).
The Quamoco quality assessment method specifies both operationalisation of the quality model for the purpose of assessment and the quality assessment procedure. Figure 4 shows the basic steps of the model’s operationalisation (left side of the figure) and of the quality assessment procedure (right side of the figure) mapped onto the related elements of the quality model. These basic steps and their outputs correspond to the generic process of Multicriteria Decision Analysis (MCDA) (e. g. [24]).
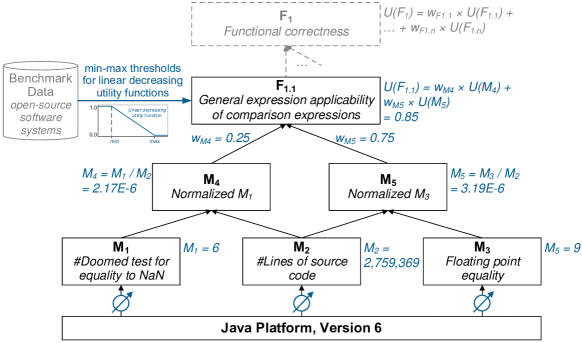
In the remainder of this section, we will discuss the basic operationalisation and assessment steps and illustrate them with an excerpt of the base model described in Section 4.2.1. Figure 5 presents the example quality model with a summary of the assessment results.
5.1.1 Measurement
We start the operationalisation by normalising the measures associated with the product factors. Normalisation is aimed at ensuring that the measurement data collected for the same measure are comparable across different products. For this purpose, we define normalisation measures. It has to be noted that cross-product comparability of the results may be negatively affected by the selected normalisation measure. For instance, the measure LOC will have different effects for products using different programming languages. Hence, we employ more abstract measures, such as number of classes, for normalising class-related measures, where appropriate.
In the application, we collect values for the measures and normalisation measures using the associated instruments, which can be manual or automatic. This step is well assisted by our tool support (Section 6.3) by running automated analysers, transforming all values into a uniform format, and normalising them.
Example
In the operationalisation step, we normalise the base measures which count the number of specific rule violations. We normalise the base measures : Doomed test for equality to NaN and : Floating point equality by the base measure : Lines of code into the derived measures and , respectively. Through normalisation, these measurements of and become comparable between software systems of different sizes. For the source code of the Java platform, version 6, we obtain , , and . Consequently and .
5.1.2 Evaluation
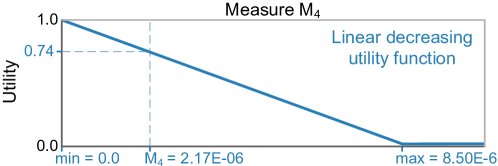
In the operationalisation step, we specify the evaluations for factors (Section 3.3). We define a utility function for each measure of a product factor at the lowest level of the quality model. These functions specify the utility each measure has in the context of the product factor with which it is associated. To ensure that the evaluation will be understandable, we use only simple linear increasing and decreasing functions with two thresholds min and max, which determine when the factor is associated with the minimal (0) and maximal utility (1).
Once we have decided on the type of function (decreasing or increasing), we determine the thresholds for the function using a benchmarking approach. The basic principle of benchmarking is to collect a measure for a (large) number of products (benchmarking base) and compare the measure’s value for the product under assessment to these values. This allows us to decide if the product has better, equally good or worse quality than other products. The details of how we determine the thresholds are described in the appendix.
During the application, we calculate the defined evaluations using the collected measurement data. Hence, we evaluate the utility of all product factors at the lowest level of the quality model.
A common requirement not addressed by most existing quality assessment approaches is how to cope with incomplete measurement data [16]. In case of incomplete inputs to the assessment, we assess quality using best-case and worst-case values for the missing data and express the uncertainty using the resulting range.
Example
To operationalise the evaluation step, we had to define utility functions for the measures and which are directly connected to the factor . The higher the value of each of these measures and the worse it is for software quality, the lower should be the associated utility. To reflect this, we selected simple decreasing linear utility functions. We derived and thresholds for the utility functions based on the benchmark measurement data from 120 open-source projects. The derived thresholds were and . (Figure 6) illustrates the utility function for the measure .
The utility function can then be used for deriving the utilities with which the measures and contribute to the factor . We calculate for measure (see Fig. 6) and .
5.1.3 Aggregation
During operationalisation, we assign numerical weights to the elements of the quality model, specifically to all quality aspects and product factors, and additionally to the measures that are assigned to the product factors defined at the lowest level of the quality model hierarchy. Numerical weights represent the relative importance of the adjacent elements of the quality model to the decision makers.
We suggest forming relevance rankings based on available data or expert opinion. We can then use the Rank-Order Centroid method [8] to automatically calculate the weights from the relevance ranking according to the Swing approach [26].
During application, we use the weights in the bottom-up synthesis of factor utilities along the hierarchy of the quality model. For this purpose, we need an appropriate aggregation operator. We use a weighted sum operator as an easily understandable and relatively robust aggregation approach.
Example
In the operationalisation step the aggregation operator is selected and appropriate importance weights are assigned to factors and quality aspects in the quality model. In our example, we used simple weighted sum aggregation. Weights assigned to factors (and quality aspects) quantify how important the factor is in the quality model relative to its sibling factors. That is, factors that have the same direct parent in the quality model hierarchy. The importance of the i-th factor relative to its sibling factors is measured as the cardinal weight such that: and the weight across all sibling factors (including the i-th factor) sums up to 1. In our example was rated as three times less important for : General expression applicability of comparison expressions than the second measure . The calculated importance weights are thus and .
The aggregated utility of factor is calculated as follows: . The same aggregation principle would be applied for higher levels of the quality model, e. g. for : Functional correctness the aggregated utility would be . Yet, for the sake of simplicity, we limit our example to the level of factor .
5.1.4 Interpretation
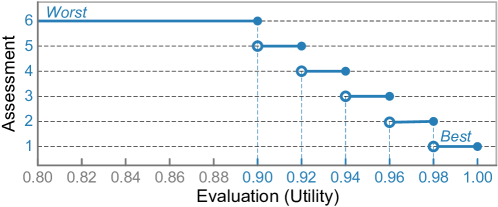
The activities described in the previous sections support the decision maker in interpreting a factor’s utility, for example, if it is high or low. The objective of interpretation is to map the ratio-scale utility onto a more intuitive scale, for instance onto an ordinal scale of school grades or traffic lights. During operationalisation, we define the form of the interpretation model.
Figure 7 illustrates our proposed interpretation model for which we chose the metaphor of school grades. The thresholds used in the model correspond to the coefficients used in German schools to convert students’ performance scores assigned for spelling tests. More than 10% incorrectly spelled words disqualify the test with the worst grade of 6. We adopt this scale for the purpose of quality assessment by decreasing the quality grades by one every 2% until the best possible grade of 1 is reached.
This step should be further supported by visualisations that prevents the assessor from getting lost in the detailed quality model and its assessment results. For example, a sunburst diagram enables a focused investigation across several hierarchy layers, or a Kiviat diagram helps to compare the results for different systems or subsystems.
Example
In the operationalisation step, we select the interpretation model that will be used for converting relatively incomprehensible utility values into a quality assessment understandable for human experts in the specific context of quality assessment. In our example, we selected a German school grades model which maps the percentage of task fulfilment ranging between 0% and 100% onto a 6-point grade scale. The advantage of this model is that the source scale 0-100% corresponds to the utility scale 0-1 and school grades are intuitive for every human expert (considering country-specific grading systems).
Following the interpretation model in school grades (Figure 7), a utility of 0.82 for F1.1: Functional correctness gives a grade of 6 (worst).
5.2 Operationalisation of the Base Model
We performed the entire operationalisation of the assessment steps already for the base model; so it is readily available for assessments. This was done as part of the base model development (Section 4.1). The operationalisation may still need to be adapted for specific contexts but can provide a quick idea of a system’s quality.
For the measurement step, two of our experts reviewed each measure to determine an appropriate normalisation measure based on a defined set of rules.
In the evaluation step, we performed benchmarking on open source systems. We calibrated the C# part of the base model with 23 open source systems, which we manually prepared for the quality assessment. For the Java module of the base model, we used the repository SDS [5] as a benchmarking base.
According to [30], in an optimal benchmark base, not only the programming language is important for the selection of proper benchmarking projects, but the size and application domain should also be considered. The SDS repository contains about 18,000 open-source Java projects. These projects were mostly retrieved from open-source databases such as Sourceforge via a web-crawling approach. In essence, this repository contains mirrors of the version control repositories. Thus, these repositories usually contain not only the most recent version of a software but also branches and tags.
For benchmarking, we prefer using only one version of each software project, and hence we decided to use the most recent one. For finding the most recent one, we used a heuristic that is able to handle the most commonly used directory structures for Java projects. If there is a directory called “trunk”, then this is used; otherwise the root directory is used. The heuristic is also able to handle a directory structure where the root directory contains multiple Java projects in single directories, each of them containing a directory named “trunk”. Given that these are the most commonly used directory structures for Java projects, we conclude that the heuristic should work in most cases. Moreover, we manually verified it for a dozen projects.
The SDS repository only contains the source code, but not the binaries. For certain quality measurements (e. g. FindBugs), however, binaries compiled with the debug option of the Java compiler are needed. We compiled all systems in a batch approach because the effort for manually configuring and compiling them is prohibitive. The compilation of all systems took about 30 hours, executed in parallel on 12 PCs. Of all available systems, about 6,000 were compiled successfully. Others could not be compiled because of missing external libraries or because code needed to be generated during the build process.
To get a representative set of systems from the remaining 6,000 systems, we randomly selected systems of different size classes. We know the distribution of systems in different size classes from [79] and selected systems accordingly: 39 systems were larger than 100 kLoC, 42 systems were between 10 and 100 kLoC, and 19 systems were between 5 and 10 kLoC. Since the SDS repository contained no systems larger than 250 kLoC, we included 10 systems of this size class that were available within the consortium. Most of the used systems were open-source systems and, hence, might not be representative of commercial software. Yet, we do not see any possibility to perform such an approach with commercial systems because we would not be able to get a reasonable number. Furthermore, with open systems, the analysis can be easily repeated and replicated.
We automatically calculated the thresholds for the linear distributions using the approach described in the appendix. Finally, two of our experts reviewed these thresholds for each measure by benchmarking them together with supporting descriptive statistics for plausibility.
In the aggregation step, we had to define weights. For the quality aspects, we extracted the relative importance of the quality aspects from the results of a survey done by us [78] that had more than 100 responses. For example, functional suitability and reliability were considered very important, while portability and accessibility were considered less important. For all other elements – i. e. measures assigned to product factors and impacts targeting quality aspects – we used our regular workshops and sprints to determine relevance rankings.
In the interpretation step, we used the model described above based on school grades. To investigate the interpretation model’s discriminative power (IEEE 1061) for assessments with the base model, we also exploited the results from these 120 systems. As we randomly selected systems from a large number of systems, we expected wide differentiation in the quality assessment results. The interpretation model fulfilled this expectation in that the results have a wide spread: The assessments distributed the sample systems across the entire range of the interpretation scale (grades 1–6) with only few systems being assessed at the extreme ends of the scale (very good or very bad) and a slight tendency towards good assessment results (1: 9%, 2: 37%, 3: 31%, 4: 13%, 5: 6%, 6: 4%). The distribution of the results also fits well with the typical distribution expected for German school tests and is therefore in concordance with the selected interpretation metaphor.
6 Tool Support
We developed a comprehensive tool chain for the application of the Quamoco approach in software projects. The tooling supports building and editing quality models, adapting a quality model to organisation- or project-specific needs, assessing software systems according to a quality model, and, finally, visualising the results of a quality assessment. The tool support presented here is available from the Quamoco website151515http://www.quamoco.de/tools.
6.1 Quality Model Editor
The quality model editor is built on the Eclipse Platform and the Eclipse Modeling Framework. It allows editing quality models that conform to the Quamoco meta quality model. To support the modularisation concept, each module of a quality model is stored in a separate file. The content of the model can be navigated via different tree views, which allow form-based editing of the attributes of model elements.
Validation during editing helps the modeller create models that adhere to meta-model constraints, consistency rules, and modelling best practices. A simple validation rule checks for unreferenced model elements. A more sophisticated rule ensures that for model elements referenced in other modules, an appropriate requires dependency between the modules is defined. The editor employs the Eclipse marker mechanism for displaying error and warning messages in a list and provides navigation to affected elements. The user is further assisted by an online help feature that displays context-sensitive help content depending on the current selection in the editor. The help texts explain the concepts of the meta quality model and contain a guideline with best practices for quality modelling.
The editor also supports several steps of the assessment method (Section 5.1). All operationalisation activities take place in the quality model editor, such as the definition of measures, utility functions or weights. Furthermore, it allows running the assessment engine (Section 6.3) on a given quality model and load the results for visualisation (Section 6.4).
6.2 Adaptation Support
Since quality depends on the context, e. g. the distinctive characteristics of a domain or technology, a quality model needs to be adapted to its environment. The meta-model and the modularisation concept provide the necessary foundations separating contents for different contexts. To support efficient and consistent adaptations beyond modules, we additionally provide an adaptation method [43] and tooling.
The adaptation approach provides a set of rules and automation based on the premise that all quality models used and produced have their structure defined by the meta quality model. It can be used to adapt quality models at different abstraction levels (such as general-use models, organisation-level models, or project-level models). The adaptation approach explicitly considers the goal and context of the model used to perform initial adaptation; subsequently, adaptation tasks are generated to obtain a consistent and complete model.
The steps for adapting a quality model are:
-
1.
Define the goal of the resulting model based on the organisation/project context and its software quality needs
-
2.
Identify an existing quality model that best matches the target model’s goal defined in the previous step
-
3.
Perform automated pre-tailoring by eliminating all unneeded elements (all elements that do not satisfy the model’s goal)
-
4.
Adapt the model in an iterative manner until it satisfies the identified goal which implies adjusting the remaining elements and, where needed, adding new elements to the model
The adaptation approach of Quamoco is implemented in a plugin for the model editor called the adaptation wizard, which consists of a series of dialogs that guide the user through the whole adaptation of a quality model. The first step consists of specifying the goal of the model meaning the type of artefacts that the model should be applied to, the perspective (e. g. management or customer), the quality focus (i. e. the key quality aspects that should be addressed in the model) and its context (e. g. paradigm or programming language).
Using this goal, the adaptation wizard searches the workspace for models that match the specified goal. The goals of existing models are extracted from their content. For example, the existing factors are used for matching the quality focus. The context is extracted from the modules and from text tags that can be given to any of the elements. Text tags may include many different things describing the context, such as domain (e. g. railway, medical devices, embedded systems, information systems), methodologies, practices, or technologies supported (e. g. component-based software development, agile development, open source software, custom development, C++, Java and automatic measurement tools). Text tags are assigned manually. Many elements can be tagged simultaneously. Per default, the base model is available for adaptation. When the base model is selected for adaptation, all its elements are automatically tagged in accordance with the modules they belong to. Other general-use models, organisation-level models, or project-level models can be added to the workspace by manually importing them using the structure provided by the meta-model.
The person performing the adaptation is guided by the tool in choosing the best matching model and selecting relevant elements. Irrelevant elements are eliminated automatically. For example, if a product factor is not selected as relevant, it is deleted, as are its impact-relationships to any quality aspect. The wizard can be configured to execute the process top-down, beginning with the selection of factors or entities, or bottom-up, beginning with the selection of measures.
Once irrelevant elements have been removed, the wizard uses the previous actions and the model’s goal to generate a list of further adjustments needed to satisfy the model’s goal and scope. The required adjustments are presented as a list of adaptation tasks, which includes reviewing, adding, and modifying specific model elements (adaptation tasks view). These tasks need to be performed manually, as they involve some decision making from the person performing the quality model adaptation. For example, if a measure is added, it needs to be marked as a normalisation measure or a factor needs to be associated with it.
All changes are documented and shown in the adaptation history view, which also lists the justifications for changes that are automatically generated and can be extended by the user. The adaptation history is a good basis for reviewing and judging the modifications performed and can thus serve as input for future quality model certification activities.
6.3 Quality Assessment Engine
The quality assessment engine automates the application activities of the assessment method (Section 5.1). It is built on top of the quality assessment toolkit ConQAT which allows creating quality dashboards by integrating various quality metrics and state-of-the-art static code analysis tools.
The connection between quality modelling and assessment is achieved through the automated generation of a ConQAT analysis configuration from a quality model. For the assessment of a software system, the quality assessment engine is provided with the adapted quality model, the source code of the software system to be assessed, the generated ConQAT configuration, and manual measurement results stored in an Excel file. This allows extending the tooling with custom analyses needed for assessments based on extensions to the base model.
For reasons of convenience, the editor supports direct execution of the assessment for the base model by specifying the location of the software system to be analysed. The output of the quality assessment engine has two formats. The first is an HTML report which allows inspecting the results of an assessment from within a browser, thus not requiring the tooling and the quality model. The second output format is a result data file, which can be imported into the editor for interactive inspection of the results. To detect decays in quality as early as possible, the quality assessment engine can also be run in batch mode, which allows us to include it into a continuous integration environment.
6.4 Visualisation
Once the result data file produced by the quality assessment engine has been imported into the quality model editor, a number of visualisations support a detailed analysis of the assessment, for example, for tracking quality issues from abstract quality aspects to concrete measures.
For example, a sunburst visualisation (Figure 8) of the results provides an overview of the assessed factors and their impacts by showing the complete hierarchy of the model all at once. Each segment in the chart corresponds to a factor in the quality model with the angle of a segment denoting the factor’s importance. The hierarchy is given by the segment’s adjacent positioning from the centre outwards. The colour of a segment visualises the assessment result for the assessed system. The colour range from green via yellow to red indicates good, average, or bad results. To improve comprehensibility, it is possible to zoom into a factor, which maximises the space occupied by that factor in the visualisation.
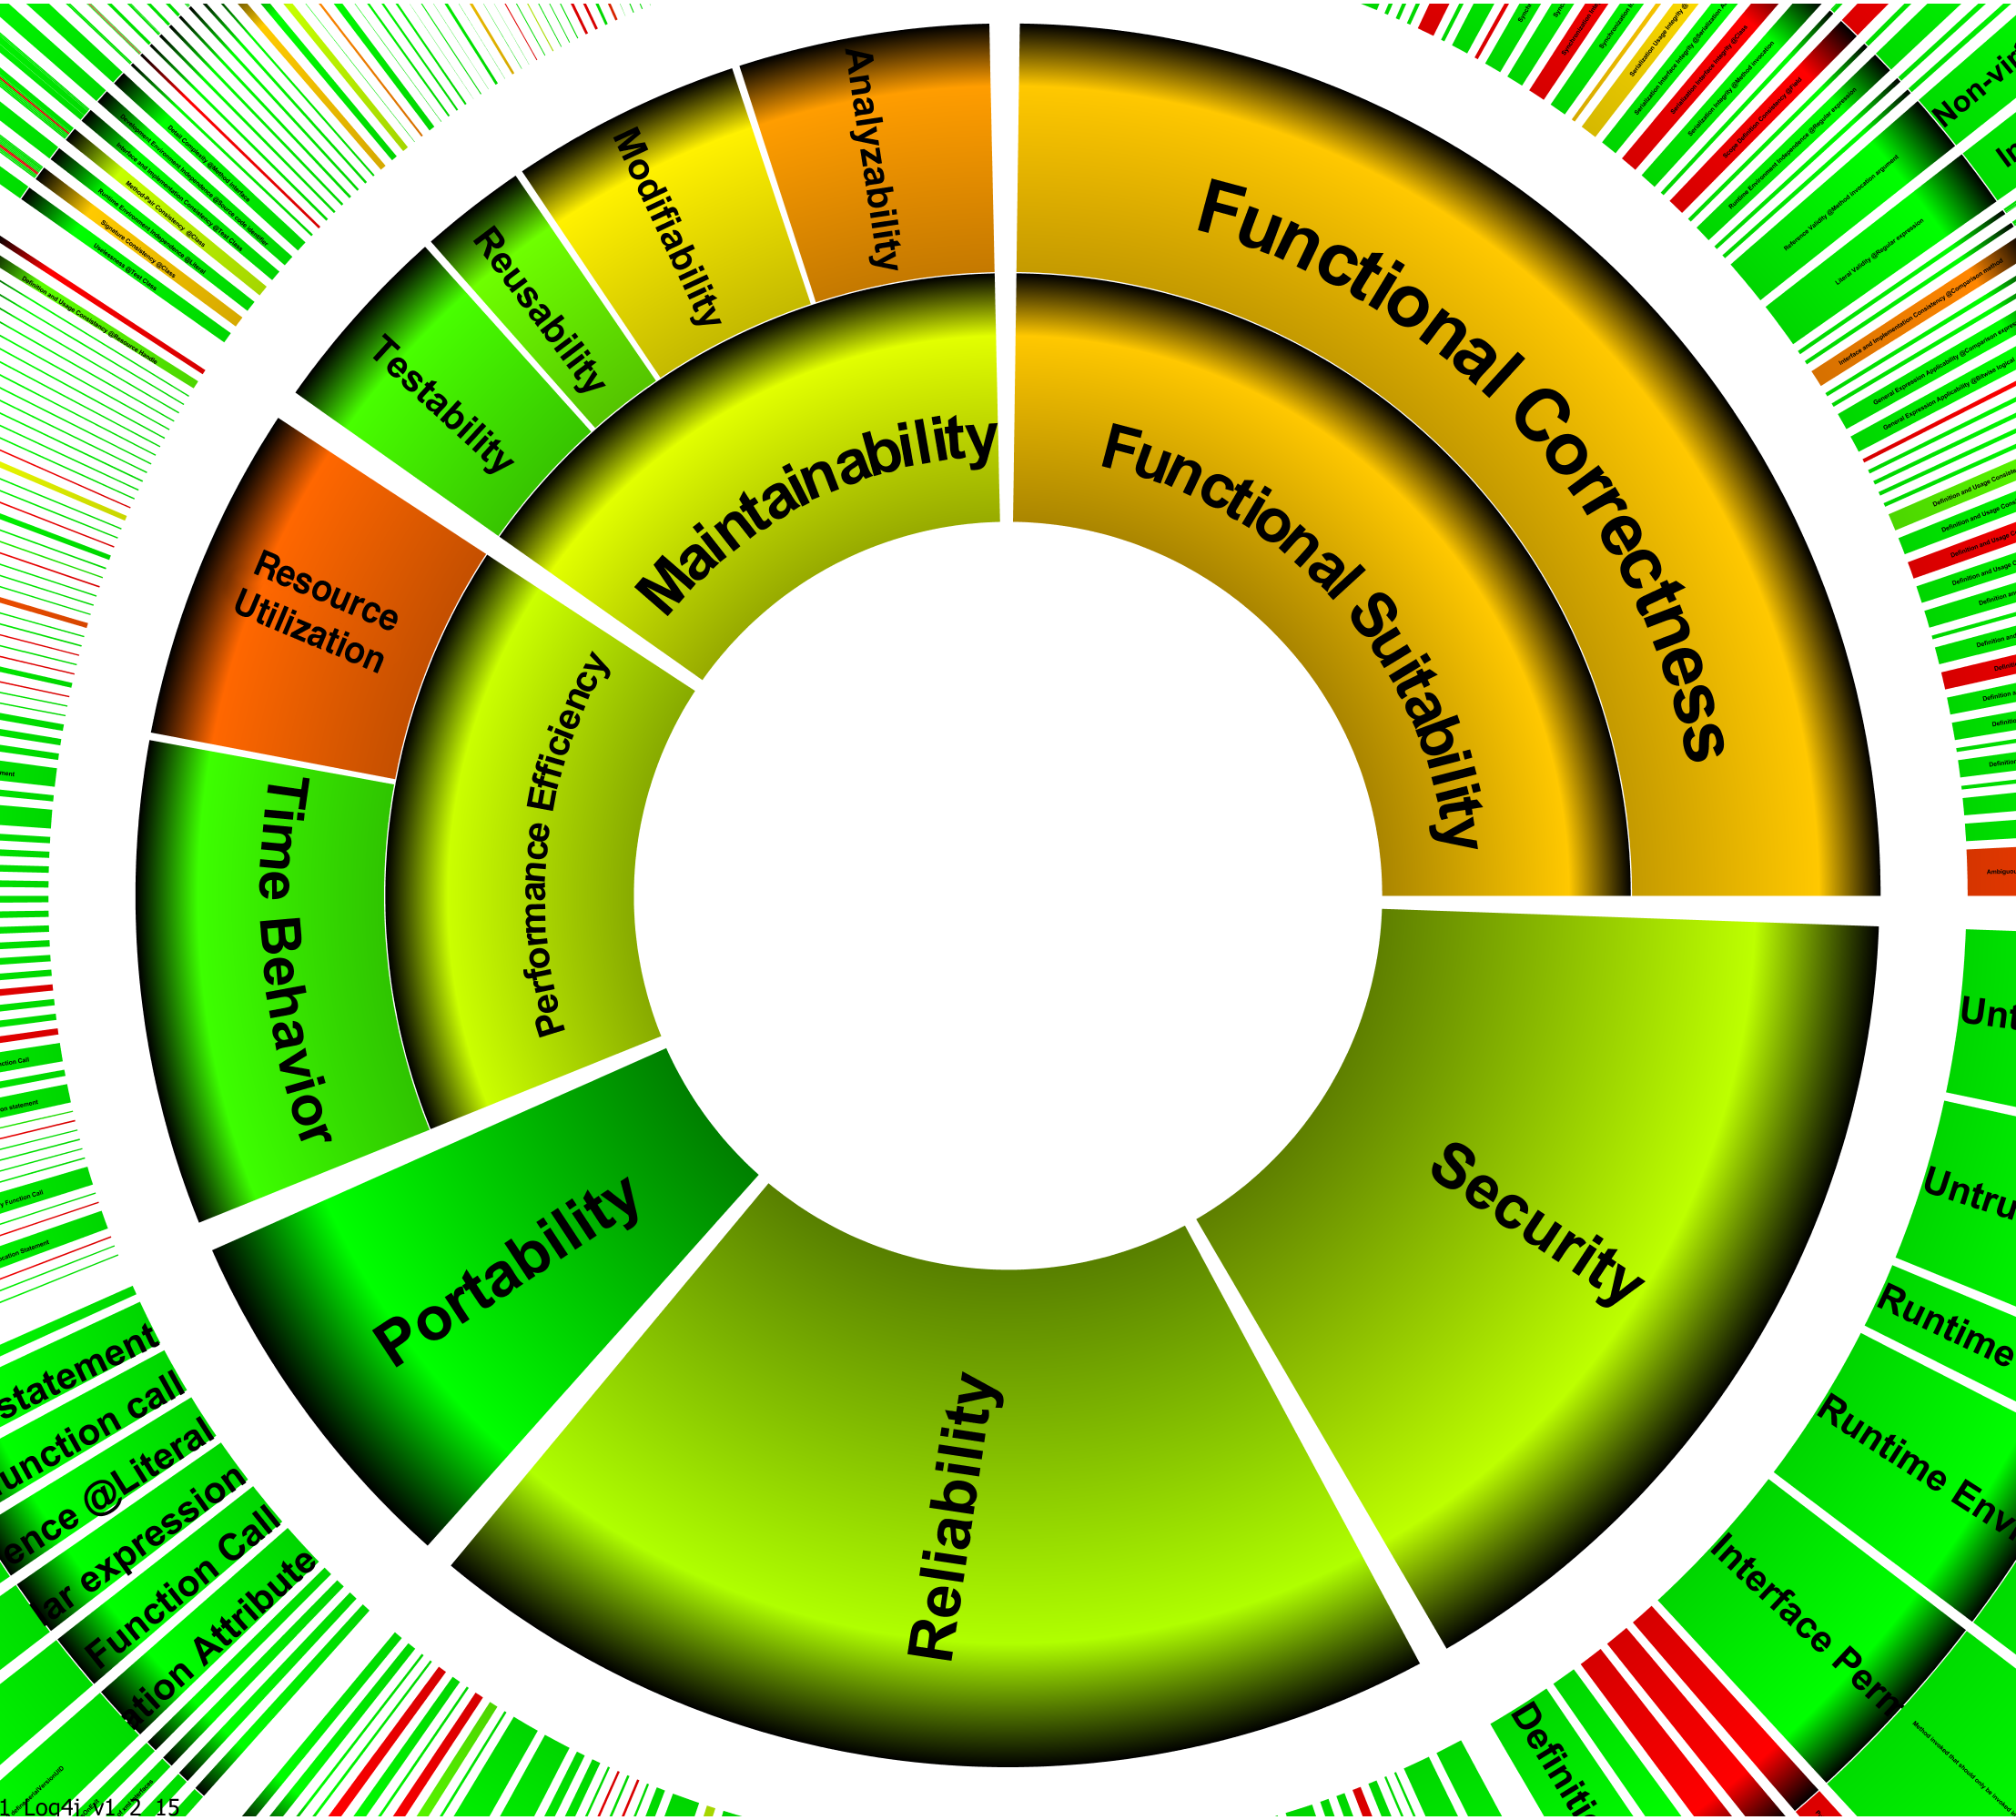
A Kiviat diagram (Figure 9) offers an alternative high-level visualisation of the assessment results. It specifically aims at supporting the comparison of quality assessments for multiple systems (or multiple versions of the same system). The spokes in the diagram correspond to the top-level factors in the quality model and the coloured data points correspond to the factor assessment results for the systems. This visualisation allows quickly spotting those quality aspects where the assessed systems differ.
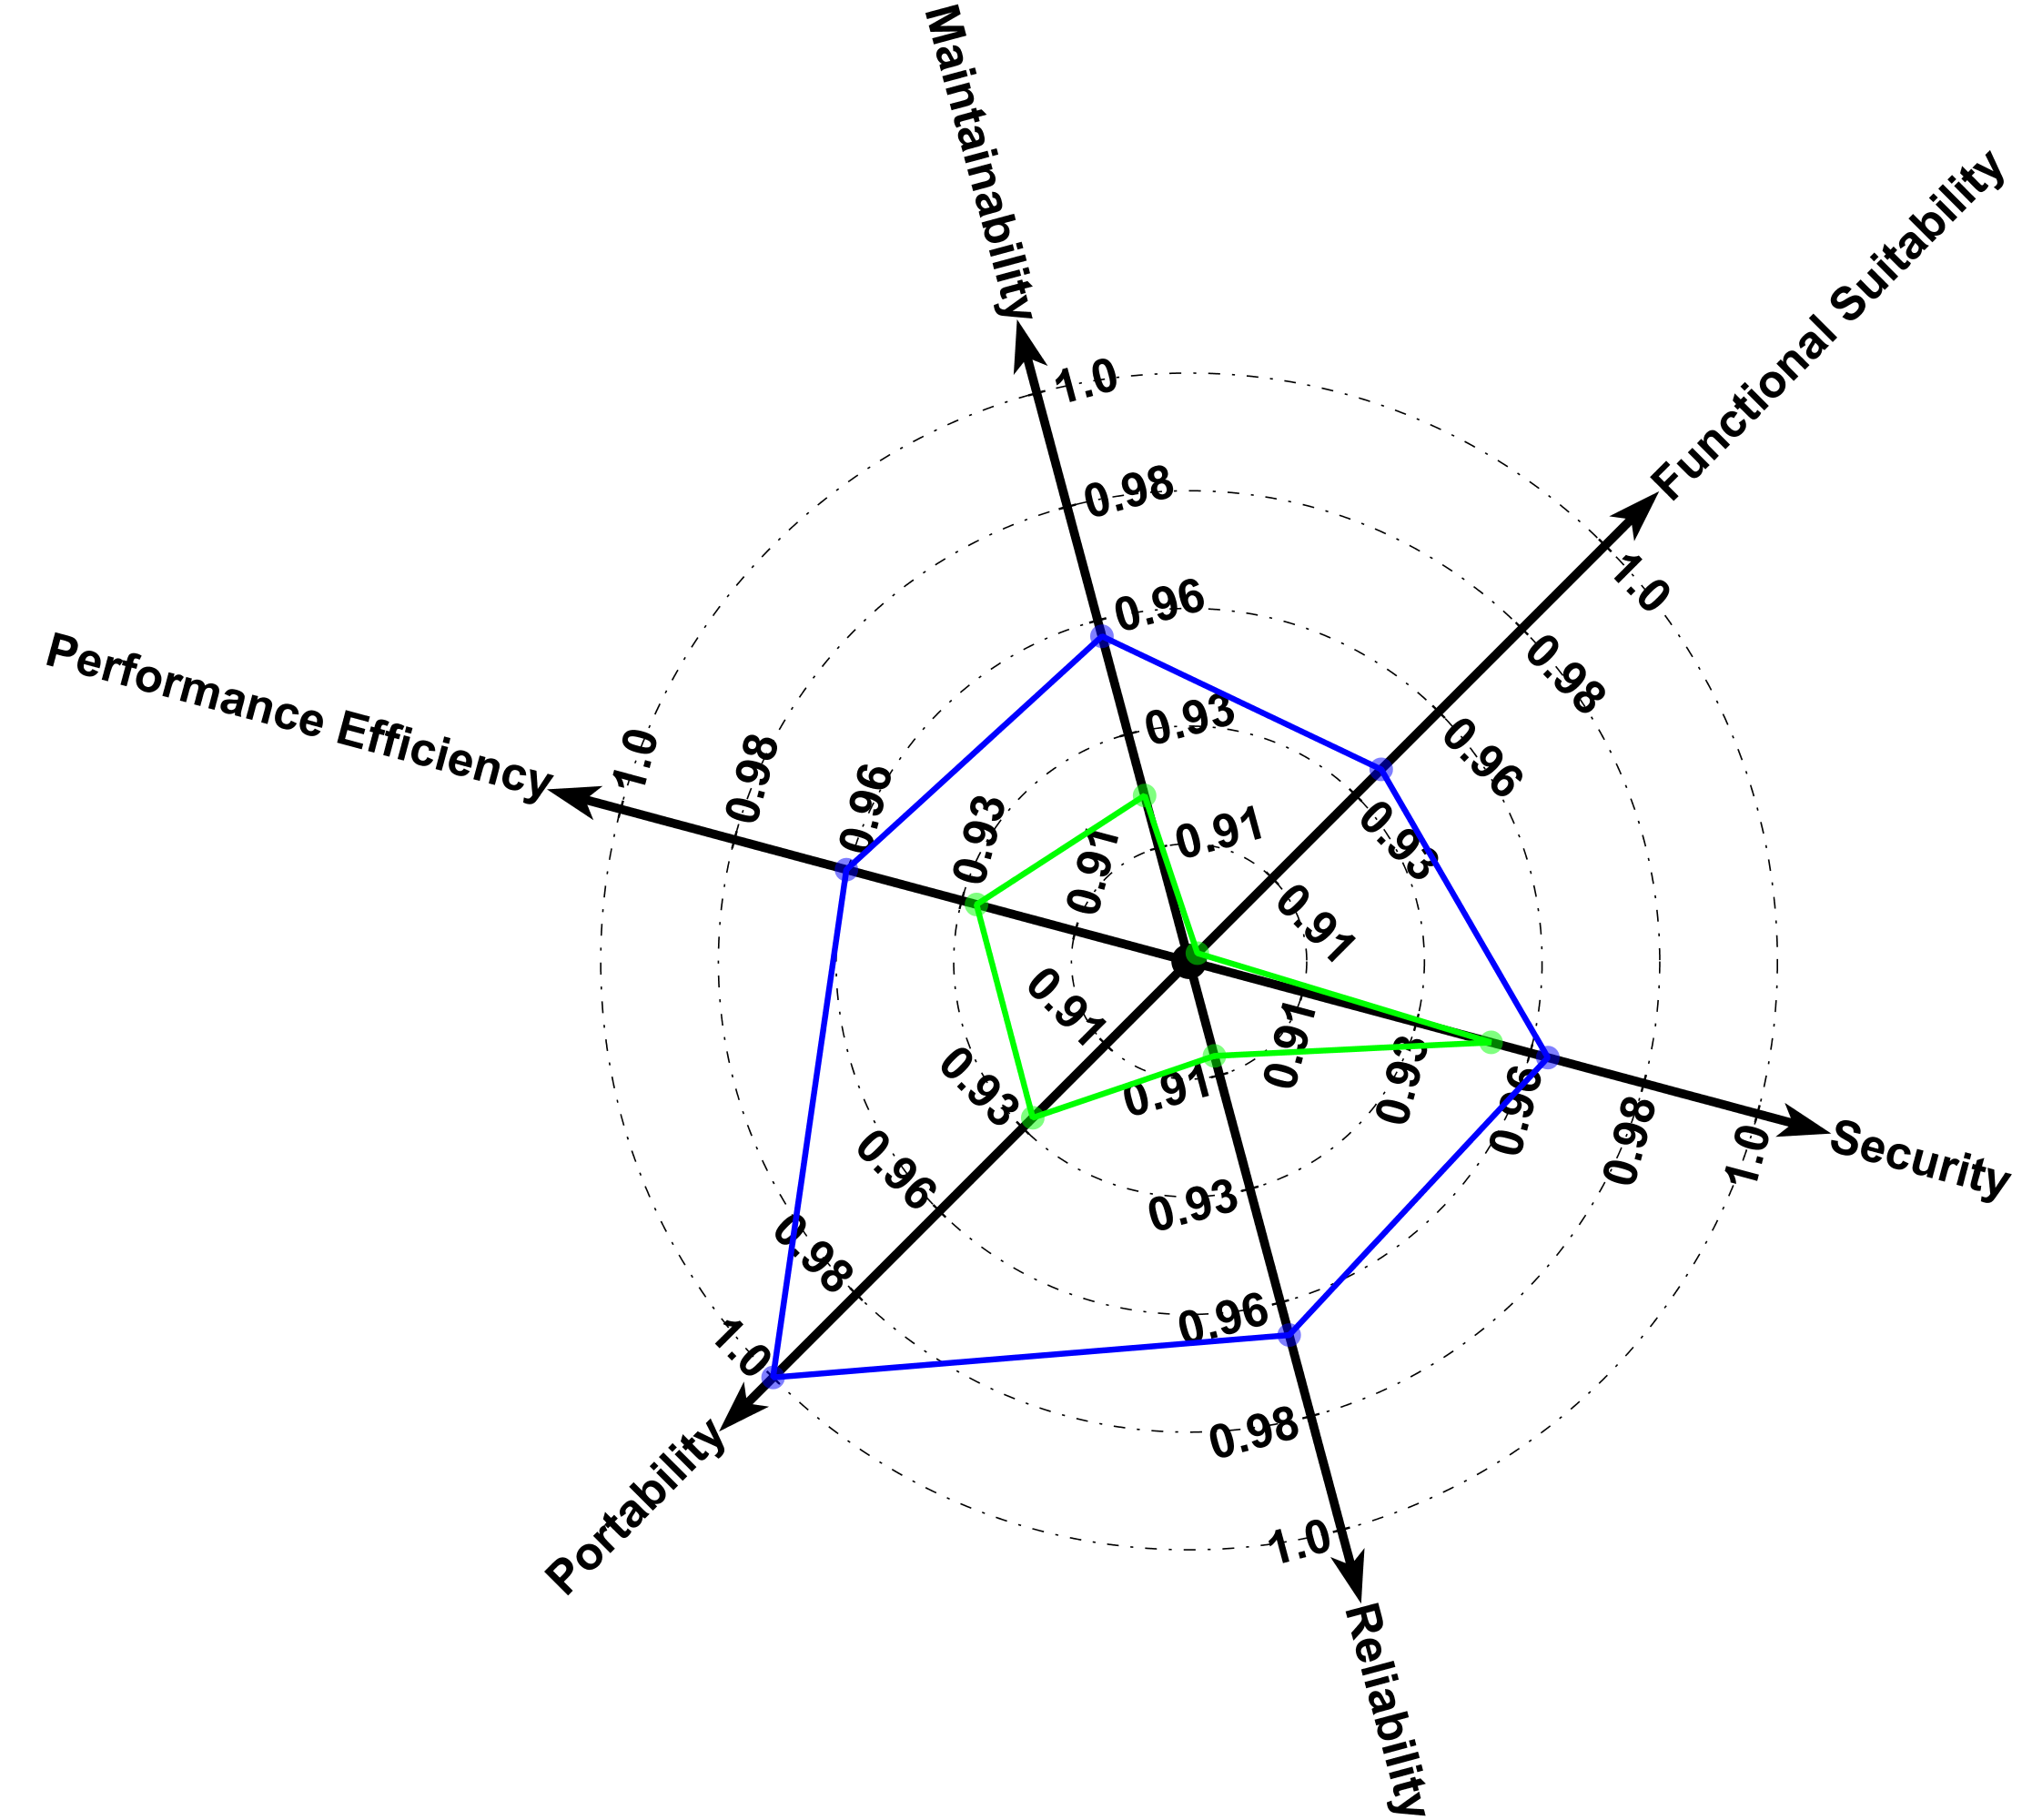
7 Empirical Validation
This section presents the empirical validation of the base model. We focus on the Java model because only this model was thoroughly calibrated, as explained in Section 5.2. We consider the calibration of the C# model as weak because we had only a dataset of 23 systems; thus, we exclude this part of the model from the empirical validation.
In the following subsections, we investigate the Java base model and its quality assessments using three research questions:
RQ 1: Does the base model provide valid assessment results regarding the quality of software systems?
RQ 2: Can the base model be used to detect quality improvements over time in a software system?
RQ 3: Is the approach of assessing quality using the base model accepted by practitioners?
Research questions RQ 1 and RQ 2 address the usefulness of the Quamoco approach from a technical point of view: They check whether the Quamoco approach provides valid assessment results in the context of typical application scenarios. RQ 3 focuses on the usefulness and applicability of the approach as perceived by practitioners.
We limit the evaluation scope of RQ 1 and RQ 2 to overall quality assessment results. In practice, a statement on overall quality is important, for example, to identify software products or releases with low quality (cf. RQ1) or to get an early warning if the quality of a product in the company portfolio decreases. It can also be used to control the success of quality improvement initiatives (cf. RQ2).
In each subsection, we first present the study goal and then the research design chosen for the study; next, we describe the execution of the study and its results. Finally, each section closes with a discussion of the results and the most relevant threats to validity. The raw data for all the validations are available upon request. Where possible, we made it available in [74].
7.1 Comparison of Software Products
To answer RQ 1, we have to evaluate whether the base model provides valid assessment results, meaning that the assessment results are in concordance with the results obtained by another independent and valid approach for assessing product quality. Checking criterion validity is also a common approach in other scientific disciplines (e.g., psychology) when introducing new measurement instruments to quantify an abstract concept such as quality.
7.1.1 Design
To evaluate the validity of the quality assessments, we need an independently obtained criterion for product quality that we can compare with our assessment results. Since no measurement data were available that directly measure quality for a set of software products that we could assess using the base model, we utilised expert-based quality judgments as the independent criterion.
For the comparison of different software products, we used the quality rating obtained in the Linzer Software-Verkostung [30] for a set of five open source Java products. The Linzer Software-Verkostung was directed and carried out by a member of the Quamoco team before the start of the Quamoco project. Due to the involvement of a member of the Quamoco team, we had access to all detail data gathered during the experiment. The rating in the Linzer Software-Verkostung is a ranking of the five Java systems based on a combination of ratings provided independently by nine experienced Java experts.
For a serious evaluation of Java source code it is necessary for each expert to have not only experience in software development or software quality management, but to also be familiar with the programming language itself. During the selection process for the Verkostung, we paid attention to the experience, background and environment of potential experts. Because each expert needs time to provide a reasonable and independent quality evaluation for each software product, only five systems could be considered as data points in the comparison. Although, from a scientific point of view, it would be preferable to have more data points to increase the probability of obtaining statistically significant results, from a practical point of view this could not be realised in the presented study. In the end, nine experts were accepted for the Linzer Software-Verkostung. Each participant had at least seven years of experience in software development.
Evaluation criterion and hypotheses: To measure validity and ensure comparability with other studies, we used the validity criteria proposed in the IEEE standard 1061 for validating software quality metrics. The standard proposes a set of criteria, but most of them assume that the collected measures and the independent criterion both use an interval or ratio scale; only one can also be applied to ordinal scale data. In our case, the results of the base model assessments were provided as a value characterising the product quality between grade 1 (best possible) and grade 6 (worst possible) on a ratio scale and the assessment results of the expert judgements were provided on an ordinal scale as a ranking from best (rank 1) to worst (rank 5) product. Consequently, we had to limit our investigation to the validity criterion consistency (cf. IEEE 1061) which can be applied to ordinal-scale data. In our case, it characterises the concordance between the product ranking based on the assessment results provided by our model and the ranking provided independently by a group of experts. This means that we determined whether the base model could accurately rank the set of assessed products/subsystems with respect to their quality (as perceived by experts) and is thus valide regarding this external validity criterion.
Following the suggestion of IEEE 1061, we measured consistency by computing the Spearman’s rank correlation coefficient (r) between both rankings where a high positive correlation means high consistency between the two rankings. Since we wanted to check whether a potentially observed positive correlation was just due to chance or was a result of using an appropriate quality model, we stated hypothesis (and the corresponding null hypothesis ). We tested both with the confidence level 0.95 ( = 0.05):
: There is a positive correlation between the ranking of the systems provided by the base model (BM) and the ranking of the systems provided by the experts during the Linzer Software-Verkostung (LSV).
7.1.2 Execution
We used the Java part of the base model to assess the quality of five open source products for which independent expert-based assessment results of the Linzer Software-Verkostung were available: JabRef, TV-Browser, RSSOwl, Log4j, and Checkstyle. In this context, it was necessary to collect the manual measures defined in the base quality model for the selected open source products. We used the measurement specifications provided by the base model and collected measurement data for all five products. The collected measurement data was independently reviewed before assessing the products. We ordered the assessed products by the results for their overall quality provided by the base model and compared them with the ranking provided by the Linzer Software-Verkostung.
The nine experts of the Linzer Software-Verkostung were guided by a questionnaire that forced them to concentrate on the quality attributes analysability, craftsmanship, reliability, and structuredness – thus a combination of maintainability and reliability topics. Each of these quality attributes was explicitly defined in the questionnaire. Additionally, we provided an ordinal scale for evaluation. For this ordinal scale, we gave an explanation as to the conditions under which to use which rating.
7.1.3 Results
Table 5 shows the resulting grade and product ranking for the base model assessment as well as the ranking from the Linzer Software-Verkostung. Although the base model did not provide exactly the same ranking as the experts, the calculated Spearman’s rho correlation is r = 0.9, which is close to a perfect correlation of 1. The reason is that the two systems with different ranking results have ranking results close to each other – only their places are switched. Hypothesis can also be accepted with a p-value of 0.05, meaning that there is a significant positive correlation between the ranking provided by the base model and the ranking provided by the Linzer Software-Verkostung.
| Product | LOC | Grade BM | Rank BM | Rank LSV |
|---|---|---|---|---|
| Checkstyle | 57,213 | 1.87 | 1 | 1 |
| RSSOwl | 82,258 | 3.14 | 2 | 3 |
| Log4j | 30,676 | 3.36 | 3 | 2 |
| TV-Browser | 125,874 | 4.02 | 4 | 4 |
| JabRef | 96,749 | 5.47 | 5 | 5 |
7.1.4 Interpretation
The assessments of the overall product quality for the five investigated systems turned out to be largely consistent and thus valid when compared to an independent criterion for quality, in this case provided in the form of an expert-based assessment. It is important to understand that the assessment results are based on the overall calculated results for all measures and product factors. We did not explicitly test whether the same results could be obtained with a smaller number of measures or product factors, as in our understanding the factors and measures we consider in our quality model represent real quality requirements regardless of the numerical impact on the evaluation results.
7.1.5 Threats to Validity
Conclusion Validity. The generalisability of our results is limited by the fact that the scope of the empirical validation was limited to five medium-sized open source systems written in Java.
Internal Validity. We cannot fully guarantee that the criterion chosen for the validation, namely the expert-based quality rating, adequately represents the quality of the products. Nevertheless, if we consider the ranking of the projects by the experts and calculate Kendall’s W concordance coefficient, we get a value of 0.6635, meaning that there is a strong concordance of the rankings of the individual experts with a significance level of . We therefore can safely assume that the quality rating of the experts reflects the common understanding of internal software quality.
Construct Validity. In the Linzer Software-Verkostung the experts were guided by a questionnaire that contained the quality attributes to be considered in the expert-ranking. To reduce ambiguities or misunderstandings, the quality attributes were explicitly defined.
External Validity. The experts of the Linzer Software-Verkostung were carefully selected, i.e. only experts with significant experience (7+ years of development experience in industry) were part of the experimental setting and therefore manifest a high level of quality awareness. The study was based on open-source software and did not consider industrial strength software. This is a threat to validity as we know from other work [56] that there are, for example, significant differences in internal software quality between safety-critical and non-safety-critical software. We therefore cannot conclude whether our approach would also hold for safety critical systems.
7.2 Sensing Quality Improvements
In a second study, we knew from the quality experts of the project that they had invested effort into enhancing the maintainability of the system. In this study from the automation domain (steel production), we analysed four versions of the Java software using our base model. The major goal was to validate whether our base model would reflect the assumed quality improvements claimed by the quality managers (RQ 2). Thus, the validation should also show to some extent whether our base model reflects the common understanding of quality (in the context of maintenance) of experienced developers.
7.2.1 Design
To carry out this study, we performed an ex-post analysis of several versions of a software product, where the responsible technical product manager stated that the project team explicitly improved quality starting right after the rollout of version 2.0.1. The quality improvements were not directed by static code analysis tools at all but by the experience of the software developers.
7.2.2 Execution
We used the base model to assess the quality of four versions of the software product, including all four versions between 2.0.1 and 2.2.1, in our analysis. We presented the results to the project team and asked for their feedback by means of an interview. As the project team had no concerns about the results, further investigations were not necessary.
7.2.3 Results
Table 6 shows the results of the assessment using the base model. The first column shows the version number of the software, the second column shows the corresponding calculated quality grade.
| Version | Grade BM |
|---|---|
| 2.0.1 | 3.63 |
| 2.0.2 | 3.42 |
| 2.1.0 | 3.27 |
| 2.2.1 | 3.17 |
The results show steady improvements (as expected) for versions 2.0.2, 2.1.0 and 2.2.1. Our assessments reveal an improvement of 0.46 from version 2.0.1 to version 2.2.1.
7.2.4 Interpretation
The developers relied on their understanding of software quality during the improvement. As the assessments using the base model also show an increase in quality, this is an indicator that the model reflects the quality understanding of experienced software engineers.
7.2.5 Threats to Validity
Conclusion Validity. The generalisability of our results is limited by the fact that we only had one project, where the improvements were carried out without the use of static code analysis tools but rather relied on the experience of the developers.
Internal Validity. A possible internal threat would be that the improvement activities were influenced by the base model or the findings of static analysis tools. We mitigated that risk by ensuring that the software developers of the project were neither involved in the development of the base model nor did they use static code analysis for their improvements.
Construct Validity. There is no threat to construct validity, as we analysed the project ex-post, i.e. there was no relation between the improvement actions and our analysis.
External Validity. The external validity of the results is limited by the fact that we had only access to one industry project where the software developers explicitly invested in quality without using static code analysis tools.
7.3 Acceptance by Practitioners
In this third study, we aimed to investigate the acceptance of the base model by practitioners, investigating perceived suitability and technology acceptance. We asked experts to assess a software system that was part of their direct work environment using the base model and interviewed them subsequently about their experience.
7.3.1 Design
We created a questionnaire for semi-structured interviews. To operationalise our study goal, we broke down the concepts to be characterised into sub-concepts. Perceived suitability contains four sub-concepts: Transparency of assessments is defined as the quality of the base model that enables the user to easily understand an assessment. Comprehensibility of quality definition is defined as the quality of the base model parts to be arranged logically and consistently. Consistency of results with own perception means that when the model is applied for the same software products, the quality assessments using the base model coincide with the assessments provided by experts. Finally, overall suitability judgment means that the base model meets the requirements for measuring and assessing quality. Technology acceptance groups perceived usefulness and perceived ease of use using a shortened version of the definition of Davis [17]. Comparison with ISO/IEC groups the sub-concepts ease of adoption and definition of quality.
A detailed operationalisation is shown in Table 7. For closed questions, a 5-point rating scale was used: -2: strongly disagree, -1: disagree, 0: neither agree nor disagree, 1: agree, and 2: strongly agree. After answering each closed question, the experts could give additional comments to extend their answers.
For all variables, we had the following hypotheses: and . With this we were able to test whether the experts significantly agreed with our statements.
7.3.2 Execution
We performed eight interviews. The participants had between 4 and 20 years of experience in software development; only one of them explicitly mentioned having experience in quality management. We chose the participants opportunistically based on personal contacts in the companies. Each interview was conducted separately and independently from the other interviews following four steps: introduction and training, quality model editor walk-through, evaluation result drill down, and closing.
During introduction and training (5–10 minutes), the interviewer briefly explained the Quamoco goals and status, the expert introduced him-/herself and his/her role, and the interviewer recorded the experience level. Then, the interviewer gave an overview of the interview process and an example of how the approach and the tool work.
During the model editor walkthrough (10–15 minutes), the interviewer explained the model’s high-level structure. Then the interviewer drilled down into examples and explained low-level elements.
The third part of the interviews consisted of asking the expert to assess, from his/her point of view, a system that was part of his/her direct work environment. The interviewer presented the base model assessment results of the system starting top-down with the overall quality result and drilling down into the factors of special interest to the expert (25–30 minutes).
The closing (5 minutes) consisted of letting the expert answer the questions regarding technology acceptance and practicability in comparison to ISO/IEC and make additional comments. We chose the quality model in ISO/IEC 25010 because it is based on the well-known 9126 and, therefore, provides us with a comparatively solid comparison point. If we were unable to improve beyond the standard in some way, it would not be advisable for practitioners to adopt our approach.
7.3.3 Results
The hypotheses were tested with one-sample Wilcoxon signed-ranks tests of location, with = 0.05. Table 7 shows the median, the test results161616Bold values are significant at 0.05., and the median absolute deviation (MAD) as a measure of variability in the provided answers.
| Items | Median | p | MAD |
|---|---|---|---|
| Perceived suitability | |||
| Comprehensibility of quality definition | |||
| Q1: The number of impacts associated with the currently assessed ISO/IEC 25000 factor is acceptable. | 1 | 0.128 | 0.5 |
| Q2: I agree with the justification of the relationship (impacts) from product hierarchy factors into ISO/IEC 25000 factors. | 1 | 0.017 | 0.0 |
| Q3: The number of measures associated with the impact factors of the currently assessed ISO/IEC 25000 factor is acceptable. | 1 | 0.128 | 1.0 |
| Q4: I agree that the measures actually measure the currently assessed impact factors. | 1 | 0.023 | 0.0 |
| Transparency of assessments | |||
| Q5: The calculation steps that lead to an assessment are transparent. | 1 | 0.003 | 0.0 |
| Q6: The assessment steps performed (e. g. aggregation, ranking) are familiar. | 1 | 0.017 | 0.0 |
| Q7: I understand the assessment steps and could explain them to someone else. | 1 | 0.007 | 0.0 |
| Consistency with own perception | |||
| Q8: I consider the assessment results provided by the base model valid, according to my opinion about the quality of the product. | 0 | 0.510 | 0.5 |
| Overall suitability judgement | |||
| Q9: I think this approach is suitable for measuring and evaluating software quality. | 1 | 0.004 | 0.0 |
| Comparison with ISO/IEC | |||
| Definition of quality | |||
| Q10: The base model has a more transparent definition of quality than ISO/IEC 9126/25000. | 2 | 0.012 | 0.0 |
| Ease of adoption | |||
| Q11: The base model could more easily be adopted to be applied in practice than ISO/IEC 9126/25000. | 2 | 0.017 | 0.0 |
| Technology acceptance | |||
| Perceived usefulness | |||
| Q12: Using the base model in my job would increase my productivity. | 0 | 0.510 | 0.0 |
| Perceived ease of use | |||
| Q13: I would find the base model easy to use. | 1 | 0.018 | 0.5 |
Perceived suitability: holds for all sub-aspects of transparency of assessments, i. e. assessments can be easily understood. holds for half of the sub-aspects of comprehensibility of the quality definition. does not hold for consistency with own perception; the assessments produced by the base model were considered neither appropriate nor inappropriate. holds for overall suitability, which means that the approach was considered suitable for measuring and evaluating software quality.
Technology acceptance: There was significant agreement that the model is easy to use, but there was no agreement about perceived usefulness.
Comparison with ISO/IEC: holds for all sub-aspects; in this case the median is 2: the reviewers strongly agreed that the base model could be adopted more easily for application in practice than ISO/IEC 9126/25000 and that the base model has a more transparent definition of quality than ISO/IEC 9126/25000.
Some interviewees gave additional comments, but we could not reasonably analyse them systematically, as they were very few. Instead, we used them to augment the quantitative results. The participants mentioned that the trustworthiness of third-party measurement tools may be a problem as well as the language independence of impacts, the precision of impact justifications, the subjectively determined rankings, the understandability of the rankings, the justification of the rankings, and the difficulty to understand how the calibration limits are obtained.
Favourable feedback included that the modelled relations are comprehensible and reasonable, that the impact justifications are reasonable and are a good idea, that school grades obtained by comparison with reference projects are a good idea, that the unification of different tools is good, and that using an ISO/IEC view is a good thing for managers. Moreover, the participants considered the whole approach as the best that can be done with static code analysis; as good for getting an overall view on the quality of a software product; as consistent; as an approach that clarifies software metrics; and as a good starting point for people who have not used ISO/IEC 9126/25000 before.
7.3.4 Interpretation
Overall, the interviewees followed our expectations and found the base model suitable, better in comparison to ISO/IEC 25000 and acceptable for their work. A threat in building operationalised and, therefore, large and detailed models with complex structures is that practitioners will not understand and accept them. We could mostly show the contrary here.
The first exception is whether the assessment result is valid. Opinion were mostly undecided, meaning that the experts were not sure about the validity. We assume this was most likely caused by the time constraints described in Section 7.3.2 and the fact that the base model was not adapted to the experts’ specific context. We have to investigate this further (e. g. by conducting a dedicated validity study offering more time). Since the experts were undecided, we conclude that this does not invalidate the base model. The second exception is that the interviewees were also undecided as to whether the base model would increase their productivity. This also needs further investigation but could be explained by the fact that most interviewees were developers who do not regularly perform quality assessments.
Regarding the number of elements in the base model (cf. Q1 and Q3), there was no broad consensus either. This can directly be explained by the low number of participants and the high number of elements in the quality model, combined with the uneven distribution of model elements across quality aspects (see Table 3). The participants answered these questions after assessing different subsets of the base model, so the answers have to be treated individually and an insignificant overall rating is not a threat to the acceptance of the base model as such.
7.3.5 Threats to Validity
Conclusion Validity. Because of the low number of participants, the results have low statistical power.
Internal Validity. The interviews were carried out independently of each other in terms of time and space. Nonetheless, we could not control interactions outside the interviews, with the potential consequence that the participants might have known about the interview contents beforehand (Contamination). The participants in the interviews came from industry; consequently, they represent practitioners. We cannot claim that the sample is representative (Selection). The participants did not only specialise in selected quality characteristics but also work as developers, which for some of them is the main role. This may be a threat to validity because their daily tasks involve quality assessment only indirectly. The same applies to the systems assessed, which were different for all participants according to their specific areas of expertise.
Construct Validity. Not all items used were validated. This may be a threat to validity because their meaning may be misunderstood (Explication of constructs). To mitigate this threat, domain experts reviewed the operationalisation of the questionnaire. Not all concepts used were measured using multiple items. This may be a threat to validity because some of them may have been measured only partially (Mono-method bias).
External Validity. For the interviews, the base model was shown using the quality model editor, which is not a tool used daily by the experts (Interaction of setting and item). To mitigate this threat, we asked the participants whether they understood each of the views provided by the tool presented during the model editor walkthrough. All participants understood the tool.
8 Specific Quality Model for Embedded Systems
One of the important properties of our meta-model (see Section 3.3) is the ability to extend the base model to adapt it to the needs of more specific programming languages or systems. To show this we developed a quality model for embedded systems (ESQM). In this section we present the content of the ESQM and validate it to find out whether the assessment results are in concordance with the results obtained by another independent approach (see Section 8.2). Furthermore we discuss (see Section 8.3) in more detail which parts of the base model could be reused.
The specific quality model ESQM enhances the base model with factors that are specific for embedded systems (details on the kind of extensions we made to the base model can be found in Section 8.3). In [55] we published the systematic development approach for ESQM, which was driven by capturing the requirements for embedded systems with a comprehensive literature analysis on commonly accepted guidelines and quality standards for embedded and safety-critical systems. In this paper, we put emphasis on the developed model and relate it to the base model to show that extending an existing model can help to ensure consistency and reduce effort for model construction. These guidelines and standards are a good source for eliciting specific embedded systems quality requirements as they directly provide (among other things) recommendations for embedded systems code quality.
We examined the umbrella standard for functional safety, IEC 61508 Part 3 [34], the standard for medical device software IEC 62304 [35], as well as the standard for railway applications EN 50128 [15]. These standards play a vital role for safety-critical (embedded) systems and have led to generic and programming language independent requirements. Additionally, we considered the MISRA C:2004 [58], MISRA C++:2008 [59] guidelines as well as the JSF AV C++ coding standards [40] for programming language-specific requirements elicitation. Ultimately, a total of 60 requirements emerged from these sources. Additionally, we provide information on the iterative validation cycles of the model in [55]. In this section we outline the resulting ESQM, sketch its validation, and investigate the model elements that are necessary in addition to the base model.
8.1 Contents
The excerpt in Figure 10 provides an overview of the ESQM. The measures quantify the product factors, which again refine other product factors or impact the requirements or the quality aspects. The model uses the modularisation concept of the meta-model and distinguishes between a C module, which is the core module, and a C++ module.
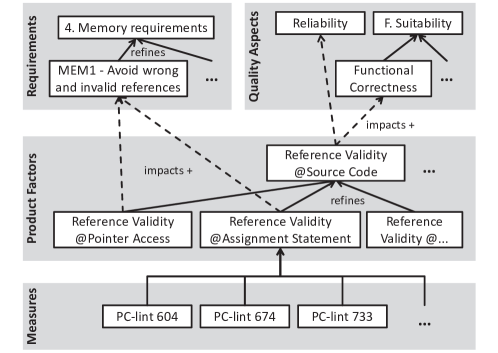
In total, we modelled 162 product factors on the leaf level of the product factor hierarchy with 336 measures. Besides systematically constructing product factors and operationalising them with measures, we also defined the impacts of the product factors on the requirements (177 impact relations) and on the ISO/IEC 25010 quality aspects (128 impact relations).
Furthermore, we also applied the assessment method defined in Section 5.1 and added evaluations for the ISO/IEC 25010 quality aspects and for the identified requirements. For the ISO/IEC 25010 quality aspects, aggregation functions are provided for all quality aspects, which allows us to calculate an overall quality statement for an embedded software system.
For the calibration of the linear evaluation functions for the measures, we collected normalised measurement data from 17 open source projects (8 written in C and 9 written in C++), identified potential outliers in the data using box plots, and took the minimum and maximum of the non-outlier values as the thresholds for the respective evaluation function.
8.2 Validation
We applied the validation concept criterion validity (see Table 1) to the ESQM as well to understand whether the assessment results are in concordance with the results obtained by another independent approach for assessing product quality. For this purpose, we compared the results of the automatic assessment for three industrial software products with the judgement of one expert who knows these three products well from a quality perspective. The expert is a senior engineer with more than 12 years of experience in embedded software quality. Table 8 gives an overview of the results.
| Product | Grade ESQM | Grade Expert |
| A | 1.2 | 1 |
| C | 1.8 | 3 |
| B | 3.1 | 5 |
The total result (using German school grades, where 1 is the best grade and 6 is the worst grade) shows a clear order of the quality of the products, with product A being the best product, product C being second, and product B being the worst product. The assessment method results of ESQM for these three products are similar, i.e., the order of the products is the same as the expert’s opinion. To make the result clearer, we calculated the grades with higher precision, i. e. with one decimal place.
The automatic assessment method calculates better grades, although it keeps the same order as the expert. Reasons for this might be that the ESQM quality model focuses on quality requirements that are directly related to the particularities of embedded systems and that the model does not consider more general quality factors that are independent of a specific application domain. We assume that the expert considered these more general aspects in his rating.
8.3 Comparison with Base Model
ESQM uses all concepts as defined in the meta-model and applied in the base model. In addition, we found it straightforward to keep ESQM compatible with the base model’s properties and entities used. Table 9 gives an overview of the number of properties and entities of the complete base model (i.e. Java and C#) that we reused and changed in the ESQM.
| Elements | ESQM | Base Model |
|---|---|---|
| Entities | 87 | 92 |
| added | 30 | - |
| split | 11 | - |
| merged | 17 | - |
| removed | 29 | - |
| renamed | 7 | - |
| Properties | 32 | 43 |
| added | 6 | - |
| split | 1 | - |
| merged | 4 | - |
| removed | 14 | - |
| renamed | 1 | - |
For the entities, considerable restructuring was necessary. We added a number of entities, as in C/C++ the declaration and definition of variables or methods has to be distinguished. Furthermore, C++ has some specifics not available in other object-oriented programming languages, such as comma operators. We split some entities, as the underlying measures sometimes provide more specific support for those specialised entities (e. g. not only for literals in general but also for string literals and numeric literals). We removed those entities that do not make sense for C/C++ (e. g. interfaces).
Table 9 shows, however, that many of the properties already defined in the base model could be reused. Only minor changes were necessary (adding, splitting, merging, renaming) to model the properties that are typical for embedded systems. We removed 14 properties from the base model. These were mainly properties tied to entities that are specific for programming languages like Java and C# (e. g. interfaces) or properties that are not related to source code.
9 Summary & Conclusions
A gap exists between abstract quality definitions provided in common quality taxonomies, such as ISO/IEC 25010, abstract quality assessment procedures, such as ISO/IEC 25040, and concrete measurements. Our overall aim is to close this gap with the help of operationalised quality models. Because of the domain specificity of quality and the potential detailedness of such operationalised quality models, we also aimed at developing modular and adaptable models. To conclude, we summarise our contributions, discuss the lessons learnt and draw conclusions and give directions for future work.
9.1 Summary
We have shown six contributions for achieving our goal: (1) We developed an explicit meta-model that allows us to specify operationalised quality models with the flexible but well-defined concepts of factors, impacts between factors, measures for operationalising the factors, and modules. (2) Using this meta-model, we built a broad, largely technology-independent base model, which we operationalised for the programming languages Java and C#. The freely available and extendable base model captures the most important statically measurable product factors and their impacts on product quality as defined in ISO/IEC 25010. (3) We provided a quality assessment approach and a corresponding operationalisation of the base model, which enables us to use it for transparent and repeatable quality assessments.
(4) We evaluated three aspects of the complete approach for Java in empirical studies. We found that the assessments largely match expert opinion, especially for the maintainability part of the model. Yet, the results are not completely conclusive. The model as well as the quality assessments were highly understandable for practitioners and considered the best that can be done with static analysis. The opinions on the validity of the assessments and on potentially improved productivity were inconclusive, however.
(5) We developed extensive, open-source tool support for building operationalised quality models as well as performing the quality assessments including extensive visualisation capabilities. (6) In addition to the base model, we described the specific quality model for the area of embedded software. It relies on the same infrastructure as the base model and shows how the Quamoco approach can be used for a specific context. Furthermore, it demonstrates the possibility of exploiting the base model to build specific models with less effort than if starting from scratch.
9.2 Conclusions
Overall, we found that it is possible to bridge the gap between abstract quality characteristics and concrete measures by building detailed, operationalised quality models. It required great effort to create the necessary foundations and then build such a detailed model. We are not sure to what extent such effort can be expended in practical settings. Yet, we found in the empirical analyses that there is reasonable agreement between expert opinion and model-based quality assessments as well as an increased understanding of operationalised quality models by practitioners.
A measurement program using GQM would probably be able to come up with a similar quality model. It took three years and about 23 people, however, to build the quality models and surrounding tools and methods. most companies are probably not willing to spend this effort but would rather adapt an existing quality model.
There is now a broad, freely available quality model based on an explicit meta-model capturing the experience of several quality experts from industry and academia. It also contains complete tool support from model creation to quality assessment.
For academia, this allows investigating the model in detail, working on different aspects of the model that are still under-developed and empirically investigating and comparing the quality model with other approaches. In that sense, the Quamoco base model can be used as a benchmark.
The base model itself is broad and covers most quality characteristics of ISO/IEC 25010 but with varying degrees of depth. Maintainability, in particular, is well covered and seems to be assessable by static and manual analyses. Other quality characteristics, such as reliability or security, are covered by static checks, but we expect that dynamic analyses will be able to improve the assessments. The modelling of such aspects can be done with the existing mechanisms, but the execution of quality assessment will be different as we need a running system in a suitable environment.
In the follow-up of the project, the Quamoco meta-model and tooling were also shown to be ready for industrial use: itestra GmbH deployed them successfully at a financial software provider with the purpose of managing the quality and costs of all larger projects. Further commercial applications may follow. Key features were the flexible modelling of quality characteristics, measures, aggregation and evaluation rules, as well as the ability to deal with different technologies, such as Java, .NET, C++, and COBOL in a similar, integrated way. We also transferred the approach successfully into practice in a project with several SMEs [28]. In that project, however, we also found a partial mismatch between the analysis results of the base model and the opinions of the experts. This suggests that the base model would need to be adapted better to their environment.
We invested a lot of effort in creating a clear and efficient approach for building the quality model. On the other hand, we learned a lot along the way. We found the issues in Table 10 to be the most important lessons learned from the Quamoco project.
| Additional layer | Our discussions and experiences led us to the decision to include – in contrast to most existing quality models such as ISO/IEC 25010 or [65] – an additional layer, which we called product factors, in the quality models to make it easier to relate measures and quality aspects to it. We can confirm similar proposals made by Kitchenham et al. [42] or Dromey [25], because this allows clear operationalisation of the model. The practices of Squale [61] go into a similar direction but are less clearly defined. |
|---|---|
| Modularisation | Modularisation proved to be a powerful concept in the models for handling different technologies and paradigms and their overlapping quality characteristics. Each module can place special emphasis on its specifics and extend and use the elements of (other) existing modules. Modularisation had not been used in quality models before. |
| Operationalisation | Completely operationalising quality models using measures, instruments and evaluations is an elaborate task. We spent many person-months on the model and were still only able to cover a few quality aspects and technologies comprehensively. We found in our validations, however, that the operationalisation makes the abstract quality attributes from ISO easier to understand and explains software metrics for practitioners. It helps to bridge the identified gap. Again, Squale [61] is most similar here. They report first results of their operationalised quality model being well accepted by developers at Air France, but they did not perform a thorough analysis. Hence, it remains unclear if the effort pays off in the end. |
| Rankings and threshold calibration | Determining good thresholds in the assessment is crucial but hard. The benchmarking approach helped us to put this on a more solid foundation, but it is an elaborate process and a large number of available systems are required. Our calibration approach is similar to the benchmarking in [3] which we can confirm as a useful means for determining thresholds. Nevertheless, the participants of our study still found the threshold determination and calibration hard to understand. |
| Static analysis for quality assessment | Static analysis is extremely handy for software analyses as it needs neither a specific context nor test cases and a running system. Hence, we can easily and frequently run such analyses on many systems. This advantage is also a disadvantage because we found that inherently dynamic aspects, such as reliability or security, are difficult to capture statically. Nevertheless, we saw mostly reasonable assessments in concordance with expert opinion. |
| Nightly quality analysis | Introducing nightly quality analyses, similar to nightly builds for software, proved to be the most important step on the way to an operationalised quality model. We ran the current quality model every night on a wide range of systems to detect problems in the model and tooling as soon as possible. To the best of our knowledge, such an approach has not been used before. |
| Difficult validation | Objective validation of the assessment results is hard because we usually do not have objective, independent quality assessments to compare our results to. Our assessment results cannot be compared with defect counts, and other general quality metrics are usually not available. This leaves us with a low sample size so far. Bansiya and Davis [7], for example, used a similar approach to validate their QMOOD model. |
9.3 Future Work
By working on filling the gap in current quality models, we found several other directions for future work that should be followed. First, the base model and its validation focus on a small number of paradigms and technologies so far. To be truly broad, we need to take into account further contents for the base model. Second, we are working on additional empirical studies to better understand the remaining weaknesses of our approach to further improve it accordingly.
Third, we believe that the tool support is exceptional for a research prototype but not yet on the level of a commercial or mature open source application. Thus, we will continue to work on the tools as an open source project. Fourth, Mordal-Manet et al. [60] present an in-depth discussion of possibilities for aggregating quality metrics. This should also be investigated in the context of Quamoco models and their assessment method. Finally, the majority of the base model measures have static analysis instruments to allow them to be collected with low effort. This will, however, limit the possibilities of assessing dynamic aspects of the software. Hence, we are working on extensions to include testing and other dynamic analyses.
Acknowledgement
We are grateful to all members of the Quamoco project team as well as to all the participants of our interviews and surveys. This work has been supported by the German Federal Ministry of Education and Research (BMBF) under grant number 01IS08023.
References
- [1] Hiyam Al-Kilidar, Karl Cox, and Barbara Kitchenham. The use and usefulness of the ISO/IEC 9126 quality standard. In Proc. International Symposium on Empirical Software Engineering (ISESE’05), pages 7–16. IEEE, 2005.
- [2] Mohammad Alshayeb and Wei Li. An empirical validation of object-oriented metrics in two different iterative software processes. IEEE Transactions on Software Engineering, 29(11):1043–1049, 2003.
- [3] Tiago L. Alves, José Pedro Correia, and Joost Visser. Benchmark-based aggregation of metrics to ratings. In Proc. IWSM/Mensura 2011, pages 20–29. IEEE, 2011.
- [4] Nathaniel Ayewah, William Pugh, J. David Morgenthaler, John Penix, and YuQian Zhou. Evaluating static analysis defect warnings on production software. In Proc. 7th ACM SIGPLAN-SIGSOFT Workshop on Program Analysis for Software Tools and Engineering (PASTE ’07), pages 1–8. ACM, 2007.
- [5] Sushil Bajracharya, Joel Ossher, and Cristina Lopes. Sourcerer: An internet-scale software repository. In Proc. 2009 ICSE Workshop on Search-Driven Development–Users, Infrastructure, Tools and Evaluation, pages 1–4. IEEE, 2009.
- [6] Tibor Bakota, Péter Hegedūs, Péter Körtvélyesi, Rudolf Ferenc, and Tibor Gyimóthy. A probabilistic software quality model. In Proc. 27th IEEE International Conference on Software Maintenance, pages 243–252. IEEE, 2011.
- [7] Jagdish Bansiya and Carl G. Davis. A hierarchical model for object-oriented design quality assessment. IEEE Transactions on Software Engineering, 28(1):4 –17, 2002.
- [8] F. Hutton Barron and Bruce E. Barrett. Decision quality using ranked attribute weights. Management Science, 42(11):1515–1523, 1996.
- [9] Victor R Basili, Lionel Briand, and Walcelio L Melo. A validation of object-oriented design metrics as quality indicators. IEEE Transactions on Software Engineering, 22(10):751–761, 1996.
- [10] Saida Benlarbi, Khaled El Emam, Nishith Goel, and Shesh N Rai. Thresholds for object-oriented measures. In Proc. 11th International Symposium on Software Reliability Engineering (ISSRE 2000), pages 24–38. IEEE, 2000.
- [11] Alexandre Bergel, Simon Denier, Stéphane Ducasse, Jannik Laval, Fabrice Bellingard, Philippe Vaillergues, and Françoise Balmas. SQUALE - Software QUALity Enhancement. In Proc. 13th European Conference on Software Maintenance and Reengineering, pages 285–288. IEEE, 2009.
- [12] Al Bessey, Dawson Engler, Ken Block, Ben Chelf, Andy Chou, Bryan Fulton, Seth Hallem, Charles Henri-Gros, Asya Kamsky, and Scott McPeak. A few billion lines of code later. Communications of the ACM, 53(2):66–75, 2010.
- [13] Barry W. Boehm, John R. Brown, Hans Kaspar, Myron Lipow, Gordon J. Macleod, and Michael J. Merrit. Characteristics of Software Quality. North-Holland, 1978.
- [14] Lionel Briand, Jürgen Wüst, John W. Daly, and D. Victor Porter. Exploring the relationships between design measures and software quality in object-oriented systems. Journal of Systems and Software, 51(3):245–273, 2000.
- [15] CENELEC. EN 50128: Railway applications - Communications, signaling and processing systems - Software for System Safety, 2001.
- [16] Victor K.Y. Chan, W. Eric Wong, and T.F. Xie. Application of a statistical methodology to simplify software quality metric models constructed using incomplete data samples. Proc. International Conference on Quality Software (QSIC’06), pages 15–21, 2006.
- [17] Davis Fred D. Perceived usefulness, perceived ease of use, and user acceptance of information technology. MIS Quarterly, 13(3):319–340, 1989.
- [18] Fatma Dandashi. A method for assessing the reusability of object-oriented code using a validated set of automated measurements. In Proc. ACM Symposium on Applied Computing (SAC’02), pages 997–1003. ACM, 2002.
- [19] Florian Deissenboeck, Lars Heinemann, Markus Herrmannsdoerfer, Klaus Lochmann, and Stefan Wagner. The Quamoco tool chain for quality modeling and assessment. In Proc. 33rd International Conference on Software Engineering (ICSE’11), pages 1007–1009. ACM, 2011.
- [20] Florian Deissenboeck, Elmar Juergens, Benjamin Hummel, Stefan Wagner, Benedikt Mas y Parareda, and Markus Pizka. Tool support for continuous quality control. IEEE Software, 25(5):60–67, 2008.
- [21] Florian Deissenboeck, Elmar Juergens, Klaus Lochmann, and Stefan Wagner. Software quality models: Purposes, usage scenarios and requirements. In Proc. ICSE Workshop on Software Quality, pages 9–14. IEEE, 2009.
- [22] Florian Deissenboeck and Markus Pizka. Concise and consistent naming. Software Quality Journal, 14(3):261–282, 2006.
- [23] Florian Deissenboeck, Stefan Wagner, Markus Pizka, Stefan Teuchert, and Jean-François Girard. An activity-based quality model for maintainability. In Proc. IEEE International Conference on Software Maintenance (ICSM’07), pages 184–193. IEEE, 2007.
- [24] J. Dodgson, M. Spackman, A. Pearman, and L. Phillips. Multi-criteria analysis: A manual. Technical report, Department of the Environment, Transport and the Regions, London, 2000.
- [25] R. Geoff Dromey. A model for software product quality. IEEE Transactions on Software Engineering, 21(2):146–162, 1995.
- [26] Wards Edwards and F. Hutton Barron. SMARTS and SMARTER: Improved simple methods for multiattribute utility measurement. Organizational Behavior and Human Decision Processes, 60(3):306–325, 1994.
- [27] Xavier Franch and Juan Pablo Carvallo. Using quality models in software package selection. IEEE Software, 20(1):34–41, 2003.
- [28] Mario Gleirscher, Dmitriy Golubitskiy, Maximilian Irlbeck, and Stefan Wagner. Introduction of static quality analysis in small- and medium-sized software enterprises: experiences from technology transfer. Software Quality Journal, 22(3):499–542, 2014.
- [29] Robert B. Grady and Deborah L. Caswell. Software Metrics: Establishing a Company-Wide Program. Prentice Hall, 1987.
- [30] Harald Gruber, Reinhold Plösch, and Matthias Saft. On the validity of benchmarking for evaluating code quality. In Proc. IWSM/MetriKon/Mensura 2010, 2010.
- [31] Ilja Heitlager, Tobias Kuipers, and Joost Visser. A practical model for measuring maintainability. In Proc. 6th International Conference on Quality of Information and Communications Technology (QUATIC’07), pages 30–39. IEEE, 2007.
- [32] David Hovemeyer and William Pugh. Finding bugs is easy. ACM Sigplan Notices, 39(12):92, 2004.
- [33] David Hovemeyer and William Pugh. Finding more null pointer bugs, but not too many. In Proc. 7th ACM SIGPLAN-SIGSOFT Workshop on Program Analysis for Software Tools and Engineering (PASTE ’07), pages 9–14. ACM, 2007.
- [34] IEC 61508. Functional safety of electrical/electronical/programmable electronic safety-related systems, 2010.
- [35] IEC 62304. Medical device software – software life cycle processes, 2006.
- [36] ISO/IEC 25010:2011. Systems and software engineering – systems and software quality requirements and evaluation (SQuaRE) – system and software quality models, 2011.
- [37] ISO/IEC 25040:2011. Systems and software engineering – systems and software quality requirements and evaluation (SQuaRE) – evaluation process, 2011.
- [38] ISO/IEC TR 9126-1:2001. Software engineering – product quality – part 1: Quality model, 2001.
- [39] Capers Jones and Oliver Bonsignour. The Economics of Software Quality. Addison-Wesley, 2011.
- [40] JSF. Joint Strike Fighter Air Vehicle C++ Coding Standards for the System Development and Demonstration Program, 2005.
- [41] Elmar Juergens, Florian Deissenboeck, Benjamin Hummel, and Stefan Wagner. Do code clones matter? In Proc. 31st International Conference on Software Engineering (ICSE’09), pages 485–495. IEEE, 2009.
- [42] Barbara Kitchenham, Stephen G. Linkman, Alberto Pasquini, and Vincenzo Nanni. The SQUID approach to defining a quality model. Software Quality Journal, 6(3):211–233, 1997.
- [43] M. Kläs, C. Lampasona, and J. Münch. Adapting software quality models: Practical challenges, approach, and first empirical results. In Proc. 37th Euromicro Conference on Software Engineering and Advanced Applications, pages 341–348. IEEE, 2011.
- [44] M. Kläs, H. Nakao, E. Elberzhager, and J. Muench. Support planning and controlling of early quality assurance by combining expert judgment and defect data – a case study. Empirical Software Engineering Journal, 15(4):423–454, 2010.
- [45] Michael Kläs, Jens Heidrich, Jürgen Münch, and Adam Trendowicz. CQML scheme: A classification scheme for comprehensive quality model landscapes. In Proc. 35th Euromicro Conference on Software Engineering and Advanced Applications (SEAA’09), pages 243–250. IEEE, 2009.
- [46] Michael Kläs, Constanza Lampasona, Sabine Nunnenmacher, Stefan Wagner, Markus Herrmannsdörfer, and Klaus Lochmann. How to evaluate meta-models for software quality? In Proc. IWSM/MetriKon/Mensura 2010, 2010.
- [47] Michael Kläs, Klaus Lochmann, and Lars Heinemann. Evaluating a quality model for software product assessments - a case study. In Tagungsband Software-Qualitätsmodellierung und -bewertung (SQMB ’11). TU München, 2011.
- [48] Jannik Laval, Alexandre Bergel, and Stephane Ducasse. Assessing the quality of your software with MoQam. In 2nd Workshop on FAMIX and Moose in Reengineering (FAMOOSr’08), 2008.
- [49] Nancy G. Leveson. The role of software in spacecraft accidents. AIAA Journal of Spacecraft and Rockets, 41:564–575, 2004.
- [50] Klaus Lochmann. Engineering quality requirements using quality models. In Proc. 15th IEEE International Conference on Engineering of Complex Computer Systems (ICECCS’10), pages 245–246. IEEE, 2010.
- [51] Klaus Lochmann and Lars Heinemann. Integrating quality models and static analysis for comprehensive quality assessment. In Proc. 2nd International Workshop on Emerging Trends in Software Metrics (WETSoM’11), pages 5–11. ACM, 2011.
- [52] Markus Luckey, Andrea Baumann, Daniel Méndez Fernández, and Stefan Wagner. Reusing security requirements using an extend quality model. In Proc. 2010 ICSE Workshop on Software Engineering for Secure Systems (SESS’10), pages 1–7. ACM, 2010.
- [53] Cristina Marinescu, Radu Marinescu, Retru Florin Mihancea, Daniel Ratiu, and Richard Wettel. iPlasma: An integrated platform for quality assessment of object-oriented design. In Proc. 21st IEEE International Conference on Software Maintenance, pages 77–80. IEEE, 2005.
- [54] Radu Marinescu and Daniel Ratiu. Quantifying the quality of object-oriented design: The factor-strategy model. In Proc. 11th Working Conference on Reverse Engineering (WCRE’04), pages 192–201. IEEE, 2004.
- [55] Alois Mayr, Reinhold Plösch, Michael Kläs, Constanza Lampasona, and Matthias Saft. A comprehensive code-based quality model for embedded systems. In Proc. 23th IEEE International Symposium on Software Reliability Engineering (ISSRE’12), pages 281–290. IEEE, 2012.
- [56] Alois Mayr, Reinhold Plösch, and Christian Körner. Objective safety compliance checks for source code. In Companion Proceedings of 36th International Conference on Software Engineering (ICSE 2014), 2014.
- [57] Jim A. McCall, Paul K. Richards, and Gene F. Walters. Factors in Software Quality. National Technical Information Service, 1977.
- [58] MISRA. MISRA-C 2004 Guidelines for the use of the C language in critical systems, 2004.
- [59] MISRA. MISRA C++ 2008 guidelines for the use of the C++ language in critical systems, 2008.
- [60] Karine Mordal, Nicolas Anquetil, Jannik Laval, Alexander Serebrenik, Bogdan Vasilescu, and Stéphane Ducasse. Software quality metrics aggregation in industry. Journal of Software: Evolution and Process, 25(10):1117–1135, 2012.
- [61] Karine Mordal-Manet, Françoise Balmas, Simon Denier, Stéphane Ducasse, Harald Wertz, Jannik Laval, Fabrice Bellingard, and Philippe Vaillergues. The Squale model – a practice-based industrial quality model. In Proc. IEEE International Conference on Software Maintenance (ICSM’09), pages 531–534. IEEE, 2009.
- [62] Reinhold Plösch, Harald Gruber, A. Hentschel, Christian Körner, Gustav Pomberger, Stefan Schiffer, Matthias Saft, and S. Storck. The EMISQ method and its tool support-expert-based evaluation of internal software quality. Innovations in Systems and Software Engineering, 4(1):3–15, 2008.
- [63] Reinhold Plösch, Harald Gruber, Christian Körner, Gustav Pomberger, and Stefan Schiffer. A proposal for a quality model based on a technical topic classification. In Tagungsband des 2. Workshops zur Software-Qualitätsmodellierung und -bewertung. TU München, 2009.
- [64] Reinhold Plösch, Alois Mayr, and Christian Körner. Collecting quality requirements using quality models and goals. In Proc. 2010 Seventh International Conference on the Quality of Information and Communications Technology (QUATIC’10), pages 198–203. IEEE, 2010.
- [65] Ioannis Samoladas, Georgios Gousios, Diomidis Spinellis, and Ioannis Stamelos. The SQO-OSS quality model: Measurement based open source software evaluation. In Open Source Development, Communities and Quality. IFIP 20th World Computer Congress, pages 237–248. Springer, 2008.
- [66] Holger Schackmann, Martin Jansen, and Horst Lichter. Tool support for user-defined quality assessment models. In Proc. MetriKon 2009, 2009.
- [67] Raed Shatnawi. A quantitative investigation of the acceptable risk levels of object-oriented metrics in open-source systems. IEEE Transactions on Software Engineering, 36(2):216–225, 2010.
- [68] Adam Trendowicz, Michael Kläs, Constanza Lampasona, Juergen Muench, Christian Körner, and Saft Matthias. Model-based product quality evaluation with multi-criteria decision analysis. In Proc. IWSM/MetriKon/Mensura 2010, 2010.
- [69] Adam Trendowicz and Sylwia Kopczyńska. Adapting multi-criteria decision analysis for assessing the quality of software products. Current approaches and future perspectives. In Advances in Computers, pages 153–226. Elsevier, 2014.
- [70] Rini van Solingen and Egon Berghout. Goal/Question/Metric Method. McGraw-Hill Professional, 1999.
- [71] R. H. J. van Zeist and P. R. H. Hendriks. Specifying software quality with the extended ISO model. Software Quality Journal, 5(4):273–284, 1996.
- [72] P. Vincke. Multicriteria Decision-Aid. Contemporary Evaluation Research. Wiley, 1992.
- [73] Stefan Wagner. A Bayesian network approach to assess and predict software quality using activity-based quality models. Information and Software Technology, 52(11):1230–1241, 2010.
- [74] Stefan Wagner, Klaus Lochmann, Lars Heinemann, Michael Kläs, Constanza Lampasona, Adam Trendowicz, Reinhold Plösch, Alois Mayr, Andreas Seidl, Andreas Goeb, and Jonathan Streit. Questionnaires and raw data for the paper “Operationalised product quality models and assessment: The Quamoco approach”. http://dx.doi.org/10.5281/zenodo.13290.
- [75] Stefan Wagner, Klaus Lochmann, Lars Heinemann, Michael Kläs, Adam Trendowicz, Reinhold Plösch, Andreas Seidl, Andreas Goeb, and Jonathan Streit. The Quamoco product quality modelling and assessment approach. In Proc. 34th International Conference on Software Engineering (ICSE’12), pages 1133–1142. IEEE, 2012.
- [76] Stefan Wagner, Klaus Lochmann, Sebastian Winter, Florian Deissenboeck, Elmar Juergens, Markus Herrmannsdoerfer, Lars Heinemann, Michael Kläs, Adam Tendowicz, Jens Heidrich, Reinhold Ploesch, Andreas Goeb, Christian Koerner, Korbinian Schoder, Jonathan Streit, and Christian Schubert. The Quamoco quality meta-model. Technical Report TUM-I1281, Technische Universität München, 2012.
- [77] Stefan Wagner, Klaus Lochmann, Sebastian Winter, Andreas Goeb, and Michael Klaes. Quality models in practice: A preliminary analysis. In Proc. 3rd International Symposium on Empirical Software Engineering and Measurement (ESEM’09), pages 464–467. IEEE, 2009.
- [78] Stefan Wagner, Klaus Lochmann, Sebastian Winter, Andreas Goeb, Michael Kläs, and Sabine Nunnenmacher. Software quality in practice. survey results. Technical Report TUM-I129, Technische Universität München, 2012.
- [79] Michael Wicks. A software engineering survey. Technical Report HW-MACS-TR-0036, Heriot-Watt University, 2005.
Appendix A Benchmarking Approach
In this appendix, we describe the details of how to determine the thresholds min and max for the utility functions in the assessment approach using benchmarking. We use Equation 1, where is the normalised measurement result for the baseline system and and represent the 25% and 75% percentiles; is the inter-quartile range.
|
|
(1) |
According to this formula, values above (and below ) are considered outliers. This equation takes into consideration typical distributions of measure values:
-
1.
Figure 11a shows the histogram of the measure bitwise add of signed value of 110 systems. This measure is based on a rule-based static code analysis tool and normalised by LOC. We can see that all but two systems had no violations of this rule and have a normalised value of . Such a distribution frequently appears for rule-based measures. In this case, Equation 1 realises a simple jump function at 0.
-
2.
Figure 11b shows the histogram of the measure clone coverage. This metric is not normalised because it returns one value for the entire system, which is already “normalised” by definition. The distribution of values is typical for “classical” software metrics. In this case, Equation 1 uses the minimum and maximum non-outlier values as thresholds, i. e. and .
-
3.
Figure 11c shows the histogram of the measure missing JavaDoc comment. Although it is a rule-based measure, its normalised values are more equally distributed than in (1). Thus, we used the non-outlier values as thresholds. On the left side of the distribution, there are no outliers. On the right side, all values above the dotted line in the figure are considered outliers.
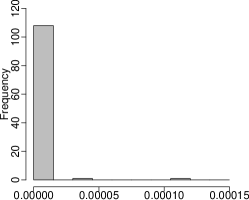
|
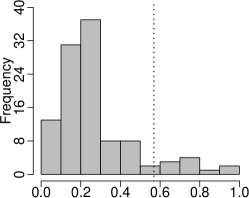
|
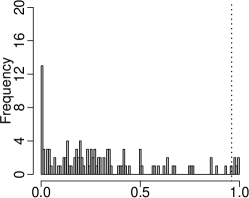
|
| (a) Bitwise Add of Signed Byte | (b) Clone Coverage | (c) Missing JavaDoc Comment |
The approach ensures that outliers in the measurement data do not lead to extreme min and max thresholds which would lead to narrowly clustered evaluation results due to a stretched evaluation function and, in consequence, to low entropy and lack of differentiation [47].