Study of linearity of LYSO crystal for HERD calorimeter††thanks: Supported by National Natural Science Foundation of China, Grant No.11327303, Grant No. 11473028 and Grant No. 11675196; International Science and Technology Cooperation Program of China, Grant No. 2015DFA10140; Interdisciplinary Innovation Team Project of Chinese Academy of Sciences (Research Team of The High Energy cosmic-Radiation Detection); Qianren start-up grant 292012312D1117210; Strategic Pioneer Program in Space Science, Chinese Academy of Sciences, Grant No. XDA04075600; Youth Innovation Promotion Association of CAS, Grant NO. 2014009
Abstract
The High Energy cosmic Radiation Detection (HERD) facility is a space mission designed for detecting cosmic ray (CR) electrons, -rays up to tens of TeV and CR nuclei from proton to iron up to several PeV. The main instrument of HERD is a 3-D imaging calorimeter (CALO) composed of nearly ten thousand cubic LYSO crystals. A large dynamic range of single HERD CALO Cell (HCC) is necessary to achieve HERD’s PeV observation objectives, which means that the response of HCC should maintain a good linearity from minimum ionizing particle (MIP) calibration to PeV shower maximum. In order to study the linearity of HCC over such a large energy range, a beam test has been implemented at the E2 and E3 beam lines of BEPC. High intensity pulsed electron beam provided by E2 line are used for producing high energy density within HCC; /proton provided by E3 line are used for HCC calibration. The results show that no saturation effect occurs and the linearity of HCC is better than 10% from 30 MeV (1 MIP) to 1.1103 TeV (energy density is 93 TeV/cm3), which can meet the requirement mentioned above.
keywords:
HERD, Calorimeter, LYSO, Linearity, Beam testpacs:
29.40.Vj, 29.40.Mc
1 Introduction
HERD is one of the space astronomy payloads of the cosmic light house program onboard the China’s Space Station. The main scientific objectives of HERD are indirect dark matter search, precise CR spectrum and composition measurements up to the knee energy and high energy -ray monitoring and survey [2]. To achieve these scientific objectives, a 3-D imaging and five-side active calorimeter is designed to perform high energy resolution and high statistics measurements of the CR nuclei, electrons and positrons, and -rays in space. HERD CALO consists of 212121 cells corresponding to 55 radiation lengths () and 3 nuclear interaction lengths () longitudinal, separately. Each HCC is made of a 333 cm3 cubic LYSO crystal and two spiral WLSFs (Saint Gobain BCF91A) as the fluorescence readout. All the WLSF signals are collected by two image intensified CCDs (ICCD) [2, 3].
LYSO (Lutetium Yttrium Orthosilicate with Cerium doping) crystal is one of the best candidates for CALO material. It has the advantages of high density, high light output, short decay time, and application of this crystal in space would be quite easier thanks to the non-hygroscopicity and small temperature coefficient. The general properties of LYSO are described in Ref. [4, 5, 6] Theoretically, the fluorescence intensity of LYSO crystal should be linear with the energy deposition induced by incident particles. However, saturation effect may occur at high ionization density of the crystal. The linearity of LYSO crystal light output should be studied and understood before application. Results from Monte Carlo simulation show that a dynamical range of 2106 is required for HCC [2]: A minimum detectable signal down to 30 MeV is required for calibration using MIP; meanwhile, the maximum energy deposition induced by PeV proton shower is up to 60 TeV (energy density is about 8 TeV/cm3, Fig. 1).
![[Uncaptioned image]](/html/1611.09128/assets/1PeVProton.png) \figcaption
\figcaption
Energy deposition in 111 cm3 LYSO cubes with 1 PeV proton incidence. The whole calorimeter consists of 100100100 cubes corresponding to 5 deep, thus the shower maximum produced by 1 PeV proton can be contained within the calorimeter for those early showered events. The data is derived from Monte Carlo simulation using Fluka 2011 with DPMJET3 [7].
Numerous studies of LYSO linearity have been performed using low energy -rays or electrons, the verified ranges are 511 keV1333 keV [8], 65 MeV145 MeV [9] and 100 MeV1.5 GeV [10]. There are few calorimeters of space missions designed to measure PeV particles directly, thus little attention has been paid to the linearity of inorganic crystals over a large energy (or energy density) range.
A study of linearity for LSO (Lutetium Orthosilicate with Cerium doping) crystal using high intensity pulsed -rays is described in Ref. [11], which demonstrates that the linear response of the crystal ranges from 5.11018 MeV/(cms)1.91019 MeV/(cms). It is reasonable to expect the same linearity of HCC which is made of similar material at that high energy density. However, the verified energy density of this study is too high and it does not cover the required range of HCC.
We developed a method of using high intensity pulsed electron beam and /proton beam to measure the linearity of HCC. In this paper, the method and the experimental setup are presented in Section 2. Data analysis and results are presented in Section 3 and the conclusion is briefly shown in Section 4.
2 Experimental setup
2.1 Test Beam
It is well known that ground accelerators can only produce primary beam particles up to several TeV, thus it is feasible to achieve an energy density up to 8 TeV/cm3 by using a bunch of particles passing through HCC and calibrate it by using single beam particle, separately. The measurement is carried out by using the electron beam provided by BEPC E2 Line [12]. The beam properties are showed as follows:
-
•
Beam energy: 2.5 GeV
-
•
Beam intensity: from 103 to 1010 electrons/pulse
-
•
Beam frequency: 12.5 Hz
-
•
Beam size: 4 4 cm2
-
•
Beam pulse width: 20 ps
The collimation size is 1 cm which is smaller than crystal size (3 cm) in order to reduce the geometrical non-uniformities.
Energy deposition of one electron with 2.5 GeV kinetic energy in HCC is about 240 MeV (Section 3.3). HCC is thick enough (2.6) for 2.5 GeV electrons to produce showers, the part of HCC at the shower center has the highest energy density of about 20 MeV/cm3. Thus an adequate beam intensity up to 4105 electrons/pulse (or energy deposition in HCC up to 96 TeV) is necessary to get a maximum energy density of 8 TeV/cm3.
BEPC E3 line is a mixed beam of secondary particles includes , e±, , proton and . /proton mixed beam with the momentum of 600 MeV/c to 1.2 GeV/c are chosen by beam line magnets for HCC calibration.
2.2 The HCC readout
PMTs instead of ICCDs are used during the test to avoid possible non-linearity of the ICCD device. Two WLSFs coupled to a cubic LYSO crystal (from Suzhou Jtcrystal Co., Ltd.) are read out by two PMTs (XP2262) respectively. Neutral density filters (NDF) with different transmittances are attached to PMTs for detecting different energy ranges. The NDFs and the PMT are all sealed in a black plastic cylinder box with a circular aperture of 0.4 mm on top for the WLSF to plug in, as shown in Fig. 2.2.
![[Uncaptioned image]](/html/1611.09128/assets/HCC.png) \figcaption
\figcaption
The scheme of HCC (left) and PMT readout (right).
2.3 Experimental setup at E2 line
Three detectors are used to calibrate the beam intensity(Fig. 2.3):
-
•
Faraday Cup (FC): FC is the only device which can measure the absolute beam intensity directly. However, FC is not sensitive enough, it is designed to monitor the beam with intensity 106 electrons/pulse;
-
•
Ionization Chamber (IC): designed to monitor the beam intensity from 104 to 107 electrons/pulse;
-
•
Thin Plastic Scintillator (PS): placed in front of the HCC and attached with 2 PMTs for readout purpose. The effective detecting range is from 102 to 105 electrons/pulse.
With cross calibration between the three detectors, a wide beam intensity from 102 to 109 electrons/pulse can then be monitored and precisely measured.
![[Uncaptioned image]](/html/1611.09128/assets/Fig2.png) \figcaption
\figcaption
Schematic diagram of experimental setup for linearity measurement at E2 line.
A lead wall is built for shielding the detectors from the contamination caused by secondaries from the interaction of beam particles with surrounding materials. Signals from FC and IC are recorded by a 12-bit peak sensing ADC (Mod. V785N), while signals from 4 PMTs are readout by a 4-channel digitizer (Mod. DT5751). Both DAQ modules share a common trigger signal from the accelerator.
2.4 Experimental setup at E3 line
![[Uncaptioned image]](/html/1611.09128/assets/Fig3.png) \figcaption
\figcaption
Schematic diagram of experimental setup for HCC calibration at E3 line, the NDFs are removed and the high voltages for PMTs are raised to detect the MIP signal which is much weaker than electron signal.
In the configuration at E3 line, a time of flight system (TOF) consists of two plastic scintillators are used for /proton separation as shown in Fig. 2.4. The trigger is the coincidence of two PMTs attached to the plastic scintillators. DT5751 which can work at a sampling rate of 1 GS/s provides a high time resolution to distinguish proton signals and signals from TOF (Section 3.3).
3 Data analysis
3.1 Calibration of beam intensity monitoring devices
A cross-calibration between FC, IC and PS is performed as shown in Fig. 3.1.
![[Uncaptioned image]](/html/1611.09128/assets/Fig4.png) \figcaption
\figcaption
Principle of beam intensity calibration. Overlaps between the detecting ranges of FC, IC and PS are large enough for a cross-calibration.
3.1.1 FC Calibration
![[Uncaptioned image]](/html/1611.09128/assets/x1.png) \figcaption
\figcaption
Relationship between injected electron number and FC output, the x axis is ADC channel; the y axis is number of electrons.
Fig. 3.1.1 shows good linearity in ADC’s counting range, the calibration factor is obtained by fitting a straight line to data points:
| (1) |
3.1.2 IC and PS Calibration
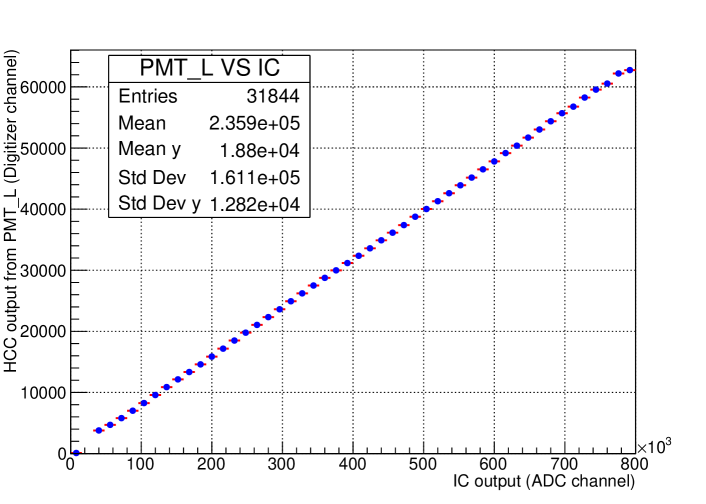
The IC and PS detectors are calibrated by studying the relationship between FC output and IC output (Fig. 3.1.2), IC output and PS output (Fig. 3.1.2).
![[Uncaptioned image]](/html/1611.09128/assets/x2.png) \figcaption
\figcaption
Profile histogram of IC calibration for displaying the relationship between FC output and IC output.
ADC channels of IC from 200 to 750 are chosen for fitting, because when ADC(IC)750, rare events would lead large fluctuations, and when ADC(IC)200, signals would be too close to the baseline.
![[Uncaptioned image]](/html/1611.09128/assets/x3.png) \figcaption
\figcaption
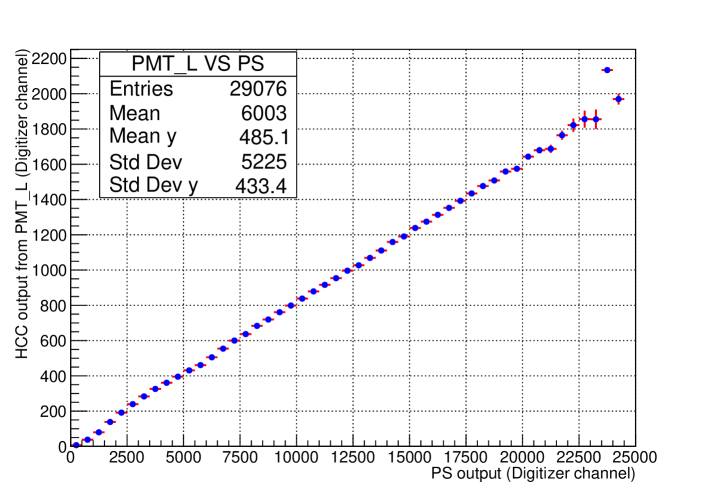
PS calibration, the x axis represents PS output (Digitizer channel); the y axis is IC output (ADC channel), the histogram shows good linearity.
The calibration factors of IC and PS are obtained by fitting to the data:
| (2) |
| (3) |
3.2 NDF Calibration
A measurement of transmittance of NDFs was performed before the beam test, we used an optical fiber irradiated by a LED as the light source and a PMT for readout. The NDF was installed on a linear stage which could provide high precision linear movement. The original signal and attenuated signal could be obtained by moving the NDF to the position between the light source and the PMT. Fig. 3.2 shows the calibration result of one NDF.
![[Uncaptioned image]](/html/1611.09128/assets/x4.png) \figcaption
\figcaption
Calibration result of one NDF with 0.6 optical density(O.D., ).
Calibration results of the NDFs used in the test. No. Attached PMT Diameter (mm) Optical density Nominal transmittance Calibrated transmittance 1 L 504 0.6 0.251 0.2326 2 L 504 2 0.01 0.0118 3 H 504 1 0.1 0.0828 4 H 504 3 0.001 0.0010
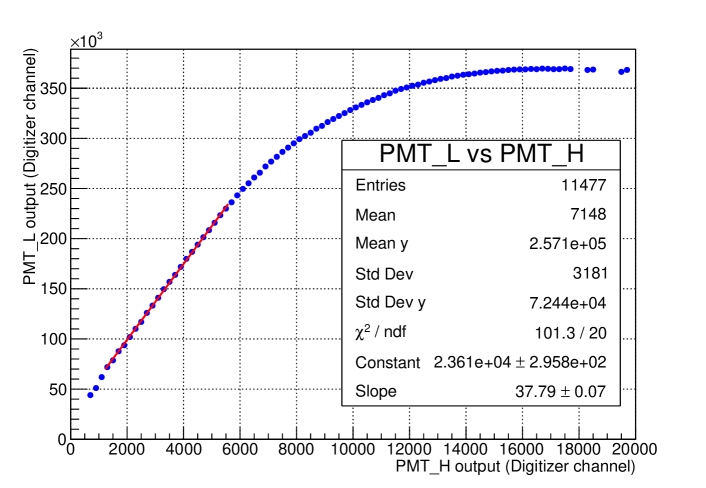
The total transmittance of attached NDFs are 2.810-3 and 8.310-5 (Table 3.2) for the two PMTs (defined as PMT_L, PMT_H), thus the intensity of light reached to the windows of PMT_L is about 34 times higher than that reached to PMT_H. The dynamic range of the HCC readout system is then extended naturally by combining the two PMTs.
3.3 HCC Calibration using E3 beam
Most of E3 beam particles are protons and , TOF data which clearly illustrates the difference between them in Fig. 3.3 is needed to separate from proton to get a clean spectrum as shown in Fig. 3.3.
![[Uncaptioned image]](/html/1611.09128/assets/x5.png) \figcaption
\figcaption
Time of flight distribution measured by TOF system for E3 beam at 800 MeV/c. The unmarked peaks are caused by accidental coincidences.
![[Uncaptioned image]](/html/1611.09128/assets/x6.png) \figcaption
\figcaption
Use the TOF data to separate from protons and use landau convoluted Gaussian function to fit peak. The incident particle is identified as a when 10 nsTOF15 ns or a proton when 16 nsTOF21 ns.
Energy deposition in HCC for different particles is then calculated by Monte Carlo simulation using Geant 4.9.6 [13]. The simulation environment is built based on the experimental setup. The results are shown in Fig. 3.3 and Table 3.4.
Energy deposition is nearly constant for in the case of normal incident when its momentum 400 MeV/c; for 2.5 GeV electrons, energy deposition is much higher because electromagnetic showers are initiated inside the crystal.
![[Uncaptioned image]](/html/1611.09128/assets/x7.png) \figcaption
\figcaption
Energy deposition in HCC for , protons and electrons derived from Mote Carlo simulation data.
3.4 Results and Discussions
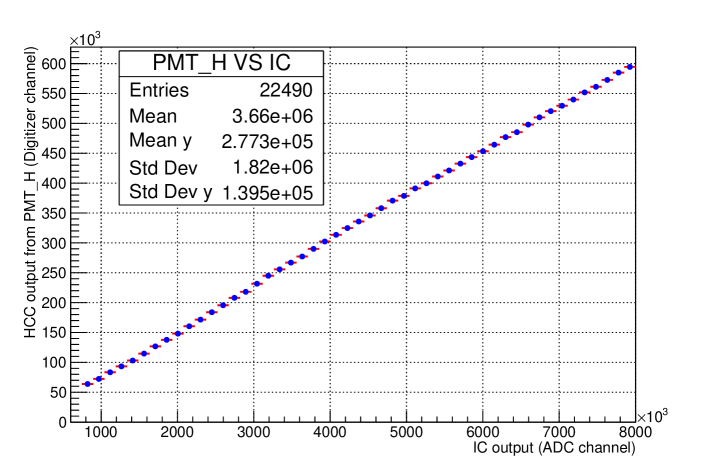
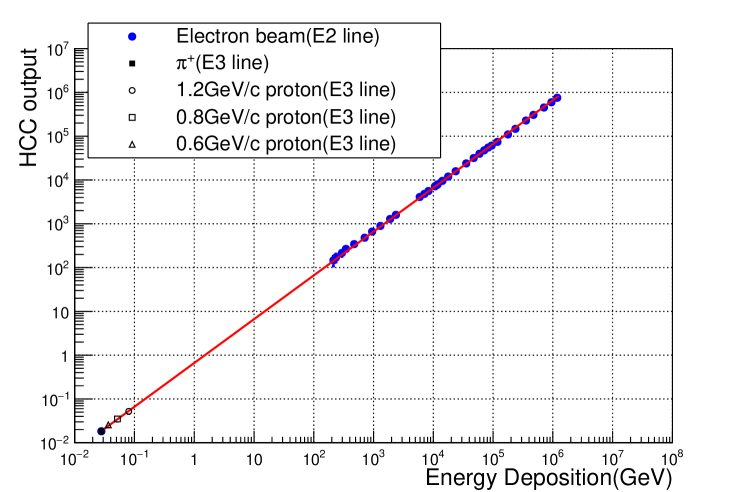
The results of linearity at different beam intensities as well as correlation between output of PMT_L and PMT_H are illustrated in Fig. 1.
To calculate the equivalent HCC output for proton and , the NDFs’ attenuate effect and the change of high voltage for PMTs should be taken into account:
| (4) |
Where represents the high voltage correction factor which is defined as the ratio of two gains of PMTs used by E2 test and E3 test; represents the total transmittance of NDFs used in E2 test; represents the PMT output given by E3 test (Table 3.4). Fig. 2 shows the profile histogram which combines all the results for different intensity ranges as well as and protons.
Summary of simulation results and experimental results of beam test at E3. Particle type Momentum (MeV/c) Energy deposition from MC simulation data(MeV) Peak Value from experimental data (Digitizer channel) Sigma from experimental data (Digitizer channel) 600-1200 28.0 4079 428.2 Proton 600 80.4 11644.6 783.1 Proton 800 52.0 7796.4 630.9 Proton 1200 36.6 5715.4 564.8 Electron = 2.5GeV 236.7
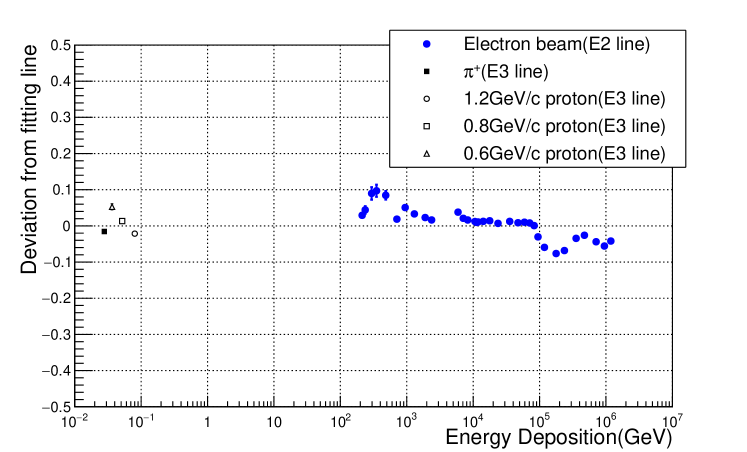
The maximum deviation is defined as linearity of HCC. Fig. 2 shows the linearity is better than 10% when energy deposition (energy density) in HCC are from 205 GeV (17 GeV/cm3 ) to 1.1103 TeV (93 TeV/cm3) which covers the requirement. The and proton signals agree well with the fitting function.
There are some factors that may affect the measurement result of linearity:
-
a)
Non-linearity of PMTs: Non-linearity of two PMTs was studied before the beam test. The details of measurement are described in [14]. Result shows the non-linearity of PMT is less than 2% when the output signal is not higher than 2 V. NDFs with high attenuation are used in the beam test to ensure the output signals are lower than 2 V.
-
b)
Stability of PMTs: Before data acquisition, the high voltage of PMTs are usually switched on at least two hours in advance, the response of PMTs gradually become stable in this period. The temperature variation may also cause a drift. To minimize such effect, one full data acquisition is completed within 3 hours and the data acquisition is repeated several times. The temperature variation during the beam test is smaller than 2℃. Therefore, this residual influence is negligible comparing to the calibration error.
-
c)
Backgrounds at E2 line: The backgrounds are secondary particles from the interaction of beam electrons with shielding material. Most of the backgrounds are X-rays and -rays. One part of them are absorbed by the LYSO crystal. But the ratio of signal to background is lower than 2% (Fig. c)) which do not have significant impacts on the measurement.
![[Uncaptioned image]](/html/1611.09128/assets/S2B.png) \figcaption
\figcaption
The background data is obtained by moving HCC 3 cm away from the beam line. In this case, only secondary particles can hit on HCC. Both beam signal and background have a linear relationship with the beam intensity, the ratio of signal to background is about 1.7%.
-
d)
Calibration Error: Because the FC has a large size, perfect shielding is nearly impossible. Primary electrons may hit on FC directly and lead to an overestimation of beam intensity. The large fluctuation of FC response can also have an influence on the accuracy of IC and PS calibration.
4 Conclusion
In this paper, the linearity of LYSO crystal for HCC is studied by measuring the relationship between HCC output and electron beam intensity given by faraday cup, ionization chamber and plastic scintillator. The linearity is better than 10% from 205 GeV to 1.1103 TeV (or from 17 GeV/cm3 to 93 TeV/cm3) which meets the requirement of PeV hadron detection. The linear range can be extrapolated to (MIP, 30MeV) and protons. No obvious saturation effect of HCC is observed in this range. The uncertainty of linearity measurement is mainly dominated by the measurement system and beam monitoring system.
From this work, we get a preliminary conclusion that the LYSO has a good linearity and can be used in HERD CALO for detecting high energy particles. A beam test at CERN SPS, which can supply electrons and protons with energies up to 300 GeV, is planned to verify main performances of HERD CALO.
Acknowledgement
Acknowledgements.
We are thankful to Jianchao Sun, Xuan Zhang, Xiaofeng Zhang and Zhe Ning for their support.
References
- [1]
- [2] S.N. Zhang, O. Adriani, S. Albergo, et al., The high energy cosmic-radiation detection (HERD) facility onboard China’s Space Station, in proceedings of SPIE 9144, Space Telescopes and Instrumentation 2014: Ultraviolet to Gamma Ray, 91440X (July 31, 2014), edited by Tadayuki Takahashi, Jan-Willem A. den Herder and M. Bautz.
- [3] Yongwei Dong, Zheng Quan, Junjing Wang, et al., Experimental verification of the HERD prototype at CERN SPS, in proceedings of SPIE 9905, Space Telescopes and Instrumentation 2016: Ultraviolet to Gamma Ray, 99056D (July 11, 2016), edited by Jan-Willem A. den Herder; Tadayuki Takahashi; Marshall Bautz.
- [4] Jianming Chen, Liyuan Zhang, Ren-yuan Zhu, Nuclear Instruments and Methods in Physics Research Section A: Accelerators, Spectrometers, Detectors and Associated Equipment, 572(1): 218-224 (2007)
- [5] Fan Yang, Rihua Mao, Liyuan Zhang, Ren-Yuan Zhu, Nuclear Instruments and Methods in Physics Research Section A: Accelerators, Spectrometers, Detectors and Associated Equipment, 784: 105-110 (2015)
- [6] Ren-Yuan Zhu, Physics Procedia, 37(2), 372-383 (2012).
- [7] A. Ferrari, P. Sala, A. Fasso, J. Ranft, FLUKA: A multi-particle transport code (Program version 2005), CERN-2005-10, INFN/TC-05/11, SLAC-R-773.
- [8] K. G. Afanaciev, A. M. Artikov, V. Yu. Baranov, et al., Physics of Particles and Nuclei Letters, 12(2): 319-324 (2015).
- [9] A. Berra, V. Bonvicini, C. Cecchi, et al., Nuclear Instruments and Methods in Physics Research Section A: Accelerators, Spectrometers, Detectors and Associated Equipment, 763: 248-254 (2014)
- [10] Kou Oishi on behalf of the COMET Collaboration, Development of electromagnetic calorimeter using GSO and LYSO crystals for the J-PARC muon-to-electron conversion search experiment, in proceedings of Nuclear Science Symposium and Medical Imaging Conference (NSS/MIC), 2014 IEEE (8-15 November, 2014).
- [11] X.Y. GUAN, Z.C. ZHANG, W.Y. ZHANG, Atomic Energy Science and Technology, 43(10): 942-945 (2009) (in Chinese).
- [12] http://english.ihep.cas.cn/rh/rd/dep/sywlbtbf/sywlbtbf_articles/201110/W020120606406778866830.pdf, retrieved October 2011.
- [13] S. Agostinelli, J. Allison, K. Amako, et al., Nuclear Instruments and Methods in Physics Research, Section A: Accelerators, Spectrometers, Detectors and Associated Equipment, 506(3): 250-303 (2003).
- [14] HAMAMATSU PHOTONICS K. K., PHOTOMULTIPLIER TUBES: Basics and Applications, Third edition (HAMAMATSU PHOTONICS K. K., 2007), p. 54-58.