Tool Support for Continuous Quality Controlling
Abstract
Software systems over time suffer from a gradual quality decay and therefore costs rise if no pro-active countermeasures are taken. Quality controlling is the first step to avoid this cost trap. Continuous quality assessments enable the early identification of quality problems, when their removal is still inexpensive, and aid in making adequate decisions as they provide an integrated view on the current status of a software system. As a side effect, continuous and timely feedback enables developers and maintainers to improve their skills and thereby helps to avoid future quality defects. To make regular quality controlling feasible, it has to be highly automated and assessment results need to be presented in an aggregated manner to not overwhelm users with too much data. This article gives an overview of tools that aim at solving these issues. As an example, we present the flexible, open source toolkit ConQAT that supports the creation of dashboards for quality controlling and report on its application.
| Keywords: | D.2.19 [Software Engineering]: Software Quality |
| D.2.9 [Software Engineering]: Management (Project control & modeling) |
Contact Information
| Florian Deissenboeck, Elmar Juergens, | Benedikt Mas y Parareda, |
| Benjamin Hummel, Stefan Wagner | Markus Pizka |
| Institut für Informatik | itestra GmbH |
| Technische Universität München | Ludwigstraße 35 |
| Boltzmannstr. 3 | 86916 Kaufering |
| 85748 Garching | Germany |
| Germany | |
| {deissenb, juergens, hummelb, wagnerst}@in.tum.de | {mas, pizka}@itestra.de |
1 Continuous Quality Controlling Tools
Long-lived software systems are known to undergo a gradual quality decay if no countermeasures are taken [1, 2]. Without exception, this affects all of the quality attributes defined by ISO 9216: reliability, functionality, efficiency, portability, usability and, above all, maintainability. Continuous quality controlling is used to identify and resolve quality defects early in the development process, while the implementation of countermeasures is still inexpensive. Obviously, assessing the current state of a system’s quality is a key activity of quality controlling. As there is a great number of diverse aspects of quality that need to be controlled, it must be assured that the cost associated with these assessments does not outweigh the benefits. Realistically, continuous quality controlling can only work in practice if appropriate tool support is available for all automatically assessable quality aspects. To support the selection of tools, we discuss key requirements for quality controlling tools and present examples of tools together with a categorization that structures the sometimes bewildering landscape of existing tools.
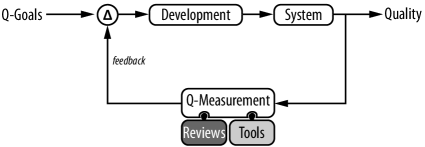
In essence, quality controlling consists of three key elements: (1) clearly defined quality goals, (2) techniques, tools and processes to analyze the current state of quality, (3) appropriate measures to react to discovered quality deficits. Fig. 1 depicts a control loop as used to describe dynamic systems to illustrate the process of continuous quality controlling. For clarity’s sake, changes to the system that are not caused by quality defects but by changing functional requirements are not included in the figure. A team or person responsible for the quality of a software system, the quality engineer, defines the quality goals, e. g., in the form of quality models, standards, KPIs or software metrics. The quality engineer uses manual techniques like reviews as well as quality analysis tools like unit testing frameworks or static analyzers to measure the quality of the system. He then compares the measurement results to the defined quality goals. Based on the outcome, he asks the developers to perform the required quality improvements. These changes result in a new revision of the system that again undergoes quality assessment. In the course of this improvement process developers are educated to increase quality in the long-term. If needed, the quality engineer can react to changing quality requirements by improving the quality goals (not illustrated in Fig. 1).
Software quality is a complex and multifaceted concept [3]. Consequently, definitions of quality typically differ across organizations and projects. However, independently of how quality is defined in a particular context, quality measurement is required to determine if a system meets the defined quality goals. Due to the number of relevant quality criteria and the size of the analyzed systems, the measurement in itself is a complex and challenging task. Hence, this article does not discuss specific quality criteria but focuses on the tools that are needed to monitor quality and thereby make continuous quality controlling effective and efficient.
There is a plethora of quality analysis tools offered by commercial vendors as well as academia that credit themselves with the ability to accomplish this. The range goes from unit testing frameworks over metric tools, violation checkers, architecture assessors to dashboards, software cockpits and application intelligence platforms. However, it is challenging to decide on the right tool for quality controlling as the requirements for such a tool are often unclear. To support decision making, we propose to use as a basis the following list of requirements, that, according to our experience, are substantial for putting continuous quality controlling into practice.
Aggregation & Visualization. Automated quality analysis of large software systems generates an enormous amount of analysis data. To not overwhelm users, analysis results need to be aggregated to a comprehensible level and presented in an appropriate manner. Aggregations can be achieved through categorization of metrics based on thresholds, or through basic aggregation operators like maximum, average, median etc. As results like “the average cyclomatic complexity of the system is 15” are of limited practical use, the latter aggregation approach requires the tool to be aware of the analyzed system’s structure to produce meaningful results. Even highly aggregated analysis results need to be conveyed to the user in an effective manner. Hence, the tool must provide powerful visualization mechanisms beyond tables and charts, e. g., graphs for structural information or tree maps to visualize distribution of anomalies within a system.
Dedicated Views. The assessment results must be accessible to all project participants, e. g., on a website or via a specific client. However, due to differing interests, it must be possible to provide a customized view for each stakeholder. Project managers, for example, are mainly interested in a high-level overview that enables them to spot problems without going into details. Developers, on the other hand, require views of finer granularity that allow them to inspect analysis results for the artifacts they have been working on.
Trend Analysis. Many quality defects are hard to identify by investigating a single snapshot of a system but can be discovered by tracking changes over time. Hence, the tool must be capable of storing and presenting historical data to foster the identification of trends. Moreover, various metrics used today are hard to interpret on an absolute scale but are well-suited if relative measures are used. It is, for example, not entirely clear what the quality implications of a code cloning ratio of 16% are, whereas most quality engineers would agree that it is important to ensure that the cloning ratio does not increase over time. (The cloning ratio measures how much of the source code has been copied at least once. It thus provides an estimate of how likely changes will have to be performed in multiple places due to code duplication.)
Customizability. Quality requirements are highly project-specific as the analyzed systems, the applied tools and processes, the involved technologies and the acting people differ. Even more so, these requirements are not constant but evolve over the course of a project. Hence, quality analysis tools must be highly customizable to support a project-specific tailoring of the analyses carried out and the way they are presented. Besides this, false positives generated by analysis tools are known to be a severe obstacle to the acceptance of continuous quality controlling as they cause frustration among users. Here, customization is required to configure analysis tools to reduce the number false positives [4]. For example, defects that impact code readability are not interesting for developers if they occur in generated code that is never actually read. In such cases, analyses must be tailored to be aware of generated code.
Diversity. The factors influencing product quality are diverse. Therefore a quality controlling tool may not be limited to a certain type of factors or artifacts it analyses. It must not only be able to analyze source code but should provide measures for other artifacts like documentation, models, build scripts or information stored in a change management systems. As quality attributes can be discussed on many different levels, the tool should make no restrictions on the level of detail, the level of granularity, nor the type of analysis. It must, for example, be possible to analyze a source code artifact on representation levels as different as character stream, token stream, syntax tree or call graph.
Extensibility. As no tool can innately support the whole spectrum of all possible artifacts it must provide an extension mechanism that allows users to add further analysis or assessment modules as needed. Examples of such artifacts are models used in model-driven development or programs written in newly created domain-specific languages.
Non-interactive operation. Tool supported assessments need to be carried out regularly (e. g., hourly or daily) to provide timely results. To achieve this in a cost-efficient manner, analysis tools need to be able to work in a completely automated, non-interactive way.
Performance. As quality controlling is particularly relevant for large scale systems that prevent comprehensive manual assessments, a quality controlling tool must be able to cope with the analyzed system’s size in acceptable time.
2 Tool Landscape
Since the tasks and activities related to quality analysis and controlling are manifold and diverse, the landscape of existing tools is correspondingly large. In order to simplify orientation and selection of suitable tools for a specific purpose, we propose a classification of quality analysis tools according to usage-related dimensions. More specifically, we outline characteristics and representatives of four tool categories, namely Sensors, System Analysis Workbenches, Project Intelligence Platforms and Dashboard Toolkits. We are well aware that the boundaries of these categories are blurred. If a tool can be argued to belong to more than one category, we tried to classify it according to its primary use case. Furthermore, due to the large number of existing tools and their pace of evolution, the list of representatives for each categorization is inherently incomplete, which we attempted to alleviate by choosing representative examples for each category. Nonetheless, we are convinced that such a categorization is fundamental as a guide in the diversity of the tool landscape and to distinguish between different use cases. Table 1 gives an overview of the categories and corresponding tools that are further detailed in the following paragraphs.
| Sensors | System Analysis Workbenches | Project Intelligence Platforms | Dashboard Toolkits | |
| scope | quality analysis | quality analysis | project controlling & quality analysis | quality analysis & project controlling |
| interaction paradigm | autonomous | interactive | autonomous | autonomous |
| usage scenario | nightly-build, IDE integration | demand-driven | demand-driven & nightly-build | nightly-build |
| analysis object | development artifacts | code, architecture | metrics | project & process artifacts |
| analysis question | hard-wired | queries on system snapshot | queries on metric data | configuration of analysis topology |
| result represent. | lists | artifact-specific visualizations | lists, charts | list, charts & artifact-spec. visual. |
| examples | JDepend, PMD, FxCop, NDepend, PC-Lint, Klocwork, JUnit | Sotograph, iPlasma | Hackystat, Team Foundation Server | ConQAT, XRadar, QALab, Sonar |
Sensors comprise verification and testing tools, anomaly detectors and metric calculators that perform fully automated analyses of development artifacts w.r.t. specific quality criteria. Due to their autonomous interaction paradigm that requires no user input, a common usage scenario is their application during automated nightly builds or as compile-time checkers in modern IDEs. The type of analysis question they answer is typically hard-wired. Analysis results are presented as tables or lists or as markers within an IDE. Examples include JDepend [5] that computes dependencies between components and warns if certain dependency rules are violated and PMD [6] that performs guideline checks and bug pattern search for Java programs. NDepend [7] and FxCop [8] are representatives of comparable tools for the .NET platform and PC-lint [9] or Klocwork [10] perform, amongst others, guideline checks and inspections of security vulnerabilities for C/C++. Moreover, xUnit frameworks [11] automate unit tests for numerable programming languages.
System analysis workbenches support experts in the analysis of various development artifacts, including source code or architecture specifications, in order to answer analysis questions about specific quality aspects of a system, such as its architecture conformance or component structure. In contrast to sensors, they are interactive tools that are used on demand, during system inspection or review. They support interactive analysis by offering flexible system query languages and present results using specialized artifact- and task-specific visualizations, including graphs, charts and tree maps. Sotoarc/Sotograph [12] and iPlasma [13] are commercial respectively open source products for comprehension and reverse engineering of software systems. They provide analysis middle-ware in the form of a repository with a fixed metamodel into which systems under inspection are loaded for convenient access. Sotoarc supports modeling of a system’s intended architecture and evaluation of the architecture conformance of its implementation. Furthermore, it can simulate restructurings to evaluate effects of architecture modifications. iPlasma offers, beside architecture analyses, a suite of object-oriented metrics and duplication detection. Furthermore, it provides a language to specify static analyses and a visualization framework and can thus be used as a basis for the development of further interactive analyses.
Project intelligence platforms collect and store product and process related metrics of multiple sources to perform trend or comparative analyses. They are deeply integrated into a software development environment and collect metric data as it originates during development. Flexible query mechanisms often support generation of reports that show charts depicting the evolution of selected metric values over time. If these reports are generated in a frequent manner, they can serve as a project dashboard. Even though query creation has an interactive nature, project intelligence platforms operate autonomously and collect metric data without developer interaction. Project intelligence platforms are usually limited to metric values and allow ad-hoc queries on data from the project’s past. Hackystat [14] is an open source framework for collection and analysis of software development process and product data. It originated from the work of the Collaborative Software Development Laboratory at the University of Hawaii to support software project telemetry [15]. Hackystat offers sensors that gather data during software development and transmit it to a central server for analysis, aggregation and visualization. Via a custom query language, reports can be specified to visualize, correlate or compare measured data. This way, hypotheses about the development process can be tested and impact of process changes on project performance can be evaluated. Although Hackystat offers several sensors that interface with static analysis tools that perform product quality analyses, its emphasis is on process measurement. Microsoft Team Foundation Server [16] is a commercial software product that aims to support collaborative software engineering. Besides source control and issue tracking functionality, it provides data collection and reporting services. Collected source control, issue tracking, build results, static analysis and test execution data is stored in a relational database system from which a reporting engine generates reports that monitor process metrics and visualize trends. The emphasis of the data collection and reporting services is on process related data collection and reporting.
Dashboard toolkits provide libraries of building blocks from which custom-made analysis dashboards, that collect, relate, aggregate and visualize sensor data, can be assembled by configuration. Building block libraries offer sensors for analysis of both product (e. g., code, architecture) and process (e. g., source control or issue management information) related artifacts. Additionally, blocks for presentation allow analysis results to be represented in a variety of formats, including general purpose lists or tables and specialized visualizations such as trees, graphs, charts or tree maps. In contrast to system analysis workbenches that are geared towards an interactive, on-demand explorative analysis of a system snapshot, dashboard toolkits are used for continuous quality analysis and monitoring of a project-specific set of questions. Their scope thus comprises both quality analysis and project controlling. In contrast to project intelligence platforms, that focus on operations on numerical metric values, dashboard toolkits can access sensor information on the level of development artifacts. They can thus exert greater control over sensor operations, which facilitates customization of analyses to project specific settings. Dashboard toolkits can be differentiated by the degree of customizability they provide. Both QALab [17] and Sonar [18] offer pre-configured dashboards that present output from various sensors but offer very limited customization capabilities. QALab creates trend analysis charts displaying the evolution of the number of anomalies of a project. Sonar provides additional visualizations displaying aggregated single-project or cross-project quality information. Customization capabilities of both tools are limited to the choice of applied sensors. XRadar [19] is an open source code report tool for Java-based systems, which integrates XML reports calculated by different sensors via XSLT transformations. The results can be aggregated along the package hierarchy and also stored in the file system for plotting trend graphs of various metrics. Due to the expressiveness of XSLT transformations, aggregation and visualization of the imported analysis results can be configured more flexibly, than with QALab or Sonar. ConQAT [20] is an open source dashboard toolkit that offers a rich library of analyses, filters, aggregations and visualisazions for systems written in various languages. Due to its pipes-and-filters style configuration mechanism, it offers high extensibility and flexibility for project-specific tailoring. ConQAT is described in more detail in the sidebar.
| Sidebar: ConQAT: The Continuous Quality Assessment Toolkit |
The Continuous Quality Assessment Toolkit ConQAT
[21] was developed over the last
three years at the Technische Universität München within the scope
of multiple industrial projects and released as open source in 2007.
The rationale behind developing our own dashboard toolkit was that no
available tool covers all of the requirements we consider to be
essential and we wanted to have a flexible and extensible platform
for our projects and experiments.
ConQAT employs a pipes-and-filters-architecture to achieve the
requirements of customizability and extensibility. Configurable units
dedicated to specific analysis tasks (such as preprocessing,
assessment, aggregation, visualization etc.) are connected in a
dataflow diagram for achieving the desired results. An example of this
is shown in the screen-shot of the accompanying graphical editor. A
complex control center monitoring multiple projects can easily consist
of hundreds of those units, which we call processors. To
simplify the configuration process, reoccurring patterns of processors
can be encapsulated as a block which then can be instantiated
multiple times.
The current version of ConQAT provides more than 200
processors and 40 blocks, and can analyze such diverse artifacts as
source code (Java, C#, C++, PL/1, Cobol and VB), configuration management
systems or Matlab Simulink models. Analysis capabilities range from the
usual basic metrics to complex assessments, such as detecting
violations of the software architecture. The most important aspect
however is the aggregation and presentation of the collected data,
which has to make an overwhelming amount of information accessible to
the user. Thus ConQAT includes configurable processors for aggregation
and visualization using diagrams, tree maps and layouted graphs. To
allow trend analysis of key measurements, all analysis results can be
persisted in a database.
Wherever possible, approved libraries and sensors (such as PMD or
Klocwork) have been integrated or interfaced, while for advanced tasks
for which the currently available tools did not seem mature enough
(such as quality analysis of models) or which are still subject to
active research (e. g., model clone detection [22]) individual
solutions are implemented. If a desired assessment value can not be
calculated using the facilities already provided with ConQAT, custom
processors can be written in Java. Most of the time these are
short classes, as pre- and post-processing tasks and
visualization is already handled by existing processors.
As we consider the customization of a dashboard to the current project
context to be one of the key requirements, a graphical editor (shown
in the screen-shot) for creating and modifying analysis configurations
is available. This way navigating and validating these configurations
is greatly simplified, making the creation of control centers more
intuitive and efficient.![[Uncaptioned image]](/html/1611.09116/assets/cqedit.jpg)
|
3 Experiences
We have worked in various academic as well as industrial projects on different aspects of quality controlling. Tool support has always been an important topic in these projects. Hence, the presented requirements and categorization stem largely from these experiences although they have, in parts, also been identified by others [23]. We use our own dashboard toolkit ConQAT as main example to report in more detail on our practices with tool support for continuous quality controlling.
The re-insurance company Munich Re Group runs a portfolio of diverse, large and long-lived business systems based on the .NET platform. For these, a ConQAT-based quality dashboard has been installed which monitors key maintainability measures such as redundancy and compliance to the system’s architecture and is also used to support manual reviews. Currently it is employed for maintenance and further development of a business system of about 400 kLoC. In the controlling process the identified clones and architecture violations have been reduced based on the tool results. As we observed that the output of individual sensors is often too detailed to identify relevant information, a substantial amount of work has been put into the configuration of suitable aggregators and filters. This has been decisive in order to make only the most relevant problems visible. The lesson learned was that tailorability is a crucial feature of a dashboard.
A somewhat different analysis scenario was encountered by MAN, a truck manufacturer, where continuous quality controlling was to be applied to a model-based development process of embedded systems. Major parts of the power train controller are modeled using Matlab Simulink/TargetLink. The entire implementation is generated from these models. The main object of analysis was not source code but models and the quality analysis tool had to be adapted to that new artifact type. The employed analyses included the collection of various size measures such as number of blocks and states in diagrams or identification of the usage of blocks not supported by the code generator. It showed that easy extensibility is important in order to cope with the variety of artifacts encountered. Additionally, as we could reuse existing parts for graph analysis and layout, we see flexible libraries in dashboards as a crucial support for efficient analysis development.
The IT-consulting company itestra performs quality analyses of very large mainframe applications with the help of ConQAT. These software assessments influence decisions on future development, maintenance and operation of software systems. The source code-related measures are collected, aggregated and inserted into a history database. So far, itestra analyzed systems containing more than 20 MLoC. In each assessment, more than 60 measures are collected, including size statistics (source lines of code, number of procedures, average procedure length), structural data (condition ratio, maximal loop nesting), and redundancy measures (code cloning). The size of these business systems as well as the large number of measures required a scalable tool that allows efficient aggregation of these numbers. Additionally, the systems under evaluation are mainly written in COBOL or PL/1, languages for which only scarce tool support exists. Hence, high extendability as well as aggregations and visualizations were needed to provide a viable foundation for the development of a suitable analysis tool. Only the core parts for each analysis had to be developed, while all of the pre-processing, aggregation, and visualization support of ConQAT integrated seamlessly.
At Technische Universität München we apply continuous quality controlling in programming lab courses not only to monitor product quality but also to give immediate feedback to students. In this context, non-interactive operation is crucial to be able to present students with frequent feedback without straining supervisors’ resources. Moreover, dedicated views are required to provide supervisors with an overview of the whole project while presenting students with feedback on their own work only. Besides this, ConQAT is applied on itself in order to control its own quality.
It is our collective experience that, while each of the tools outlined in the tool classification provides individual value, none of them fully satisfies the above mentioned requirements for continuous quality controlling. Individual sensors are limited to the analysis of specific quality criteria and hence cannot provide comprehensive quality assessments. The interactive usage paradigm of system analysis workbenches makes them unsuited for continuous application during a nightly build. Project intelligence platforms work on data collected by external sensors. Since customization to project specific settings frequently requires adaptation of sensor functionality, their customizability is limited. Finally, the outlined dashboard toolkits are not customizable enough to satisfy the extensibility and diversity requirements. Our highly configurable dashboard toolkit ConQAT is a first step to alleviate these shortcomings.
4 Conclusion
As stated in the beginning of this article, successful quality controlling starts with knowing what to measure; i. e., the definition of relevant quality goals. Though this sounds evident, it has to be stressed because software quality as a technical discipline is all but mature [3]. In contrast to mature industries and despite of the enormous spendings for software there are still neither legally binding nor broadly accepted standards for software quality. The question what is good and bad in software is yet mostly unanswered and forces organizations to find individual innovative quality rules and guidelines.
In addition to individual quality models, tool vendors also have to deal with the tough technical difficulties of (static) software analysis. Writing parsers for programming languages such as C/C++ or even PL/I is already very challenging. However, building effective analyzers requires even stronger efforts, especially for the analysis of the more relevant semantical properties of a software system based on sound heuristics and estimates. Due to these difficulties, some tools unfortunately measure what is easy to measure but not what was important to know.
Due to the combination of a) the individual character of quality rules and b) the difficulties to implement effective analyzes it is currently very unlikely that a single tool of a certain vendor can adequately support all quality controlling needs of an organization.
In many cases, more than one tool will be needed and the user might want to add his or her own quality rules. The tool categories and requirements outlined in this article can serve as a starting point for selecting appropriate tools. A flexible and extensible dashboard toolkit like ConQAT seems to be an attractive technical foundation for quality controlling. It allows to quickly gain benefit from quality controlling with low initial overhead by observing few important properties and communicating them frequently to managers, project leaders and developers. Over time it can be evolved incrementally with the sharpening perception of software quality within the organization.
However, it must be pointed out that, albeit crucial, tool-support is only one aspect of quality controlling. A prerequisite for successful quality controlling is an organization’s readiness to assess and improve quality although many quality deficits have long-term and therefore less obvious consequences. From our experience, this readiness is put to test as soon as it comes to manual quality assessments. Studies again and again show that manual review activities pay off. Still, organizations often try to avoid them as, from a short-term perspective, they are perceived as being too costly. As many essential quality issues, such as the usage of appropriate data structures and meaningful documentation, are semantic in nature and can inherently not be analyzed automatically, we consider this a precarious situation.
References
- [1] David Lorge Parnas. Software aging. In Proc. International Conference on Software Engineering (ICSE ’94), pages 279–287. IEEE Computer Society, 1994.
- [2] Stephen G. Eick, Todd L. Graves, Alan F. Karr, J. S. Marron, and Audris Mockus. Does code decay? assessing the evidence from change management data. IEEE Trans. Softw. Eng., 27(1):1–12, 2001.
- [3] Barbara Kitchenham and Shari Lawrence Pfleeger. Software quality: The elusive target. IEEE Software, 13(1):12–21, 1996.
- [4] S. Wagner, F. Deissenboeck, M. Aichner, J. Wimmer, and M. Schwalb. An evaluation of two bug pattern tools for java. In Proc. of the International Conference on Software Testing, Verification and Validation (ICST). IEEE CS Press, 2008.
- [5] JDepend. http://clarkware.com/software/JDepend.html.
- [6] PMD. http://pmd.sourceforge.net/.
- [7] NDepend. http://www.ndepend.com/.
- [8] FxCop. http://www.gotdotnet.com/Team/FxCop/.
- [9] PC-Lint. http://www.gimpel.com/.
- [10] KLocWork. http://www.klocwork.com.
- [11] JUnit. http://www.junit.org/.
- [12] Sotoarc. http://www.software-tomography.de/.
- [13] iPlasma. http://loose.upt.ro/iplasma/.
- [14] Hackystat. http://www.hackystat.org/.
- [15] Philip M. Johnson, Hongbing Kou, Michael Paulding, Qin Zhang, Aaron Kagawa, and Takuya Yamashita. Improving software development management through software project telemetry. IEEE Softw., 22(4):76–85, 2005.
- [16] Team Foundation Server. http://msdn2.microsoft.com/en-us/teamsystem/aa718934.aspx.
- [17] QLab. http://qalab.sourceforge.net/.
- [18] Sonar. http://sonar.hortis.ch.
- [19] XRadar. http://xradar.sourceforge.net/.
- [20] ConQAT. http://conqat.cs.tum.edu/.
- [21] Florian Deissenboeck, Markus Pizka, and Tilman Seifert. Tool support for continuous quality assessment. In Proc. IEEE International Workshop on Software Technology and Engineering Practice (STEP), pages 127–136. IEEE Computer Society, 2005.
- [22] Florian Deissenboeck, Benjamin Hummel, Elmar Juergens, Bernhard Schaetz, Stefan Wagner, Jean-François Girard, and Stefan Teuchert. Clone detection in automotive model-based development. In Proc. 30th Int. Conf. on Software Engineering (ICSE’08), 2008. To appear.
- [23] Philip M. Johnson. Requirement and design trade-offs in hackystat: An in-process software engineering measurement and analysis system. First Int. Symposium on Empirical Softw. Eng. and Measurement, 2007., 2007.
Biographies
Florian Deissenboeck
is a research assistant at the Software & Systems Engineering group of Prof. M. Broy at the Technische Universität München. Currently he works on his PhD thesis about software quality controlling. His academic interests lie in software maintenance, software product quality and program comprehension. He studied computer science at the Technische Universität München and the Asian Institute of Technology, Bangkok.
Elmar Juergens
works as a research assistant and PhD student at the Software & Systems Engineering group of Prof. M. Broy at the Technische Universität München. His academic interests include software maintenance, clone detection and usage analysis. He studied computer science at the Technische Universität München and the Universidad Carlos III in Madrid, Spain.
Benjamin Hummel
is a research assistant and PhD student at the Software & Systems Engineering group of Prof. M. Broy at the Technische Universität München. His research interests are modeling and verification of discrete and hybrid systems, and software quality and maintenance. He received a diploma in computer science from the Technische Universität München and is a member of the ACM and the Gesellschaft für Informatik (GI).
Stefan Wagner
works as a post-doctoral researcher at the Software & Systems Engineering group of Prof. M. Broy at the Technische Universität München. His main interests include quality modeling and analysis, especially the connection to economics. He studied computer science in Augsburg and Edinburgh and holds a doctoral degree in computer science from the Technische Universität München. He is a member of ACM SIGSOFT, the IEEE Computer Society, and the Gesellschaft für Informatik (GI).
Benedikt Mas y Parareda
is an IT consultant researcher working for itestra GmbH, a spin-off of the Technische Universität München. He specializes in software assessment and quality evaluation. Mr. Mas y Parareda studied Computer Science at the Technische Universität München and the United Nations University in Macau.
Markus Pizka
is co-founder and managing director of the German IT consultancy itestra GmbH. He received a Dr. degree from the Technische Universität München for his work on Distributed Operating Systems. He later shared his experiences in compilers and reverse engineering with Microsoft Research, Cambridge and went on as a project leader for a large German software company. He then worked as an assistant professor at the Technische Universität München where he established a competence center for software maintenance.