Structure and Bonding in Amorphous Cr1-xCx Nanocomposite Thin Films: X-ray Absorption Spectra and First-Principles Calculations
Abstract
The local structure and chemical bonding in two-phase amorphous Cr1-xCx nanocomposite thin films are investigated by Cr -edge () X-ray absorption near-edge structure (XANES) and extended X-ray absorption fine structure (EXAFS) spectroscopies in comparison to theory. By utilizing the computationally efficient stochastic quenching (SQ) technique, we reveal the complexity of different Cr-sites in the transition metal carbides, highlighting the need for large scale averaging to obtain theoretical XANES and EXAFS spectra for comparison with measurements. As shown in this work, it is advantageous to use ab initio theory as an assessment to correctly model and fit experimental spectra and investigate the trends of bond lengths and coordination numbers in complex amorphous materials. With sufficient total carbon content ( 30 at%), we find that the short-range coordination in the amorphous carbide phase exhibit similarities to that of a Cr7C3±y structure, while excessive carbons assemble in the amorphous carbon phase.
I Introduction
In the quest for new coating materials with outperforming corrosion and wear resistance properties, chromium carbide thin films are of high interest in applications for electrical contacts and decorative purposes Cavaleiro ; Cheng . Metal carbide films produced by physical vapor deposition (PVD), show different microstructures, ranging from epitaxial single-crystal materials to nanocomposites with crystallites of the carbide in an amorphous carbon/amorphous carbide matrix Vieira1 ; Vieira2 . Completely amorphous metal carbide coatings are also found, in both binary and ternary systems such as Cr-C, Fe-C, Ni-C, and W-Fe-C Cavaleiro ; Furlan2014 ; Furlan2015 . It is an important methodological challenge to theoretically model such complex non-crystalline environments, in order to understand their structure and bonding properties.
In the case of crystalline materials, there is a multitude of successful combined experimental and theoretical studies in the literature, see for example Refs. Magnuson2004 ; Magnuson2008 ; Magnuson2008b ; Mizoguchi2010 ; Olovsson2011 ; Olovsson2013 . On the contrary, it is far from straightforward to model amorphous structures for studying materials properties. The lack of long-range translational symmetry provides a formidable challenge for obtaining suitable model structures of the systems. This is also the case experimentally, as the samples become X-ray amorphous with no usable diffraction peaks to determine the structure. Furthermore, in the computation of XANES and EXAFS spectra, the absence of symmetry means that the excitation response of each atom is unique and can be very distinct. As spectral measurements are effective samplings of individual excitations of atoms in different local chemical environments, an average over a large number of sites must be considered in a theoretical approach. While detailed explanation for the formation of non-crystalline phases during PVD in certain carbide systems remains unclear, it involves a significant quenching for conditions with neutral atoms and substrate temperatures below the melting point of the carbide, giving rise to limited surface mobility where atoms only find locally favorable sites. It is known that amorphous films often occur in metallic carbide systems where crystalline phases exhibit structural units that have carbon atoms in a mixture of both octahedral and prismatic sites Bauer-Grosse1 .
Previous experimental studies of amorphous Cr1-xCx films Gaskell ; Bauer-Grosse2 ; Music ; Jiang ; Andersson2012 suggest that the films contain two components; an amorphous metal-rich carbide phase, and an amorphous carbon-rich phase. With increasing total carbon content, the amorphous carbon-rich contribution is believed to grow and incorporate the additional carbon, leaving the metal-rich phase more or less constant in carbon content Gaskell ; Bauer-Grosse2 ; Music ; Jiang ; Andersson2012 ; Magnuson1 . From C X-ray photoelectron spectroscopy (XPS) measurements on the same samples as in this work, it was determined, based on quantitative estimations of carbide and a-C contributions in the spectra, that the amorphous metal carbide phase contained approximately 20-30 at.% of carbon. This is in the same compositional range as e.g. the crystalline Cr23C6 and Cr7C3 phases. On the other hand, the amorphous carbon phase contained approximately pure carbon with a high amount of -hybridized graphene-like carbon for large amounts of total carbon contents Magnuson2 . However, to identify the detailed structure and the bonding of the carbide phase in these complex non-equilibrium materials Magnuson2 , more detailed experimental and theoretical studies are needed, in particular focusing on the surrounding of the metal atoms.
In this work, we investigate and compare experiments for nanocomposite Cr1-xCx thin films with theory for completely amorphous systems as a function of carbon concentration, together with ideal crystal structures. X-ray absorption near-edge structure (XANES) and extended X-ray absorption fine structure (EXAFS) spectroscopies are ideal tools for characterizing the structure and chemical bonding in crystalline materials Cockayne ; Jansson . Since these techniques are element specific, we anticipate that they can also be applied as efficient probes of the local environment in more complex non-crystalline materials. In particular, we investigate the Cr near-edge () and EXAFS signals of the CrCx carbide phase in amorphous Cr1-xCx thin films by experiment and ab initio calculations, including metal Cr for comparison. In order to model completely amorphous systems, we apply the so-called stochastic quenching (SQ) method Kadas ; Holmstrom1 ; Holmstrom2 .
II Theory
II.1 Structural models
All structural models were obtained using density functional theory (DFT) Hohenberg1964 ; Kohn1965 utilizing the projector augmented wave (PAW) Blochl1994 method as implemented in the Vienna ab-initio simulation package (VASP) Kresse1 ; Kresse2 . The generalized gradient approximation (GGA) PBE1996 for electronic exchange and correlation effects was used in these simulations. The atoms are first placed randomly in a supercell and then relaxed using DFT until the force on each atom is negligible Kadas ; Holmstrom1 ; Holmstrom2 . In this way a large set of structures is obtained, which together represent a specific concentration, at a comparatively low computational cost. Finally, to produce the theoretical X-ray absorption spectra, an average is taken over spectra computed at each Cr-atom site in the amorphous structure. In order to consider possible microstructures and phases within an amorphous matrix, we also consider crystalline CrCx structures that exist experimentally: cF116-Cr23C6, oP16-Cr3C, hP20-Cr7C3, hP80-Cr7C3, oP40-Cr7C3, oP20-Cr3C2, as well as the cubic B1 (octahedral) and hypothetical hexagonal hP2 (trigonal prismatic) type of CrC. All spectra are calculated by employing the computationally efficient real-space Green’s function code FEFF9 Rehr2000 ; Rehr2009 ; Rehr2010 . In this way it is possible to produce the many individual spectra which are needed to represent amorphous structures. Different magnetic structures, ferromagnetic and antiferromagnetic were considered as initial configurations, although, with the exception of B1 CrC, magnetic moments relaxed to zero or almost zero during the electronic structure calculation.
The structural models used for simulations of the spectra of amorphous Cr0.67C0.33, Cr0.5C0.5, and Cr0.33C0.67 were obtained using the stochastic quenching approach Holmstrom1 ; Holmstrom2 ; Kadas in combination with DFT. Cubic supercells containing 250 atoms (Cr0.5C0.5) or 252 atoms (Cr0.67C0.33 and Cr0.33C0.67) were used, allowing for the selected concentrations to be modeled accurately. The stochastic quenching procedure was carried out in a similar procedure as in Ref. Kadas . The atomic positions were initiated with a random distribution in the simulation box, avoiding, for numerical stability concerns in the electronic structure calculations, pair distributions shorter than 0.8 Å, which is about 0.6 times the calculated C-C dimer distance in vacuum. This random structure is then quenched by gradually relaxing the internal atomic positions inside the supercell, until they reach locally stable positions with forces on each ion being smaller or in the order of 0.02 eV/Å.
For each composition, five or six volumes, with 19-25 SQ structures per volume, were used to obtain the equilibrium volume with a cubic polynomial fit. A similar number of SQ structures were then used to obtain average pair distribution functions g(r) for each bond type and to simulate spectroscopic properties. The calculations were initiated with individual Cr atoms having either spin up or spin down magnetic polarization with equal probability and a spatially random distribution in order to simulate a paramagnetic configuration. Some Cr atoms, in particular in the compositions Cr0.33C0.67, retained a magnetic moment after the SQ procedure with a mean magnitude of about 0.8 with minimum and maximum magnitudes 0.1 and 2.2 , respectively. For the composition Cr0.5C0.5 the corresponding mean value is about 0.3 with a few of the Cr moments being around 2 . For the Cr0.67C0.33 composition most of the local moments disappear with a mean magnitude of around 0.02 . Overall, the local magnetic moments are clearly less robust as compared to similar simulations for the related amorphous CrN-system Lindmaa2013 . A Gaussian broadening of the calculated pair distances of 0.2 Å was used in the simulations. Figure 1 shows one of the supercells (SQ1) generated by the procedure of the SQ method in order to model amorphous Cr0.5C0.5. Large blue spheres correspond to Cr and smaller brown spheres are C atoms. In order to obtain the theoretical X-ray absorption spectrum for an amorphous system, an average of all the spectra for the different SQ supercells and Cr sites was performed.
II.2 X-ray absorption spectra
In order to produce theoretical XANES and EXAFS spectra for the structures described above, we employ the single particle Green’s function technique within DFT Hohenberg1964 ; Kohn1965 . All calculations were performed utilizing the computationally efficient ab initio real-space Green’s function (RSGF) approach of the FEFF9 code Rehr2000 ; Rehr2009 ; Rehr2010 . For example, in the case of Cr0.5C0.5 the resulting Cr -edge spectrum is an average over 22 SQ structures, each in turn an average over 125 Cr sites, amounting to 2750 spectra in total to represent the amorphous system. All the potentials are calculated self-consistently and the default Hedin-Lundquist exchange correlation potential is used. In more detail, to obtain accurate near-edge structures considering XANES, we utilized the real-space full multiple scattering (RSFMS) approach within FEFF9. Here, the potentials were calculated for the central scattering Cr atom and for the other Cr and C atoms. To take the final state effect into account, a fully screened core-hole was used for the central scattering atom, i.e. applying the final-state rule, or core-hole approximation. Clusters with more than 550 atoms were employed in order to converge the spectral features in the different systems. For a brief overview of different methodologies for calculating XANES see Ref. Mizoguchi2010 and references within. For EXAFS, which considers the energy region far above the near-edge, it is sufficient to use multiple scattering paths with no approximation for the core-hole Rehr2000 . Finally, the theoretical spectra were aligned with experiment by applying a rigid shift.
III Experimental
Amorphous chromium carbide (Cr1-xCx) samples with different carbon content were made using direct current (DC) magnetron sputtering as described elsewhere Andersson2012 ; Magnuson2 . It was also found Andersson2012 that the samples contain about 2-5 at.% oxygen present. The XANES and EXAFS spectra were measured at the undulator beamline I811 on the MAX II ring of the MAX IV Laboratory, Lund University, Sweden 811 . The energy resolution at the Cr edge of the beamline monochromator was better than 0.5 eV. The X-ray absorption spectra were recorded in reflection mode by collecting the fluorescence yield using a PIPS detector from -150 eV below to 1000 eV above the Cr absorption edge (5989 eV) with 0.5 eV energy steps. To avoid self-absorption effects in the sample and Bragg peaks from the substrate, the incidence angle on the sample was varied in 0.25 degrees steps in a maximum range of 3 degrees from normal incidence with a step motor.
Based on the XANES fitting results (described in the next Section), two Cr-C and two Cr-Cr scattering paths obtained from FEFF9 Rehr2000 ; Rehr2009 ; Rehr2010 were included in the EXAFS fitting procedure with hP20-Cr7C3 as a model system using the VIPER software package Klementev2001 . The reference energy was set to the pre-peak of each Cr X-ray absorption spectrum as determined from the first peak of the derivative of each spectrum relative to the pure bcc-Cr reference sample. In the fitting procedure, was set to 5988.6 eV (25% C), +0.1 eV (42 and 47%, as compared to the 25% C sample), +0.4 eV (67% C) and +0.6 eV (85% C), respectively.
The EXAFS functions were extracted from the raw absorption data after removing remaining glitches originating from substrate diffraction peaks, subsequent background subtraction, and summarizing and averaging of 15 absorption spectra. The bond distances (R), number of neighbors (N), Debye-Waller factors (, representing the amount of disorder) and =reduced as the squared area of the residual, were determined by fitting the back-Fourier-transform signal between =0-12 Å-1 obtained from the Fourier-transform within =0.7-3 Å of the first coordination shell using a Hanning window function ) Egami and a global electron reduction factor of =0.8. The calculated pairs of Cr-C and Cr-Cr 1st and 2nd scattering paths in the model were obtained using the FEFF9 code Rehr2000 ; Rehr2009 ; Rehr2010 .
IV Results and discussion
In this Section, we start by considering theoretical XANES and EXAFS Cr -edge spectra for the amorphous and crystal chromium carbide structures, with a comparison to measurements carried out for the thin film systems and pure Cr metal. An analysis of the XANES data was done by fitting the measured spectra with the calculations using a superposition of an amorphous phase and a smaller contribution of different crystalline phases. Using the results of the XANES fitting, an analysis of the EXAFS data was carried out for the experimental data using a standard fitting procedure for crystalline materials, in order to obtain reduced (radial) pair distribution functions (RDFs), that are compared to theoretical RDF results. Finally, the trend in the structural parameters of bond lengths and coordination numbers extracted from the EXAFS analysis are compared and discussed with theoretical values.
In Figure 2, the large differences of the theoretical a) XANES and b) EXAFS spectra in the case of Cr0.5C0.5 are shown. The upper parts of the two panels a) and b) give the Cr -edge spectra calculated over the 125 different Cr-sites (gray lines) for the SQ1 structure illustrated in Fig. 1. The averaged spectra are shown as solid black lines. The lower parts of the panels correspond to the averaged results obtained for each of the 22 SQ structures (gray lines). Finally, the resulting XANES and EXAFS spectra over the whole amorphous Cr0.5C0.5 structure are given by the solid black lines in the lower part of each panel. As observed in Fig. 2, the X-ray absorption fine structures are highly sensitive to the atom local environment in the amorphous matrix. Similar behavior was found at the other concentrations.
Our result in Fig. 2 contains an important message to theoreticians working with spectroscopical simulations of disordered materials, and in particular amorphous substances. It is clear that in order to give even a qualitatively reasonable description of the Cr XANES or EXAFS spectra, averaging over hundreds of atomic sites is needed. However, for a quantitative simulation of the average signal, which is what is measured experimentally, in particular for the EXAFS case it might not be enough to consider just one amorphous supercell. It can be seen in the lower curve of Fig. 2 that the computed average signals for some of the SQ supercells deviates considerably from the average line of all the samples. Thus, it might not be reliable to simulate EXAFS spectra with just one supercell, say generated with molecular dynamics and containing one- or two hundred atoms, even if the average spectra of all atoms in the supercell is considered.
In Figure 3, a comparison of theoretical a) XANES and b) EXAFS spectra is made between amorphous Cr1-xCx and crystalline CrCx structures. In the upper parts of each panel, results for three different amorphous Cr1-xCx structures with concentrations (blue dashed lines), (green line) and (red dotted line) are shown. In the lower part of each panel, the corresponding spectra for the crystals are presented: bcc-Cr, cF116-Cr23C6, oP16-Cr3C, hP20-Cr7C3, hP80-Cr7C3, oP40-Cr7C3, oP20-Cr3C2, structures from experiment and cubic B1 (octahedral NaCl) and hypothetical hexagonal hP2 (trigonal prismatic WC) type of CrC.
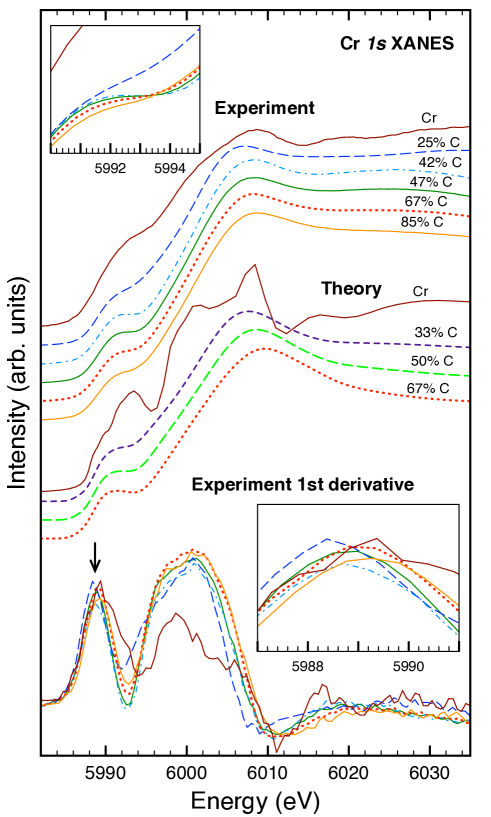
In Figure 4, a direct comparison is made between the Cr -edge XANES spectra from experimental measurements for different compositions, =0.25, 0.42, 0.47, 0.67 and 0.85 (top), and the structures obtained by our theoretical modeling =0.33, 0.5 and 0.67 (middle), including results for pure crystal Cr. The theoretical concentrations are chosen to capture the overall trend in the system with the variation of carbon concentration. At the bottom, the first derivatives of the experimental spectra are shown. The chemical shift to higher energy is a signature of higher ionization of the chemical state of the absorbing Cr atoms as the carbon content increses. For the EXAFS spectra, theory reproduces the general shape of the measurements. As in the case of XANES, the amorphous materials yield softer spectral features compared to crystalline materials.
Typically, it is most fruitful to analyze the measured EXAFS data in the form of reduced pair distribution functions, which provide information about the average Cr-Cr and Cr-C bond lengths, which in turn can be compared with corresponding theoretical pair distribution functions. In order to evaluate the probability of different compositions, we have fitted each measured XANES spectrum with the theoretical fully amorphous 33 C structure together with each one of the crystal structure candidates as listed in Table 1. The curve fitting analysis was done using the SPectral ANalysis by Curve Fitting macro package (SPANCF) software Kukk package. In Figure 5, an example is shown for the fit (black line) of the 25 C sample (red dots) with amorphous Cr67C33 (green line) and hP20-Cr7C3 (blue line). The background was taken into account both by an integrated and a linear background (dashed lines) and the residual is shown by a thin black curve. The square of the residual was used to compare the quality of different fittings. From the fitting analysis of the XANES data in Table 1, the results show that the contribution of the amorphous Cr1-xCx phase increases with carbon content from 40% to 90%. In all simulations the Cr7C3, Cr23C6 and Cr3C2 are the most likely crystalline-like coordination while WC, pure Cr, Cr3C and B1 are unlikely.
By combining experimental and theoretical XANES and EXAFS data at the Cr -edge in Figs. 2-5 we make several interesting observations. Both in the XANES (Fig. 4) and the EXAFS spectra, we note that the main features observed in experiment are also captured in the calculated spectra. Concerning the XANES data, it is known that the energy position and the shape of the main peak and the pre-edge depends on the chemical state of the absorbing atom. The pre-peak is due to a transition of a electron to hybridized and (Cr - C ) states. On the contrary, the main peak is a pure Cr dipole transition. The first derivative of the XANES in the bottom of Fig. 4 highlights the differences between the samples. The intensity of the pre-peak is a signature of the amount of - hybridization Yamamoto2008 , which here decreases as a function of carbon content. Generally, the chemical state of the absorbing Cr atom is different in Cr metal, Cr3C2 and Cr2O3 Singh1 ; Pantelouris and the spectra shift to higher energies with increasing average oxidation states that are higher than in Cr metal. Note that this could also be affected by the presence of small amounts of oxygen in the samples, up to 5 at.% Andersson2012 , though it is difficult to precisely estimate the effect. Although the shape of the peaks and intensities are similar in all the studied Cr1-xCx samples (Fig. 4) there is a noticeable chemical energy shift towards higher energy with increasing C content.
It is also possible to distinguish these differences in a close study of the spectral fine structure. For instance, the samples containing 42 and 47% C show sharper resolved pre-edge peaks (Fig. 4). In the case of the calculated spectra for the amorphous systems (Fig. 2a), the individual spectrum of each and every atom is unique with a detailed fine structure of the pre-edge peak and the main line. The crystallite systems (Fig. 3a) present very distinct and sharp spectral features both at the main peak and the pre-edge. However, the spread of the different crystal spectra is smaller than the rich variation found within an amorphous structure. For the amorphous Cr1-xCx materials, the averaged spectra over thousands of Cr atoms show more smooth features as compared with the crystallites, in agreement with measurements. Still, the overall shape of the spectra with pre-edge and main peak is similar. These spectral features are also seen for the pure Cr metal, similar to previous results Arcon1998 .
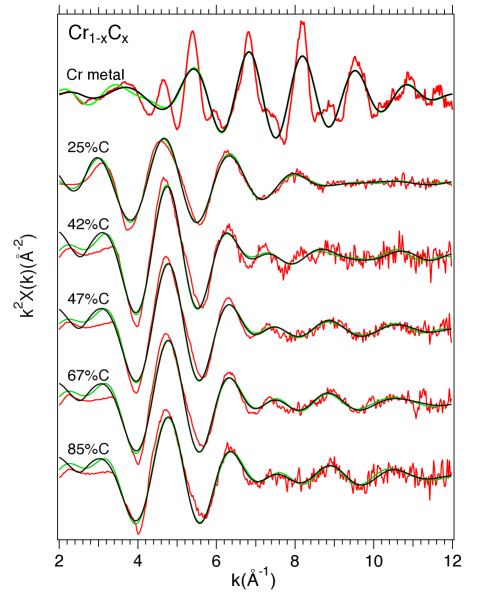
Figure 6 shows experimental EXAFS data in -space of bcc-Cr metal and the five amorphous nanocomposite Cr1-xCx films obtained after normalizing and background removal using the VIPER software package Klementev2001 . For bcc-Cr, the main sharp oscillations occur in the 4-11 Å-1 region. On the contrary, for the amorphous Cr1-xCx films, the main oscillations occur in the region =2-7 Å-1, whereas for higher -values the oscillations are damped out in increasing noise from about =12 Å-1. This behavior is characteristic of backscattering from light C atoms Egami .
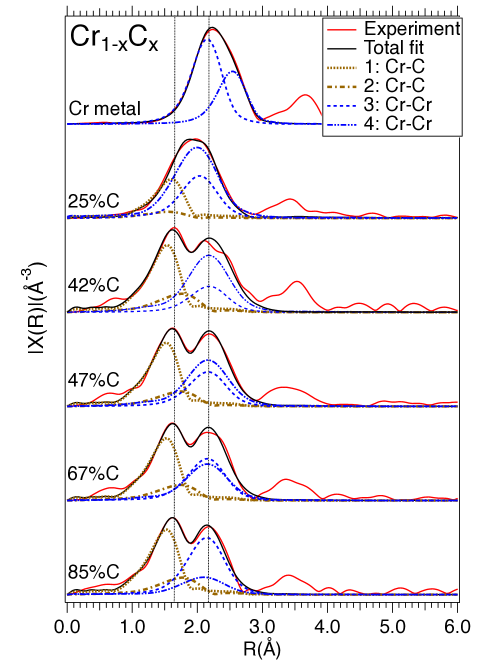
Figure 7 shows the radial distribution functions, obtained directly by Fourier transforming the measured EXAFS structure factors in Fig. 6 by the standard EXAFS procedure Klementev2001 . The quantitative analysis was made using weight as is normal for conductive samples with a reduced -range between 0 and 12 Å-1. The main peaks are dominated by the short-range order of the Cr-C and Cr-Cr orbital overlaps observed at 1.5 Å and 2.2 Å, in the first coordination shell, corresponding to 2-6 Å-1 in Fig. 6. Above 2.5 Å, corresponding to 6 Å-1, a smaller peak is observed at 3-3.5 Å due to the second coordination shell. Note that the radius-values on the abscissa shown in Fig. 7 represent raw data and are shown non-phase shifted to absolute values.
Table 2 shows the results of the EXAFS fitting using scattering paths from the most probable structure (hP20-Cr7C3 with a large unit cell with lattice parameters ==6.96 Å and =4.45 Å) from the XANES results in Table 1. For amorphous materials, it is not possible to choose a perfect model structure due to the inherent disorder, however, selecting a simpler (and less probable) model such as B1-CrC results in less accurate fitting with larger residuals. The phase shift ( +0.5 Å) is included in the fitting model for the bond lengths for easier comparison with the theoretical values. The details of the fitting procedure are described in the Experimental Section III.
The first line in Table 2 presents the fitting results of the reference sample of pure bcc-Cr with known coordination numbers for the first (8) and second (6) scattering paths. These nearest neighbor scattering paths represent the bond lengths space diagonal from the corner of the unit cell to the center (2.49 Å) and the edge length equal to the lattice parameter (2.88 Å). As expected, the amorphous samples on the following lines exhibit larger Debye-Waller factors than crystal bcc-Cr due to a greater amount of disorder. For comparison of the coordination numbers, the Debye-Waller factors were kept fixed for the amorphous samples.
Generally, we observe a trend of decreasing Cr-Cr coordination numbers (N1+N2) from 9.5, 7.6, 6.7, 5.9 to 4.6 with increasing carbon content. With exception of the 25% C sample, we also observe that the Cr-Cr and Cr-C radii slightly decrease as a function of carbon content. For the Cr-C coordination numbers, the decreasing trend is less obvious although as it first increases from 1.7 to 4.1 as the carbon content increases from 25% C to 42% C, probably associated with the formation of domain structures with interfaces. Thereafter, the coordination number decreases to 3.6 at 47% C, followed by a small increase to 3.7 and 3.8 as a function of carbon content. The dashed curves in Fig. 7 show the individual scattering path components resulting from fitting the pairs of Cr-C (1,2) and Cr-Cr (3,4) contributions in the first coordination shell obtained from FEFF9 of the hP20-Cr7C3 structure.
As observed in Fig. 7 (and Table 2), the Cr-Cr peaks in the first coordination shell are not experimentally resolved from the Cr-C peaks for the lowest carbon content (25 at%). As will be discussed below, the most likely explanation is that the difference between the Cr-C and Cr-Cr bonds becomes smaller at low C-content due to carbon vacancies in the structure. The Cr-Cr bond distance is shorter in the carbide compared to the more open reference bcc-Cr structure. As the carbon content increases to 42 at%, the Cr-Cr peak shifts to larger radius values due to the expansion of the structure. At the same time, the Cr-C peak becomes clearly distinguished at lower radius. For carbon contents above 42 at% the Cr-C and Cr-Cr peaks stays approximately at the same values as indicated by the vertical dotted lines. This signifies that the carbide structure remains the same, independent of carbon content. For the second coordination shell corresponding to larger Cr-Cr and Cr-C distances between 3.7 - 4.2 Å, it is interesting to notice that the relative intensity is rather independent of carbon content while the shape changes.
Figure 8 shows theoretical (radial) pair distribution functions g(r) obtained directly from the SQ structures for amorphous Cr0.33C0.67, Cr0.5C0.5, and Cr0.67C0.33. From top to bottom, the graphs display g(r) for Cr-Cr, Cr-C and C-C, respectively. The inset is zoomed in on the first Cr-Cr peak, illustrating the small but distinct shift to larger Cr-Cr distances upon increasing carbon content. The pair distribution function g(r) is related to the reduced pair distribution function G(r) by g(r)=G(r)/4+1, where is the average number density of the material. The (radial) pair-distribution function is normalized so that g(r) 1 when r Egami . Note that while the theoretical g(r) is split into separate parts, G(r) obtained from the measurements includes all the Cr bond lengths, in particular, the Cr-Cr and Cr-C peaks in the first coordination shell.
Figure 9 shows theoretical Cr-Cr, Cr-C and C-C g(r) obtained from the optimized geometries of crystalline CrCx phases: cF116-Cr23C6, oP16-Cr3C, hP20-Cr7C3, hP80-Cr7C3, oP40-Cr7C3, oP20-Cr3C2, the cubic B1 (octahedral) and hP2 (trigonal prismatic, WC) type CrC and bcc-Cr. These are the same phases whose XANES and EXAFS spectra are shown previously in Fig. 3. Calculated average bond lengths and nearest neighbors are summarized in Table 3 for the amorphous systems and crystalline phases, also including C-C bonds.
As shown by the EXAFS results in Table 3, we generally observe that the crystalline bond lengths are similar to both the theoretical fully amorphous structures and measurements (Table 2), and the coordination numbers are closer to the measurements. Considering the bond lengths, Cr7C3 phases give the closest fit with the XANES measurements (Table 1). From the fitting of the XANES measurements to the theoretical results, we find that the dominant contribution is amorphous CrCx carbide with a coordination that is most similar to Cr7C3±y carbide in all the samples, ranging from 30 at%. This is followed by less possible contributions of coordination similar to Cr23C6, Cr3C2 and Cr3C. Note that these results are in a general good agreement with the previous experimental findings by Maury et al. Maury1990 and Nygren et al. Nygren2014 .
In Table 3, a very small increase of both the Cr-C and Cr-Cr bond lengths as a function of C content is predicted in the theoretical purely amorphous structures. This is consistent with the observed increase in crystal carbide lattice parameters when they are present in nanocrystal form in a carbon matrix Jansson . This trend is possibly due to the fact that the carbon-rich environment induces charge-transfer that reduces the electron concentration around the Cr atoms with a following reduction of the strength of Cr-Cr bonding. In addition, our calculations of pure amorphous materials predict a reduction of the coordination numbers of Cr and an increase of coordination numbers of C as a function of carbon content. The predicted reduction of the coordination number of Cr is consistent with our measurements. However, an increase in the coordination number of C is only experimentally observed between the 25% and 42% samples while at higher C contents, a weak decrease is observed. This could be due to the fact that the size of the amorphous CrCx carbide and amorphous carbon domains changes as a function of total carbon content. As observed in Transmission Electron Microscopy (TEM) Magnuson2 , domain sizes are less than 1 nm for x=0.25, about 3 nm for x=0.47, and about 2 nm for the higher carbon contents. Thus, the situation in amorphous nanocomposites is more complex than in pure amorphous materials as there is also a contribution from the interface grain boundaries that changes as a function of total carbon content. Furthermore, for the CrCx carbide phase, there are at least two different competing effects that can give rise to a change in bond length: i) at low C-content, the Cr-rich phase has vacancies that cause an increase or an decrease of the lattice constant that has a maximum for under-stoichiometric carbide. ii) more carbon atoms filling into the vacancies of the structure gives rise to a larger lattice parameter , see e.g., Ref. Jansson .
In a previous experimental study on the same samples Magnuson2 , =0.25 was observed to have the most amorphous character, in High Resolution Transmission Electron Microscopy (HRTEM). A possible interpretation is that the low carbon concentration sample can be described with a Cr7C3±y coordination with -0.5, prohibited from forming the optimal structure by carbon vacancies. The fitting with theoretical XANES spectra (Table 1) does not indicate a change in structure or a possible concentration of bcc-Cr, while having the lowest amorphous character as compared with the other samples. We find that in general, EXAFS modeling can give useful information about the local structure in amorphous materials but largely depends on the chosen model. Therefore, it is important to use ab initio theory as a complement.
While the present work focus on new theoretical and experimental results for the Cr -edge, the corresponding results for the carbon -edge can provide valuable complementary information. Therefore, it is also of interest to compare the theoretical C-C bond for the amorphous structures and crystallites (Fig. 8, 9 and Table 3) with measurements. Generally, the calculated Cr-C and Cr-Cr bond lengths were found to be rather similar between the crystallites and amorphous structures. However, the theoretical C-C bond distances are strikingly different in amorphous carbides (1.5 Å) compared to crystalline carbide materials (3 Å), which are closer to the second C-C coordination shell. As discussed in a previous work Magnuson2 , these results qualitatively agree well with the relative distribution of carbon in the carbidic, CrCx phase and the amorphous carbon phase as reported in Ref. Andersson2012 ; Magnuson1 . For comparison, the C-C bond lengths are 1.5 Å in a-C, graphite and diamond Singh2 ; Singh3 ; Darmstadt . The experimentally observed C-C bond lengths (2 Å) Magnuson2 are larger than the theoretical, but significantly shorter than the bonds for the CrC crystallites in Table 3, which are similar to previous calculations Li2011 . Note that in this study, the Cr-C bond length ( 2.0 Å) was extracted from EXAFS modeling, while in Ref. Magnuson2 the bond length ( 2.2 Å) was only estimated directly from the RDF obtained from electron energy loss spectroscopy with lower energy resolution.
V Conclusions
With the combination of experiment and theory for XANES and EXAFS, we have shown that it is possible to obtain detailed information about the local structure in amorphous nanocomposite materials. Using the computationally efficient ab initio stochastic quenching method, we modeled fully amorphous structures, taking into account local Cr magnetic moments in the derivation. Experimentally, amorphous structures require advanced fitting procedures where the result is very sensitive to the structure of the model. Amorphous two-phase Cr1-xCx nanocomposite films were investigated, consisting of a chromium-rich amorphous carbide phase and an amorphous carbon-rich phase. We find that the short-range coordination in the Cr-rich amorphous phase is similar to that of a hexagonal Cr7C3±y structure. At total carbon contents below 30 at%, the Cr-rich phase is clearly under-stoichiometric with carbon vacancies that causes shorter Cr-Cr bond lengths and directly depend on the packing and orbital overlap with the Cr-C bonds. Furthermore, the Cr-Cr bond length in the amorphous carbide has shorter bond lengths than the more open structure of bcc-Cr metal (space diagonal=2.49 Å, lattice parameter =2.88 Å) that indicates stronger bonds. Above 30 at% total carbon content, the structure of the amorphous Cr7C3±y-like domains remains, while the excessive carbons assemble in the amorphous carbon phase. The coordination numbers in the first coordination shell of Cr decreases as a function of total carbon content from 9.5 to 4.6, while the coordination number of C only weakly increases. This is associated with a smaller number and size of the Cr-rich domains causing a larger fraction of interface bonding that lacks Cr-nearest neighbors on one side. Theoretically, we also predict that the C-C bond lengths are very sensitive to the local structure, with considerably shorter bond lengths in amorphous materials (1.5Å) compared to various crystals (2.8-3.2Å). Generally, it is important to use theory as an assessment to investigate the trends in complex amorphous materials.
VI Acknowledgement
We would like to thank the staff at MAX-lab for experimental support and U. Jansson and M. Andersson for providing the samples. This work was supported by the Swedish Research Council (VR) Linnaeus Grant LiLi-NFM, the FUNCASE project supported Swedish Strategic Research Foundation (SSF). W.O. acknowledge financial support from VR Grant No. 621-2011-4426, the Swedish Government Strategic Research Area in Materials Science on Functional Materials at Linköping University (Faculty Grant SFO-Mat-LiU No 2009 00971), Knut and Alice Wallenbergs Foundation project Strong Field Physics and New States of Matter 2014-2019 (COTXS). B.A. would like to thank E. Holmström and R. Lizárraga for support with the SQ method and acknowledges financial support by the Swedish Research Council (VR) through the young researcher grant No. 621-2011-4417 and the international career grant No. 330-2014-6336 and Marie Sklodowska Curie Actions, Cofund, Project INCA 600398. The calculations were performed using supercomputer resources provided by the Swedish National Infrastructure for Computing (SNIC) at the National Supercomputer Centre (NSC) and Center for Parallel Computing (PDC).
References
- (1) Cavaleiro, A.; De Hosson, J. T. M. Nanostructured Coatings; Springer: New York, 2007.
- (2) Cheng, Y. Q.; Ma, E. Atomic-Level Structure and Structure-Property Relationship in Metallic Glasses. Prog. Mat. Science 2011, 56, 379.
- (3) Trindade, B.; Vitiera, M. T.; Bauer Grosse, E. In Situ High Temperature Crystallization Study of Sputter Deposited Amorphous W-Fe-C Films. Acta Metallurgica et Materialia 1995, 43, 93-99.
- (4) Trindade, B.; Vitiera, M. T.; Bauer Grosse, E. Characterization of W-Me-C (Me = Fe, Co) Films and Their Structural Behaviour with Temperature. Mat. Sci. Eng. A 1994, A174, 165-171.
- (5) Furlan, A.; Lu, J.; Hultman, L.; Jansson, U.; Magnusson, M. Crystallization Characteristics and Chemical Bonding Properties of Nickel Carbide Thin Film Nanocomposites. J. Phys.: Condens. Matt. 2014, 26, 415501.
- (6) Furlan, A.; Jansson, U.; Lu, J.; Hultman, L.; Magnusson, M. Structure and Bonding in Amorphous Iron Carbide Thin Films. J. Phys.: Condens. Matt. 2015, 27, 045002.
- (7) Magnuson, M.; Butorin, S. M.; Såthe, C.; Nordgren, J.; Ravindran, P. Spin Transition in LaCoO3 Investigated by Resonant Soft X-Ray Emission Spectroscopy. Europhys. Lett. 2004, 68, 289-295.
- (8) Magnuson, M.; Wilhelmsson, O.; Mattesini, M.; Li, S.; Ahuja, R.; Eriksson, O.; Högberg, H.; Hultman, L.; Jansson, U. Anisotropy in the Electronic Structure of V2GeC Investigated by Soft X-Ray Emission Spectroscopy and First-Principles Theory. Phys. Rev. B 2008, 78, 035117.
- (9) Magnuson, M.; Mattesini, M.; Höglund, C.; Abrikosov, I. A.; Birch, J.; Hultman, L. Electronic Structure Investigation of the Cubic Inverse Perovskite Sc3AlN. Phys. Rev. B 2008, 78, 235102.
- (10) Mizoguchi, T.; Olovsson, W.; Ikeno, H.; Tanaka, I. Theoretical ELNES using One-Particle and Multi-Particle Calculations. Micron 2010, 41, 695-709.
- (11) Olovsson, W.; Tanaka, I.; Mizoguchi, T.; Radtke, G.; Puschnig, P.; Ambrosch-Draxl, C. Al L2,3 Edge X-Ray Absorption Spectra in III-V Semiconductors: Many-Body Perturbation Theory in Comparison with Experiment. Phys. Rev. B 2011, 83, 195206.
- (12) Olovsson, W.; Weinhardt, L.; Fuchs, O.; Tanaka, I.; Puschnig, P.; Umbach, E.; Heske, C.; Draxl, C. The Be K-Edge in Beryllium Oxide and Chalcogenides: Soft X-Ray Absorption Spectra From First-Principles Theory and Experiment. J. Phys.: Condens. Matt. 2013, 25, 315501.
- (13) Bauer-Grosse, E. Thermal Stability and Crystallization Studies of Amorphous TM?C Films. Thin Solid Films 2004, 447-8, 311-315.
- (14) Gaskell, P. H. A New Structural Model for Amorphous Transition Metal Silicides, Borides, Phosphides and Carbides. J. Non-Crystalline Solids 1979, 32, 207-224.
- (15) Bauer-Grosse, E.; Aouni, A. Glass-Forming Range and Glass Thermal Stability in Binary 3d TM?C Systems. J. Non-Crystalline Solids 2007, 353, 3644-3649.
- (16) Music, D.; Kreissig, U.; Mertens, R.; Schneider, J. M. Electronic Structure and Mechanical Properties of Cr7C3. Phys. Lett. A 2004, 326, 473-476.
- (17) Jiang, C. First-Principles Study of Structural, Elastic, and Electronic Properties of Chromium Carbides. Appl. Phys. Lett. 2008, 92, 041909.
- (18) Andersson, M.; Högström, J.; Urbonaite, S.; Furlan, A.; Nyholm, L.; Jansson, U. Deposition and Characterization of Magnetron Sputtered Amorphous Cr-C Films. Vacuum 2012, 86, 1408 - 1416.
- (19) Magnuson, M.; Lewin, E.; Hultman, L.; Jansson, U. Electronic Structure and Chemical Bonding of Nanocrystalline-TiC/Amorphous-C Nanocomposites. Phys. Rev. B 2009, 80, 235108.
- (20) Magnuson, M.; Andersson, M.; Lu, J.; Hultman, L.; Jansson, U. Electronic Structure and Chemical Bonding of Amorphous Chromium Carbide Thin Films. J. Phys.: Condens. Matt. 2012, 24, 225004.
- (21) Cockayne, D. J. H. The Study of Nanovolumes of Amorphous Materials Using Electron Scattering, Annu. Rev. Mater. Res. 2007, 37, 159-187.
- (22) Jansson U.; Lewin, E. Sputter Deposition of Transition-Metal Carbide Films ? A Critical Review From a Chemical Perspective. Thin Solid Films 2013, 536, 1-24.
- (23) Kádas, K.; Andersson, M.; Holmström, E.; Wende, H.; Karis, O.; Urbonaite, S.; Butorin, S. M.; Nikitenko, S.; Kvashnina, K. O.; Jansson, U.; Eriksson, O. Structural Properties of Amorphous Metal Carbides: Theory and Experiment. Acta Materialia, 2012, 2012, 60, 4720-4728.
- (24) Holmström, E.; Bock, N.; Peery, T. B.; Lizárraga, R.; DeLorenzi-Venneri, G.; Chisolm, E. D.; Wallace, D. C. Ab Initio Method for Locating Characteristic Potential-Energy Minima of Liquids. Phys. Rev. E, 2009, 2009, 80, 051111.
- (25) Holmström, E.; Bock, N.; Peery, T.; Chisolm, E.; Lizárraga, R.; DeLorenzi-Venneri, G.; Wallace, D. Structure Discovery for Metallic Glasses Using Stochastic Quenching. Phys. Rev. B 2010, 82, 024203.
- (26) Hohenberg, P.; Kohn, W. Inhomogeneous Electron Gas. Phys. Rev. 1964, 136, B864-B871.
- (27) Kohn, W.; Sham, L. Self-Consistent Equations Including Exchange and Correlation Effects. Phys. Rev. 1965, 140, A1133-A1138.
- (28) Blöchl, P. E. Projector Augmented-Wave Method. Phys. Rev. B 1994, 50, 17953-17979.
- (29) Kresse, G.; Hafner, J. Ab Initio Molecular Dynamics for Open-Shell Transition Metals. Phys. Rev. B 1993, 48, 13115-13118.
- (30) Kresse, G.; Joubert, D. From Ultrasoft Pseudopotentials to the Projector Augmented-Wave Method. Phys. Rev. B 1999, 59, 1758-1775.
- (31) Perdew, J. P.; Burke, K.; Ernzerhof, M. Generalized Gradient Approximation Made Simple. Phys. Rev. Lett. 1996, 77, 3865-3868.
- (32) Rehr, J. J.; Albers, R. C. Theoretical Approaches to X-Ray Absorption Fine Structure. Rev. Mod. Phys. 2000, 72, 621-654.
- (33) Rehr, J. J.; Kas, J. J.; Prange, M. P.; Sorini, A. P.; Takimoto, Y.; Vila, F. D. Ab Initio Theory and Calculations of X-Ray Spectra. Comptes Rendus Physique. 2009, 10, 548-559.
- (34) Rehr, J. J.; Kas, K. J.; Vila, F. D.; Prange, M. P.; Jorissen, K. Parameter-Free Calculations of X-Ray Spectra with FEFF9. Phys. Chem. Chem. Phys. 2010, 12, 5503-5513.
- (35) Lindmaa, A.; Lizárraga, R.; Holmström, E.; Abrikosov, I. A.; Alling, B. Exchange Interactions in Paramagnetic Amorphous and Disordered Crystalline CrN-Based Systems. Phys. Rev. B 2013, 88, 054414.
- (36) Momma, K.; Izumi, F. VESTA 3 For Three-Dimensional Visualization of Crystal, Volumetric and Morphology Data. J. Appl. Crystallogr. 2011, 44, 1272-1276.
- (37) Carlson, S.; Clausén, M.; Gridneva, L.; Sommarin, B.; Svensson, C. XAFS Experiments at Beamline I811, MAX-Lab Synchrotron Source, Sweden. J. Synch. Rad. 2006, 13, 359-364.
- (38) Klementev, K. V. Extraction of the Fine Structure from X-Ray Absorption Spectra. J. Phys. D: Appl. Phys. 2001, 34, 209-217.
- (39) E. Kukk; Spectral Analysis by Curve Fitting Macro Package (SPANCF) 2011, http://www.physics.utu.fi/en/research/material-science/Fitting.html
- (40) Yamamoto, T. Assignment of Pre-Edge Peaks in K-Edge X-Ray Absorption Spectra of 3d Transition Metal Compounds: Electric Dipole or Quadrupole? X-Ray Spectrom. 2008, 37, 572-584.
- (41) Egami, T.; Billinge, S. J. L. Underneath the Bragg Peaks: Structural Analysis of Complex Materials; Pergamon (Elsevier): Oxford, UK, 2003.
- (42) Singh, V.; Palshin, V.; Tittsworth, R. C.; Meletis, E. I. Local Structure of Composite Cr-Containing Diamond-Like Carbon Thin Films. Carbon 2006, 44, 1280-1286.
- (43) Pantelouris, A.; Modrow, H.; Pantelouris, M.; Hormes, J.; Reinen, D. The Influence of Coordination Geometry and Valency on the K-Edge Absorption Near Edge Spectra of Selected Chromium Compounds. Chem. Phys. 2004, 300, 13-22.
- (44) Arc̆on, I.; Mirtic̆, B.; Kodre, A. Determination of Valence States of Chromium in Calcium Chromates by Using X-ray Absorption Near-Edge Structure (XANES) Spectroscopy. J. Am. Ceram. 1998, 81, 222-224.
- (45) Maury, F.; Oquab, D.; Manse, J. C.; Morancho, R. Structural Characterization of Chromium Carbide Coatings Deposited at Low Temperature by Low Pressure Chemical Vapour Decomposition Using Dicumene Chromium. Surf. Coat. Tech. 1990, 41, 51-61.
- (46) Nygren, K; Andersson, M.; Högström, J.; Fredriksson, W.; Edström, K.; Nyholm, L.; Jansson, U. Influence of Deposition Temperature and Amorphous Carbon on Microstructure and Oxidation Resistance of Magnetron Sputtered Nanocomposite Cr-C Films. Appl. Surf. Sci. 2014, 305, 143-153.
- (47) Singh, V.; Jiang, J. C.; Meletis, E. I. Cr-Diamondlike Carbon Nanocomposite Films: Synthesis, Characterization and Properties. Thin Solid Films 2005, 489, 150-158.
- (48) Singh, D. J.; Klein, B. M. Electronic Structure, Lattice Stability, and Superconductivity of CrC. Phys. Rev. B 1992, 46, 14969-14974.
- (49) Darmstadt, H.; Roy, C.; Kaliaguine, S.; Xu, G.; Auger, M.; Tuel, A.; Ramaswamy, V. Solid State 13C-NMR Spectroscopy and XRD Studies of Commercial and Pyrolytic Carbon Blacks. Carbon 2000, 38, 1279-1287.
- (50) Li, Y.; Gao, J.; Li, Q.L.; Peng, M. F.; Sun, X. H.; Li, Y. Y.; Yuan, G.; Wen, W. J. The Electronic, Mechanical Properties and Theoretical Hardness of Chromium Carbides by First-Principles Calculations. J. Alloys Comp. 2011, 509, 5242-5249.