The Betelgeuse Project: Constraints from Rotation
Abstract
In order to constrain the evolutionary state of the red supergiant Betelgeuse ( Orionis) we have produced a suite of models with ZAMS masses from 15 to 25 M⊙ in intervals of 1 M⊙ including the effects of rotation. The models were computed with the stellar evolutionary code MESA. For non–rotating models we find results that are similar to other work. It is somewhat difficult to find models that agree within 1 of the observed values of R, Teff and L, but modestly easy within 3 uncertainty. Incorporating the nominal observed rotational velocity, 15 km s-1, yields significantly different, and challenging, constraints. This velocity constraint is only matched when the models first approach the base of the red supergiant branch (RSB), having crossed the Hertzsprung gap, but not yet having ascended the RSB and most violate even generous error bars on R, Teff and L. Models at the tip of the RSB typically rotate at only 0.1 km s-1, independent of any reasonable choice of initial rotation. We discuss the possible uncertainties in our modeling and the observations, including the distance to Betelgeuse, the rotation velocity, and model parameters. We summarize various options to account for the rotational velocity and suggest that one possibility is that Betelgeuse merged with a companion star of about 1 M⊙ as it ascended the RSB, in the process producing the ring structure observed at about 7’ away. A past coalescence would complicate attempts to understand the evolutionary history and future of Betelgeuse.
keywords:
stars: individual (Betelgeuse) — stars: evolution — stars: AGB and post-AGB — supernovae: general1 Introduction
Betelguese ( Orionis) is a massive red supergiant that is destined to explode as a Type IIP supernova and leave behind a neutron star. One of us (JCW) has long been obsessed with the uncertainty in the evolutionary state of Betelgeuse and has sought means to reduce that uncertainty. This effort, in various guises, has been informally deemed The Betelgeuse Project. An evolving team of undergraduates has participated in this project. Here we report on results on Betelgeuse itself, especially the constraint of its rotational state. Non–rotating models aimed at reproducing the observed aspects of Betelgeuse are given by Meynet et al. (2013) and Dolan et al. (2016). Dolan et al. found the rather surprising result that the favored mass of Betelgeuse was M⊙, somewhat larger than popular estimates.
The ultimate question of determining when Betelgeuse will explode depends on knowing the current evolutionary state. A typical basic model of 20 M⊙ begins core helium burning as the model crosses the Hertzsprung gap. The model is still in core helium burning when it first hits the tip of the red supergiant branch (RSB) at a luminosity of L⊙. The model then forms a semi-convective hydrogen-burning shell and retreats down the RSB to L⊙, still substantially brighter than the minimum luminosity at the base of the RSB, L⊙. The model ends core helium burning with a luminosity of L⊙. Core carbon burning is initiated at L⊙, only about 2000 years before core collapse. Betelguese is most probably in some phase of core helium burning.
2 Computations
We evolved a grid of models from the Zero Age Main Sequence (ZAMS) to near the onset of core collapse using the stellar evolution code Modules for Experiments in Stellar Astrophysics (MESA; Paxton et al. 2011, 2013, 2015). We computed models of solar metallicity with ZAMS masses from 15 to 25 M⊙ at intervals of 1 M⊙ primarily using MESA versions 6208 and 7624.
For one suite, the models were non–rotating. For another suite with the same ZAMS masses we assumed an initial rotation of 200 km s-1, corresponding to about 25% of the Keplerian velocity on the ZAMS. As we will discuss below, our results do not depend sensitively on the particular choice of this initial rotational velocity; a lower value would give lower final velocities and a significantly larger initial velocity would be unphysical. Dolan et al. (2016) did a careful exploration of the sensitivity of the choice of convective and overshoot schemes. Because our principal goal was to explore the effect of rotation, we chose only the default prescriptions in MESA: Schwarzschild convection and an overshoot parameter of . For the rotating models, we again chose MESA default values of mechanisms of angular momentum transport and mixing. We did not include magnetic effects (Wheeler et al., 2015). We employed the “Dutch" mass–loss prescriptions with . We used nuclear reaction network approx21. The inlist we employed is available upon request from the authors. For each ZAMS mass, the models were computed to the onset of core collapse. In practice, we have presented data at the end of core carbon burning. At those stages, there is little change in the outer, observable, characteristics. In the following discussion we refer to specific models by their ZAMS mass.
3 Results
We compared the results of our models to the observational constraints on Betelgeuse as given by Dolan et al. (2016): log; ; K. Dolan et al. (2016) considered a range of possible uncertainties, including limb darkening and overshoot, but the uncertainties in and are dominated by the uncertainty in distance pc (Harper et al., 2008), with and . We recognize that the errors in the distance estimate are likely to be distributed asymmetrically and subject to the Lutz–Kelker–Hanson (LKH) bias that will tend to favor larger distances and hence larger radii and luminosities (Benedict et al., 2007), but for perspective we have also examined the constraints on models considering naive errors, simply three times the errors. For , the range is K and for , . For , we find and for the and ranges, respectively. In terms of logarithms, these values and ranges are log , log , and log , where the limits are given in parentheses. In addition, we have employed the constraint that the observed rotational velocity of Betelgeuse is km s-1 with an inclination of (Dupree et al., 1987; Gilliland & Dupree, 1996; Uitenbroek et al., 1998; Kervella et al., 2009). These data imply an equatorial rotational velocity of km s-1. The uncertainty in this quantity is itself uncertain.
In principle, the surface gravity of Betelgeuse provides another independent constraint on the ratio . Lambert et al. (1984) adopted log . Lobel & Dupree (2000) obtained log and Neilson et al. (2011) determined (R⊙/M⊙). From their best–fit models, Dolan et al. (2016) obtained (R⊙/M⊙) and log for their Eggleton–based code and log with MESA.
3.1 Non–rotating Models
![[Uncaptioned image]](/html/1611.08031/assets/x2.png)
|
![[Uncaptioned image]](/html/1611.08031/assets/x3.png)
|
| Figure 2 Structure of the non–rotating 20 M⊙ model in the temperature/density plane in core helium burning near the luminosity minimum (panel a) and near the end of carbon burning (panel b). The blue regions are convective, the green regions, radiative. The dashed line corresponding to represents the non-degenerate/degenerate boundary. |
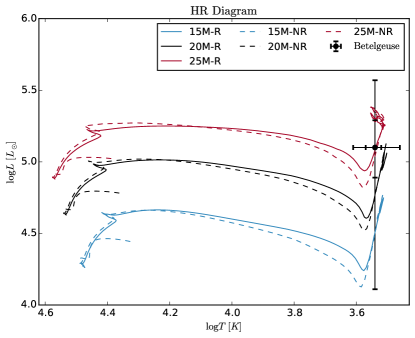
Figure 1 shows representative evolutionary tracks in the Hertszprung–Russell diagram for the 15, 20 and 25 M⊙ models, both rotating and non–rotating and the corresponding position of Betelgeuse. Figure LABEL:trho shows the interior structure of the non–rotating 20 M⊙ model at the point of minimum luminosity at the base of the RSB and at the end of core carbon burning, defined as the central mass fraction of 12C being less than . The structure of the models in both panels of Figure LABEL:trho is characteristic of all the models, roughly independent of mass. An exception is the right panel which does not show an inner region of convective carbon burning in this particular snapshot. This inner convective region is common in models and is shown in panel b of Figure LABEL:trhorot.
Betelgeuse can be brought into agreement with either the minimum luminosity point at the base of the RSB or at the tip of the RSB with a judicious choice of distance within the errors. We note that our models do not yield any blue loops, consistent with the results of Dolan et al. (2016), but that the minimum luminosity of our models is somewhat dimmer than those of Dolan et al.. We find that the rotating models give somewhat brighter luminosities at the luminosity minimum at the base of the RSB in a manner consistent with the results of Meynet et al. (2013). Convective overshoot has rather little effect on the evolutionary track but can also increase the luminosity at the minimum (Dolan et al., 2016). The surface abundances of Betelgeuse are enhanced in nitrogen, depleted in carbon and display a low ratio of , all signs that Betelgeuse has undergone the first dredge–up and hence that it must be on the ascending RSB (Dolan et al., 2016). As discussed in §3.2, this constraint is in conflict with the results of basic rotating models.
![[Uncaptioned image]](/html/1611.08031/assets/x4.png)
|
![[Uncaptioned image]](/html/1611.08031/assets/x5.png)
|
![[Uncaptioned image]](/html/1611.08031/assets/x6.png)
|
|
|
| Figure 3 The distribution of and is given at the base of the RSB where the luminosity is a local minimum for the non–rotating models (panel a) and at the end of carbon burning (panel b). The distribution of and is given at the base of the RSB (panel c) and at the end of carbon burning (panel d). The point of minimum luminosity is near where the rotating models reproduce the observed rotation rate (§3.2). The observed values for Betelgeuse are given with tic marks at the and limits. Note the different temperature scales in each panel. |
As we will show, the rotating models yield a velocity consistent with the observations near the luminosity minimum at the base of the RSB. While this constraint does not apply to the non–rotating models, we illustrate conditions near the luminosity minimum. Figure LABEL:RLTnonrot (panel a) gives the distribution of and at the point of minimum luminosity for the non–rotating models. All the models tend to be too small and hot to agree with the observations within , but they mostly agree within . A judicious adjustment of the uncertain distance might then bring general agreement for any of the individual models. Figure LABEL:RLTnonrot (panel b) gives the distribution of and at the end of core carbon burning for the non–rotating models. Models 15 to 19 match the radius to within ; all models agree within . The temperature basically matches well with models 16 to 23 being slightly too cool, and the radii of individual models would agree with an appropriate choice of distance.
Similar results pertain to the distribution of and at the luminosity minimum as shown in Figure LABEL:RLTnonrot (panel c). The models tend to be too dim to agree with the observations within . They all essentially agree within . A judicious adjustment of the distance to smaller values than we have assumed would again bring agreement for a given model with model 25 being the best fit to the luminosity. Figure LABEL:RLTnonrot (panel d) gives the distribution of and at the end of core carbon burning for the non–rotating models. Models 17 to 23 match the luminosity to within ; all models agree within . The luminosity of individual models would agree with an appropriate choice of distance.
The models that formally most closely match the observations of , , and in our suite of non–rotating models is model 24 at the minimum luminosity and models 17, 18, and 19 at the end of carbon burning.
For our 20 M⊙ model, the non–rotating models give log at the luminosity minimum and log during carbon burning. The former is nominally too large, and the latter in better agreement with the determination of Lobel & Dupree (2000), but it is difficult to rule the former out, given the level of uncertainty.
3.2 Rotating Models
Figure LABEL:trhorot gives the structure of the 20 M⊙ model when the equatorial velocity is near 15 km s-1 and the corresponding rotating model near the end of carbon burning. Note that the structure in core helium burning is very similar to that given in the non–rotating model at the base of the RSB in Figure LABEL:trho. The right hand panel shows the characteristic structure at that late phase, including the region of vigorous, off–center, carbon burning that occurs in many of the other models.
Figure LABEL:RLTrot gives the distribution of and when the surface velocity is km s-1 for the rotating models near the base of the RSB (panel a). Figure LABEL:RLTrot shows most of the models are too hot to agree even within the limit. All the models basically agree in radius within the 3 limit. The model of 21 M⊙ comes closest to agreeing with both and within 3. Figure LABEL:RLTrot also gives the distribution of and at the end of core carbon burning for the rotating models (panel b). Models 15 to 20 match the radius to within ; all models agree within . The temperature basically matches well, with the lower–mass models falling slightly low. The radius would agree for all models with a judicious choice of distance.
![[Uncaptioned image]](/html/1611.08031/assets/x8.png)
|
![[Uncaptioned image]](/html/1611.08031/assets/x9.png)
|
| Figure 4 Structure of the rotating 20 M⊙ model in the temperature/density plane in core helium burning when the equatorial velocity is 15 km s-1 (panel a) and near the end of carbon burning (panel b). The blue regions are convective, the green regions, radiative. The dashed line corresponding to represents the non-degenerate/degenerate boundary. |
![[Uncaptioned image]](/html/1611.08031/assets/figure5a_LogRvsLogT_v15.png)
|
![[Uncaptioned image]](/html/1611.08031/assets/figure5b_LogRvsLogT_endC_rot.jpg)
|
![[Uncaptioned image]](/html/1611.08031/assets/figure5c_LogLvsLogT_v15.png)
|
![[Uncaptioned image]](/html/1611.08031/assets/figure5d_LogLvsLogT_endC_rot.jpg)
|
| Figure 5 The distribution of and is given for our rotating models at the point at the base of the RSB when the surface velocity is km s-1 (panel a) and at the end of carbon burning (panel b). The distribution of and is given for our rotating models at the point when the surface velocity is km s-1 (panel c) and at the end of carbon burning (panel d) when the surface velocity is km s-1. The observed values for Betelgeuse are given with tic marks at the and limits. |
Similar results pertain to the distribution of and when the surface velocity is km s-1 for the rotating models near the base of the RSB as shown in Figure LABEL:RLTrot (panel c). The luminosity of Models 22 to 25 agree with within , the lower–mass models within . Model 21 agrees with the luminosity within , but again in temperature only at . An appropriate adjustment of the distance could bring general agreement in but not in . Figure LABEL:RLTrot also gives the distribution of and at the end of core carbon burning for the rotating models (panel d). Models 17 to 23 match the luminosity to within ; all models agree within . The temperature basically matches well, and the luminosity would agree with a judicious choice of distance.
The models that formally most closely match the observations of , , and in our suite of rotating models are model 21 at the point where km s-1 and models 16 to 20 at the end of carbon burning, ignoring the velocity constraint. While in some sense a special case, Model 21 with nominally the observed rotation of Betelgeuse cannot be formally ruled out by the data. This model could be accommodated if Betelgeuse were somewhat hotter than the nominal value of 3500 K and the distance were somewhat closer than the nominal 197 pc. More models could be accommodated if the rotational velocity were taken to be km s-1.
For our 20 M⊙ model, the rotating models give log at the luminosity minimum and log during carbon burning. The former is substantially too large and the latter in close agreement with the determination of Lobel & Dupree (2000).
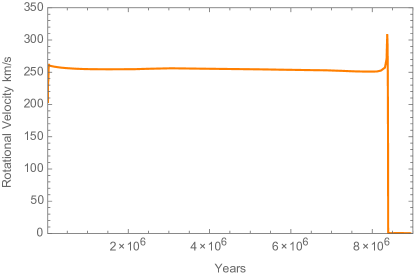
The rotating models yield the opportunity to examine the rotational state and compare to the observed value for Betelgeuse, km s-1. Figure 6 gives the evolution of the average surface velocity for the model with ZAMS mass of 20 M⊙. The models relax a little as they settle onto the ZAMS and typically begin there with a velocity somewhat greater than 200 km s-1. The velocity has a small spike, to km s-1, due to the contraction at the end of core hydrogen burning, then begins a rapid plummet as the models cross the Hertzsprung gap and proceed up the RSB. Models at the tip of the RSB that nominally reproduce the observations of , , and for Betelgeuse typically rotate at only 0.1 km s-1, independent of any reasonable choice of initial rotation. While the uncertainty in the observed velocity is difficult to assess, this value at the tip of the RSB is far below any credible value. The rotation of Betelgeuse represents a dilemma.
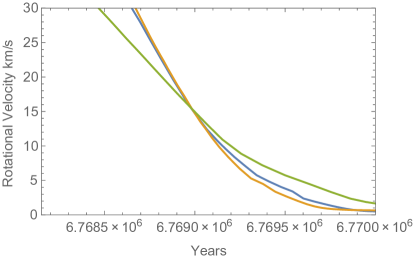
Figure LABEL:RLTrot gives the distribution of results of , and at the point where the models give a surface rotation velocity close to 15 km s-1. These models correspond to a very peculiar, special condition. They represent the evolutionary stage after the models have crossed the Hertzsprung gap and are at very nearly the point of minimum luminosity before the sharp rise up the RSB. Figure 7 gives a blow–up of the velocity evolution of model 20 from Figure 6 and also for models 15 and 25 during the brief epochs when the models gives km s-1. The velocity plunges through the observed range and on down to km s-1 as the model rises along the RSB. The 15 M⊙, 20 M⊙, and 25 M⊙ models pass through the interval 20 km s-1 to 10 km s-1 in about 400 y.
These results deepen the dilemma represented by the observed rotation of Betelgeuse. The only models that formally fit the observed data on , , and are required to sit at a very special, short–lived point in the evolution. At the end of the main sequence, these stars cross the Hertzsprung gap in the hydrogen shell–burning phase. The shell tends to sit at a node at fixed radius while the helium core contracts toward helium ignition and the envelope expands. Some of the internal energy is expended in inflating the envelope and the luminosity drops as the radius expands and the temperature declines. The minimum in luminosity occurs as the envelope makes the transition from being radiative to having a deep convective structure. From that point, the star nearly reprises its proto–star phase in reverse, climbing up the Hyashi track at nearly constant temperature. For a typical model, the time to cross the Hertzsprung gap is y. The time to evolve from the point of minimum luminosity and maximum post–ZAMS rotation to carbon burning is y. The interval in which the models are predicted to have conditions similar to Betelgeuse and between 1 and 50 km s-1 is 1000 years. The probability that Betelgeuse happens to be in this special state of transition is low. In addition, these models give an excessively large gravity.
We also note that the hypothesis that Betelgeuse is near the point of minimum luminosity would require it to be in a stage of expanding radius. This could be inconsistent with the observation by Townes et al. (2009) that the radius of Betelgeuse systematically decreased by 15% from 1993 to 2009, about 1% per year (but see Ohnaka 2013). In the vicinity of the luminosity minimum at the base of the giant branch, our 20 M⊙ model increased in radius by about 0.07% per year and our 25 M⊙ model increased in radius by about 0.3% per year.
3.3 Accounting for the Rotation
There are several possible explanations for these results. One is that we have not treated the physics of the stellar evolution properly. For instance, there may be more viscosity than computed in the default prescriptions in that would allow a greater transport of angular momentum from the rotating core to the envelope. We have checked this aspect by computing the angular momentum in the cores of the models at the stage of carbon burning. For a typical model, 20 M⊙, the angular momentum of the helium core of mass 6.2 M⊙ with a surface velocity of 4.0 km s-1 is g cm-2 s-1 and that of the carbon core of mass 2.3 M⊙ and surface velocity of 7.0 km s-1 is g cm-2 s-1. In carbon burning, the 20 M⊙ model has a total mass of 16.6 M⊙ and a hydrogen envelope of 10.4 M⊙ with an outer radius of cm. If the envelope had the same total angular momentum as the core, it would rotate at only the speed, or about 0.003 km s-1, even smaller than predicted by the models. Even if all the angular momentum of the helium core core were transferred to the extended envelope, the moment of inertia of the former is too small and of the latter is too large. The envelope would still not rotate substantially faster than km s-1. Massive stars are observed to rotate as rapidly as 500 km s-1 near the ZAMS (Dufton et al., 2013), but while we have not explored these extreme initial values, it is unlikely that an increase of the initial rotation velocity by a factor of a few will lead to changes in the final envelope rotation velocity by the required factor of .
Another possibility is that the observed velocity is incorrect. The velocity was determined by Gilliland & Dupree (1996) and Uitenbroek et al. (1998) by the use of HST long–slit spectroscopy to map across the (minimally) resolved surface of Betelgeuse. The result was a systematic blueshift on one limb and a redshift on the opposite of the quoted magnitude. It is at least within the bounds of credibility that the measurements were affected, perhaps even dominated, by the large–scale convective motions of the envelope for which Betelgeuse is famous.
A particularly interesting prospect is to invoke the possibility of duplicity. It is now known that a majority of O and B stars are born in binary systems (Sana et al., 2012; Dunstall et al., 2015). de Mink et al. (2014) estimate that 19% of massive, apparently single stars (those with radial velocity less than 10 km s-1) are merged stars. Costa et al. (2015) report 17 giant stars observed with Kepler that show rapid rotation that might signal coalescence in a binary system.
We checked this possibility for Betelgeuse by estimating the mass of a putative companion star that, having coalesced with Betelgeuse from an orbit close to the current radius, would have provided the requisite angular momentum to spin the envelope up to km s-1. If we assume the companion of mass is a point mass and thus neglect any internal angular momentum, that the envelope of Betelgeuse was originally non–rotating, and that all the orbital angular momentum of the companion is deposited in the envelope, we can write
| (1) |
or, with , and ,
| (2) |
where is the envelope mass in units of 10 M⊙, is the total mass of the system in units of 20 M⊙, is the final rotational velocity of the envelope in units of 15 km s-1, and is the radius of the primary and of the orbit of the secondary at the epoch of coalescence. This simple model suggests that the current rotation of Betelgeuse could be explained if Betelgeuse were born with a companion of mass M⊙ with which it merged as it evolved up the RSB to its current position of glory.
While this hypothesis is credible and consistent with the a priori estimate that Betelgeuse has a probability of % of being born in a binary system, it raises a number of interesting issues. It is not clear that that mass and angular momentum of a companion would remain in the envelope. A companion of about a solar mass would have a mean density of about 1 g cm-3. That density is characteristic of the base of the hydrogen envelope in the models we consider here, implying that a swallowed companion might not be dissolved until it reached the edge of the helium core. If the companion plunged down to the core, the evolution might be severely altered by anomalous burning and mixing effects. The luminosity of an evolved massive star is typically a strong function of the mass of the helium core and not the mass of the envelope. If a companion partially or totally merged with the core of Betelgeuse, then the current luminosity may be a measure of the core mass ( 5 to 6 M⊙), but the mass of the envelope would be rather unconstrained and probably smaller than the estimates given here based on basic, single–star models that attempt to reproduce the luminosity, radius and effective temperature. Guessing the prior and future evolution of Betelgeuse becomes more problematic. We also note that a coalescence might have affected surface abundances, complicating their interpretation.
If there were a coalescence, there might well be some mass ejected. If a shell were ejected with a velocity near the escape velocity, km s-1 about years ago, then if that shell expanded unimpeded it would now be at a radius, cm. At a distance of 197 pc, the shell would have an angular radius of about 17 arc minutes. If the shell swept up matter, then this would be a rough upper limit to its location.
There is a well–observed “bow shock" about 7 arc minutes away from Betelgeuse (Noriega-Crespo et al., 1997; Decin et al., 2012). This bow shock is attributed to the wind from Betelgeuse sweeping up matter from the ISM in the direction of motion (Mohamed et al., 2012; Decin et al., 2012; Mackey et al., 2014), but it is possible that the flow of mass was impulsive rather than steady. The bow shock is rather smooth compared to numerical predictions of dynamic instabilities and is rather close to being circular (Ueta et al., 2008), again in contrast to wind simulations. It is not clear that an impulsive mass ejection at the time of companion merging would solve these issues, but this possibility (that is beyond the scope of the current paper) is worth exploring. There is also an odd, very linear feature beyond the bow shock that remains unexplained (Noriega-Crespo et al., 1997; Decin et al., 2012). The observations also show a smaller ring of material at a radius of about 4 arc minutes (Le Bertre et al., 2012). One explanation is that this is wind mass that is radiation–impeded by external radiation (Mackey et al., 2014). Such a structure could also form in the wind that was blown subsequent to the impulsive ejection we contemplate. Yet another possibility is that this inner ring is associated with the mass loss at the epoch of coalescence. This would require that the mass was ejected only about years ago, or that there was considerable deceleration of the ejected shell.
4 Discussion
We have used evolutionary models to explore the mass and evolutionary state of Betelgeuse. While , , and are reasonably easy to reproduce for a range of masses for judicious choices of the still rather uncertain distance, we found the observed rotational velocity difficult to reproduce. Basic rotating models yielded the observed value, km s-1 only near the base of the giant branch. This position in the Hertzsprung–Russell diagram, while unexpected, could not be completely ruled out given generous estimates of the uncertainty in distance. The principal objection to this result is that the models are only in the range of the observed value of the rotation velocity for a very brief time, a few hundred years. This is as improbable as the likelihood that Betelgeuse is within a few hundred years of explosion.
A major uncertainty in this analysis is the distance to Betelgeuse. The estimate and associated uncertainties employed here were based on the results of observations with the VLA and Hipparchos. Unfortunately, Betelgeuse is brighter than the saturation limit of Gaia so that mission may not bring any improvement. Other more indirect methods to improve distance estimates would be most welcome.
We considered various factors that might mitigate our conclusion, including uncertainties in the evolutionary models and in the observations that determine the rotational velocity. The attempt to measure the observed rotation velocity may have been affected, or even dominated, by the convective motions of the envelope. Examination of unpublished STIS data tends to confirm the original interpretation of rotation (A. Dupree, private communication, 2016). This issue would be clarified by repeated observations to determine if the derived velocity is stable in time. The apparent rapid rotation velocity might also be affected by the presence of a dusty disk around the star.
We explore a solution based on the hypothesis that Betelgeuse was once a component of a binary star system and show that if it merged with a companion of about 1 M⊙ when it became a red supergiant that the requisite angular momentum of the envelope might be attained. We discuss the possibility that the various shells surrounding Betelgeuse might have been associated with this merging process. Betelgeuse might have been born in a dense cluster, an environment that could enhance the formation of multiples (Harper et al., 2008).
If Betelgeuse has coalesced with a former binary companion, the task, while perhaps even more important, becomes yet more complicated. An appropriate quantitative analysis might enable the determination of the current state of evolution and hence the time to explosion, the original goal. In a future paper, we will explore the promise of asteroseismology to illuminate this issue.
Acknowledgments
We are grateful to E. L. (Rob) Robinson for insights, to Pawan Kumar for discussions of stellar oscillations, to Fritz Benedict for a discussion of errors in distance measurements, and to Brian Mulligan for help with Bibtex. We are especially thankful for the ample support of Bill Paxton and the MESA team. This research was supported in part by NSF Grant AST-11-9801.
References
- Benedict et al. (2007) Benedict, G. F., McArthur, B. E., Feast, M. W., et al. 2007, AJ, 133, 1810
- Costa et al. (2015) Costa, A. D., Canto Martins, B. L., Bravo, J. P., et al. 2015, ApJL, 807, L21
- Decin et al. (2012) Decin, L., Cox, N. L. J., Royer, P., et al. 2012, A&A, 548, A113
- de Mink et al. (2014) de Mink, S. E., Sana, H., Langer, N., Izzard, R. G., & Schneider, F. R. N. 2014, ApJ, 782, 7
- Dolan et al. (2016) Dolan, M. M., Mathews, G. J., Lam, D. D., et al. 2016, ApJ, 819, 7
- Dufton et al. (2013) Dufton, P. L., Langer, N., Dunstall, P. R., et al. 2013, A&A, 550, A109
- Dunstall et al. (2015) Dunstall, P. R., Dufton, P. L., Sana, H., et al. 2015, A&A, 580, A93
- Dupree et al. (1987) Dupree, A. K., Baliunas, S. L., Hartmann, L., et al. 1987, ApJL, 317, L85
- Gilliland & Dupree (1996) Gilliland, R. L., & Dupree, A. K. 1996, ApJL, 463, L29
- Harper et al. (2008) Harper, G. M., Brown, A., & Guinan, E. F. 2008, AJ, 135, 1430
- Kervella et al. (2009) Kervella, P., Verhoelst, T., Ridgway, S. T., et al. 2009, A&A, 504, 115
- Lambert et al. (1984) Lambert, D. L., Brown, J. A., Hinkle, K. H., & Johnson, H. R. 1984, ApJ, 284, 223
- Le Bertre et al. (2012) Le Bertre, T., Matthews, L. D., Gérard, E., & Libert, Y. 2012, MNRAS, 422, 3433
- Lobel & Dupree (2000) Lobel, A., & Dupree, A. K. 2000, ApJ, 545, 454
- Mackey et al. (2014) Mackey, J., Mohamed, S., Gvaramadze, V. V., et al. 2014, Nature, 512, 282
- Meynet et al. (2013) Meynet, G., Haemmerlé, L., Ekström, S., et al. 2013, EAS Publications Series, 60, 17
- Mohamed et al. (2012) Mohamed, S., Mackey, J., & Langer, N. 2012, A&A, 541, A1
- Neilson et al. (2011) Neilson, H. R., Lester, J. B., & Haubois, X. 2011, 9th Pacific Rim Conference on Stellar Astrophysics, 451, 117
- Noriega-Crespo et al. (1997) Noriega-Crespo, A., van Buren, D., Cao, Y., & Dgani, R. 1997, AJ, 114, 837
- Ohnaka (2013) Ohnaka, K. 2013, EAS Publications Series, 60, 121
- Paxton et al. (2011) Paxton, B., Bildsten, L., Dotter, A., et al. 2011, ApJS, 192, 3
- Paxton et al. (2013) Paxton, B., Cantiello, M., Arras, P., et al. 2013, ApJS, 208, 4
- Paxton et al. (2015) Paxton, B., Marchant, P., Schwab, J., et al. 2015, ApJS, 220, 15
- Sana et al. (2012) Sana, H., de Mink, S. E., de Koter, A., et al. 2012, Science, 337, 444
- Townes et al. (2009) Townes, C. H., Wishnow, E. H., Hale, D. D. S., & Walp, B. 2009, ApJL, 697, L127
- Ueta et al. (2008) Ueta, T., Izumiura, H., Yamamura, I., et al. 2008, PASJ, 60, S407
- Uitenbroek et al. (1998) Uitenbroek, H., Dupree, A. K., & Gilliland, R. L. 1998, AJ, 116, 2501
- Wheeler et al. (2015) Wheeler, J. C., Kagan, D., & Chatzopoulos, E. 2015, ApJ, 799, 85