Hiding in Plain Sight - Recovering Clusters of Galaxies with the Strongest AGN in Their Cores
Abstract
A key challenge in understanding the feedback mechanism of AGN in Brightest Cluster Galaxies (BCGs) is the inherent rarity of catching an AGN during its strong outburst phase. This is exacerbated by the ambiguity of differentiating between AGN and clusters in X-ray observations. If there is evidence for an AGN then the X-ray emission is commonly assumed to be dominated by the AGN emission, introducing a selection effect against the detection of AGN in BCGs. In order to recover these ‘missing’ clusters, we systematically investigate the colour–magnitude relation around some ROSAT All Sky Survey selected AGN, looking for signs of a cluster red sequence. Amongst our 22 candidate systems, we independently rediscover several confirmed systems, where a strong AGN resides in a central galaxy. We compare the X-ray luminosity to red sequence richness distribution of our AGN candidate systems with that of a similarly selected comparison sample of confirmed clusters and identify seven ‘best’ candidates (all of which are BL Lac objects), where the X-ray flux is likely to be a comparable mix between cluster and AGN emission. We confirm that the colours of the red sequence are consistent with the redshift of the AGN, that the colours of the AGN host galaxy are consistent with AGN, and, by comparing their luminosities with those from our comparison clusters, confirm that the AGN hosts are consistent with BCGs.
keywords:
galaxies: clusters: general - galaxies: active - (galaxies:) BL Lacertae objects: general - galaxies: elliptical and lenticular, cD - X-rays: galaxies: clusters1 Introduction
Feedback from Active Galactic Nuclei (AGN) activity in galaxies plays a crucial role in galaxy evolution, truncating star formation in massive galaxies (Bower et al., 2006). In the case of Brightest Cluster Galaxies (BCGs) their unique environment, at the centre of clusters of galaxies, leads to an interplay between AGN activity and the wider external environment of the galaxy, affecting the evolution of both the host galaxy and the surrounding intracluster medium (ICM).
The baryonic content of massive galaxy clusters is dominated by the ICM (Lin et al., 2003), a hot gas () which radiates in the X-rays, with typical luminosities of the order . As energy is radiated away, a process of cooling occurs. So in cool core clusters – that is, clusters with high central gas densities, hence highly peaked X-ray surface brightness profiles, and hence cooling timescales Gyr – we naively expect to find large reserves of cool gas in their cores. In order to support the weight of the overlying gas, cooling flows of the order of were predicted (Fabian, 1994), resulting in substantial rates of star formation in the BCG as the cool gas accumulates. However, high resolution X-ray observations have revealed a deficit in cool gas, with evidence for only of the predicted mass of gas cooling and going on to form stars (O’Dea et al. 2008).
A heating mechanism therefore must exist to offset the radiative cooling, now widely accepted to be AGN feedback. The evidence points toward a self-regulated cycle, where gas cools, condenses into filaments (Tremblay et al. 2012; McDonald et al. 2014), leading to star formation (Cavagnolo et al. 2008; Donahue et al. 2010; Rawle et al. 2012; Hoffer et al. 2012; Fogarty et al. 2015; Green et al. 2016) and accretion onto the supermassive blackhole of the BCG. As the central black hole accretes matter, energy gets ejected back out into the system, heating the gas and halting the supply of gas for subsequent accretion and star formation. As the AGN ‘switches off’, the process of radiative cooling takes over again.
This picture of a feedback cycle is primarily supported by observations of clear X-ray cavities surrounding BCGs with active nuclei (Boehringer et al. 1993; McNamara et al. 2000; Hlavacek-Larrondo et al. 2015), with cavities observed in of cool core clusters (Dunn & Fabian 2006; Hlavacek-Larrondo et al. 2012). Cavities are spatially coincident with positions of radio lobes created by the AGN (with the majority of cool core clusters observed to have a central radio galaxy; Burns 1990; Hogan et al. 2015a) and are believed to be driven by the outflowing plasma. The AGN power, estimated by measuring the mechanical power necessary to create the cavities, is found to be generally sufficient to offset the rate of radiative cooling in most cool core clusters (Bîrzan et al. 2004; Rafferty et al. 2006). Although it should be noted that the high variability of AGN power (Hogan et al. 2015b) introduces a further challenge when comparing AGN power with cooling rates. However, the precise nature of how the energy gets transferred is still a topic of uncertainty and debate (see reviews McNamara & Nulsen 2007, 2012; Fabian 2012).
A key difficulty in understanding this feedback cycle is the extreme rarity of catching BCGs during their active outburst stage. Due to the short duty cycle of AGN, such systems are inherently rare, but this is further exacerbated by observational selection effects. The principle challenge is the ambiguity that exists between AGN and cluster emission in X-ray observations, i.e. whether X-rays are associated with extended cluster emission or point-like emission from AGN. For example, cool core clusters, the most likely systems to host a BCG with an active nuclei, can appear as point sources in shallow X-ray data, due to their centrally peaked profile, and as a result be ignored (Pesce et al., 1990). The effect particularly applies for cool core clusters at high redshift and may have a contribution towards the apparent decrease in the cool cores fraction with redshift (Vikhlinin et al. 2007; Santos et al. 2008). This is important to bear in mind in future X-ray surveys, such as eROSITA, as the extent of a cool core X-ray peak profile can be as little as 10 arcsec at high redshift (), and hence would be unresolvable with the effective PSF of 28 arcsec in eROSITA’s scanning mode. Additionally, moderately X-ray luminous AGN in clusters are difficult to detect above the cluster X-ray emission of the cluster core and AGN in clusters often lack optical spectral tracers of AGN activity (Martini et al., 2006). Conversely, strong AGN can have all the X-ray flux attributed to them, whilst the cluster they may reside in goes uncatalogued. In this paper we attempt to address the latter issue.
When compiling an X-ray catalogue of clusters, it is common practice to classify an X-ray source as an AGN whenever evidence, such as strong high-ionisation emission, suggests the presence of nuclear activity. This classification would remain unchanged even in the obvious presence of a galaxy overdensity in the direction of the source, since probabilistic arguments strongly favour QSO dominance of the X-ray emission in the case of a cluster / QSO chance alignment (Zenn & Ebeling, 2010). However, if the AGN host galaxy is a member of a massive galaxy cluster the X-ray emission from the AGN may be a minority contributor to the total combined AGN and cluster emission. As a result, there is an observational selection effect against detection of rich clusters with an AGN in the BCG - the very sources we need in order to better understand the feedback cycle in these systems.
A case in point is the Phoenix cluster, SPT-J2344-42 (McDonald et al., 2012). Despite being one of the most X-ray luminous clusters known and one of the brightest ROSAT All Sky Survey sources (RBS2043, Schwope et al. 2000), this cluster went undetected for a long time. The X-rays were attributed to AGN emission due to the strong, broad Mg II line in the spectrum of the BCG. Only when it was later detected through the S-Z effect, via the SPT, was it realised to be a massive cluster. A follow-up Chandra observation revealed the cluster emission () to be 3 times that of the AGN (; McDonald et al. 2012), and a subsequent HST observation revealed blue filaments in the BCG and a star formation rate of (McDonald et al., 2013).
One additional source of confusion in the literature is that some cluster-dominated X-ray sources are identified as candidate BL Lac objects. BL Lac objects (reviews: Stein et al. 1976; Falomo et al. 2014) are a class of AGN blazars, with emission over the entire electromagnetic spectra, due to non-thermal processes in a relativistic jet, orientated to be near the line of sight (Urry & Padovani 1995). They are characterised by featureless optical spectra, so detection is usually made via X-ray, radio and -ray detections. As a result some BCGs which exhibit a relatively bright, flat-spectrum radio source are identified as BL Lacs when the cluster is in fact the dominate source of X-rays. For example, at least 40 systems are included in the Roma BZCAT sample (the largest sample of BL Lac objects compiled to date, containing over 3500 blazar objects; Massaro et al. 2009), where the X-ray emission is likely to be dominated by the host cluster (see Section 4.6.1 for details). Similarly, seven of the targets chosen for OVRO 40m monitoring as potential Fermi sources are in fact BCGs (Hogan et al. 2015b). While this has a relatively minor effect on these large samples, it is important to ensure that the correct associations are made in order to avoid the clusters with a BCG, in a rare episode of AGN activity, being lost from an X-ray flux-limited sample. We will return to this issue in the discussion.
The reverse is also possible however, in which low luminosity BL Lacs can be misidentified as clusters of galaxies (Rector et al., 1999). While relatively few clusters have been identified in subsequent X-ray pointed observations to be AGN-dominated, there are several notable cases of systems where the cluster is a minority contributor to the total X-ray emission, for example: A1366 and A2627 in Russell et al. (2013), A1774 and A2055 (Ebeling et al. 1996) and the well studied samples of 1H1821+64 and 3C186 (Hall et al. 1997; Siemiginowska et al. 2010). In these cases, it is very important to pay attention to the emission of both the cluster and the AGN, in order to understand the total mass of the cluster and hence the parent sample of possible clusters that could have hosted a particular AGN.
The primary goal of this paper is to perform a systematic search for signs of a rich cluster around ROSAT X-ray sources identified as AGN, with the aim of recovering these ‘missing’ clusters with strong AGN in their cores, i.e. Phoenix cluster analogues. In order to do this we investigate the colour-magnitude relationship around the AGN and attempt to look for signs of a overdensity in red sequence galaxies. Specifically, we look for cluster red sequences with a richness comparable to those of confirmed clusters of similar X-ray luminosity to our “AGN” X-ray sources.
The organisation of this paper is as follows: we introduce the AGN sample and the cluster comparison sample in Section 2. We describe our photometry and red sequence selection methodology in in Section 3. We present the results and discuss these in Section 4 and conclude with a summary in Section 5. Throughout this paper optical photometry is given in AB magnitudes, and WISE photometry in Vega. A standard cosmology of , and is assumed.
2 The Data
2.1 AGN Sample
Our parent AGN sample consists of all X-ray sources from the ROSAT All-Sky Survey (RASS) Bright Source Catalogue (Voges et al., 1999), which were attributed to AGN emission through the combined follow-up over the past 20 years - including large spectroscopic surveys such as SDSS (Anderson et al. 2003, 2007), and 6dFGS (Mahony et al. 2010), plus targeted projects (Bauer et al. 2000; Kollatschny et al. 2008). This provides a comprehensive catalogue of AGN to a soft X-ray flux limit of 3–5 erg s-1 cm-2 at 0.1–2.4 keV. Within the PS1 3 footprint, and below a redshift of 0.4, this gives a sample of 3058 broad-line AGN and 412 BL Lacs. The X-ray luminosities are all drawn from the RASS, are quoted in the 0.1–2.4 keV band and corrected for Galactic absorption.
There are a further 1020 RASS BSC sources, likely to be AGN, within the PS1 3 footprint, which have not been spectroscopically confirmed. However, we restrict our analysis to spectroscopically confirmed AGN only, as without the redshift – red sequence colour relationship (see Section 4.1) we would not be able to verify redshift concordance between the AGN and any apparent over-density. As our working AGN sample consists of a total of 3470 spectroscopically confirmed BL Lac and broad-line AGN, our spectroscopic completeness is at least 77%. In all likelihood however the completeness is higher than this for the brighter optical counterparts, as the fainter AGN without spectroscopy are more likely to be at a redshift above our cut-off.
2.2 Comparison Cluster Sample
In order to check for consistency between candidate systems and clusters we compare our observations with an X-ray selected sample of 981 confirmed clusters. The cluster sample, which covers , was drawn from a systematic investigation into the RASS Bright Source Catalogue (Voges et al., 1999), so has a similar selection criteria to our AGN. This is inclusive of all published samples within the PS1 footprint, such as the Brightest Cluster Sample, BCS (Ebeling et al., 1998), the extended Brightest Cluster Sample, eBCS (Ebeling et al., 2000), the ROSAT ESO Flux Limited X-ray survey, REFLEX (Böhringer et al., 2004), the Northern ROSAT All-Sky Galaxy Cluster Survey, NORAS, (Böhringer et al., 2000) and the Massive Cluster Survey, MACS, (Ebeling et al. 2001; Ebeling et al. 2007, 2010). In addition to these, the sample also includes all cluster identifications of RASS Bright Source Catalogue sources below the flux limits of these published surveys. The X-ray luminosities are all drawn from the RASS and are quoted in the 0.1–2.4 keV band and corrected for Galactic absorption. In Green et al. (2016) this cluster sample was used to investigate activity in BCGs through multi-wavelength photometry; we refer the reader to this paper for details regarding the computation and distribution of X-ray luminosities for these clusters. .
3 Methods
3.1 Optical Photometry
For the optical analysis we utilised the Pan-STARRS, PS1 survey (Tonry et al., 2012), which is an optical wide-field photometric survey covering the entire sky north of a declination of . The survey covers the and bands at an imaging spatial resolution of 0.25 arcsec per pixel. For each ROSAT AGN we extracted the PS1 3 PV3 postage stamp and performed aperture photometry in the griz bands using SExtractor (Bertin & Arnouts, 1996). The exact same procedure for the PS1 3 photometry, and settings in SExtractor, were used for the AGN sample as for the cluster comparison sample, (as outlined in more detail in Green et al. 2016). Specifically, we determine magnitudes using the MAG_AUTO parameter, which measures the flux within a flexible elliptical aperture with a Kron radius (Kron, 1980), and colours are derived from the MAG_APER parameter, with a fixed circular aperture of 4 arcsec. The inbuilt CLASS_STAR function was used for star-galaxy separation. All PS1 photometry throughout this paper is corrected for Galactic reddening using the Galactic Extinction calculator available through the NED, based on the Schlafly & Finkbeiner (2011) extinction maps. A K-correction is applied, when determining optical luminosities, assuming a simple stellar population model, (Bruzual & Charlot, 2003), with solar metallicity, a Chabrier Initial Mass Function, formation at and subsequent passive evolution.
3.2 Mid-IR Photometry
For the Mid-IR analysis we utilised the Wide-field Infrared Survey Explorer (WISE) (Wright et al., 2010), which is a survey covering the whole sky at –. From the AllWISE Source Catalogue we extract photometry for our AGN/BCG sample in the W1, W2 and W3 bands at , and respectively. We do not perform any Galactic extinction corrections as this is negligible for Mid-IR observations (Cardelli et al., 1989).
3.3 Red Sequence Selection
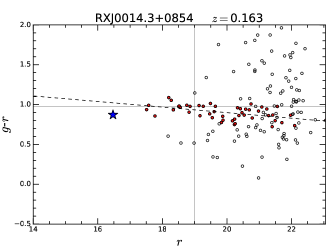
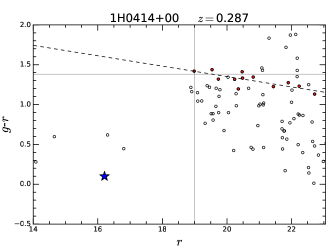
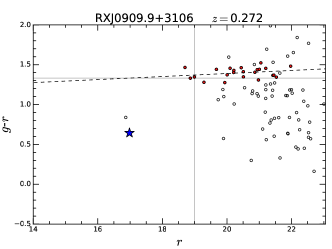
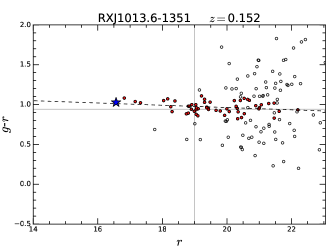
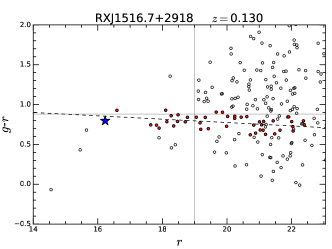
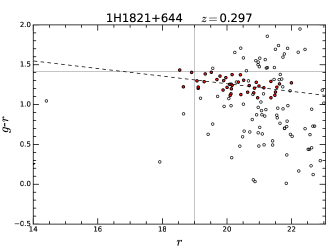
We extract the photometry of sources within a radius about the X-ray position, and create g–r, r–i and i–z colour-magnitude diagrams for each AGN position. The colour-magnitude diagrams were then visually inspected for signs of a colour–magnitude relation consistent with the red sequence seen in all rich clusters of galaxies. A red sequence selection algorithm was applied to any X-ray sources with a visually apparent red sequence. The algorithm is described in more detail in Green et al. (2016), but briefly it applies an initial best fitting line to an apparent red sequence. Then, in decreasing intervals of colour around the line, a new best fitting line is made until finally sources within mag around the line are selected. All the while, the fitting is only made to sources which lie on the red sequence in two separate colour indices, where the most blue-ward index spans the Å break (e.g. g–r and r–i at , and r–i and i–z at ).
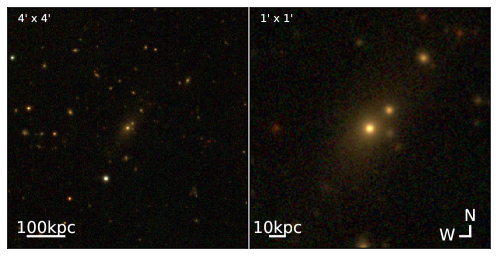
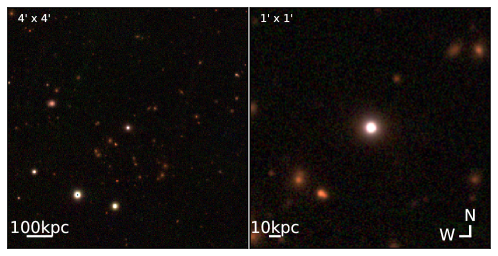
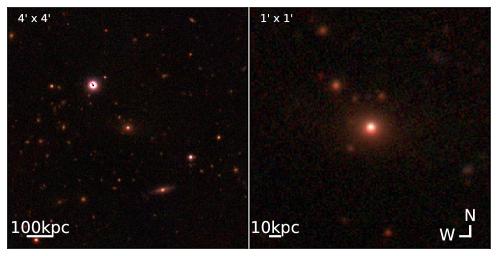
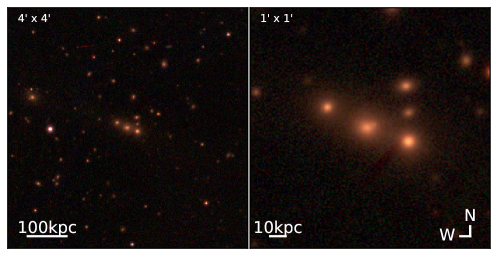
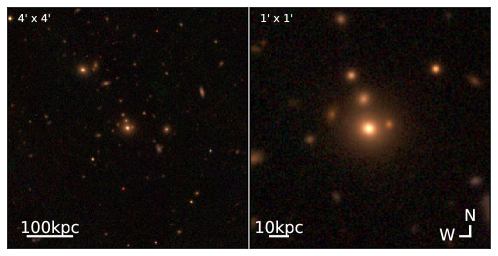
For X-ray sources where an apparent red sequence exists, the PS1 imaging was then visually inspected in order to (a) check for a galactic over-density that is visually consistent with that of a cluster, and (b) check if the AGN host was visually consistent with being a BCG – that is, at the centre of the galactic distribution of the cluster and preferably with an extended cD-like envelope. Any sources satisfying these criteria have been identified as candidate systems in the subsequent analysis. Note that in addition to these there were a number of the AGN which showed a red sequence in their colour-magnitude diagram, and hence are likely to be hosted by a cluster member, but were clearly not the central galaxy, and hence not the focus of this analysis.
4 Results
Of the 3058 broad-line AGN and 412 BL Lac the selection was narrowed down to 22 candidates. These are AGN which satisfy the conditions of (a) exhibiting a colour–magnitude diagram consistent with a cluster red sequence and (b) are hosted by a galaxy visually identifiable as a BCG. Interestingly we find these are almost exclusively BL Lac objects (20/22), with only two of the broad-line AGN satisfying our selection criteria. This suggests broad-line AGN are a very rare episode in the lifetime of any given system.
Our confidence in the technique used is strongly supported by the independent rediscovery of several previously identified systems where a BCG hosts a strong AGN. Some of which are well known; 1H0414+11, 1H1821+644, A2055, RXJ0910+3106, RXJ1745+3951. These five systems have had subsequent pointed X-ray observations confirming the presence of extended cluster emission in addition to the AGN. These observations allow the relative X-ray contributions to be estimated, providing context for our new discoveries - details of which are given in Section 4.5. The independent rediscovery of these clusters, which represent the very systems we are aiming to uncover, strongly supports the validity of our approach.
4.1 Cluster Membership
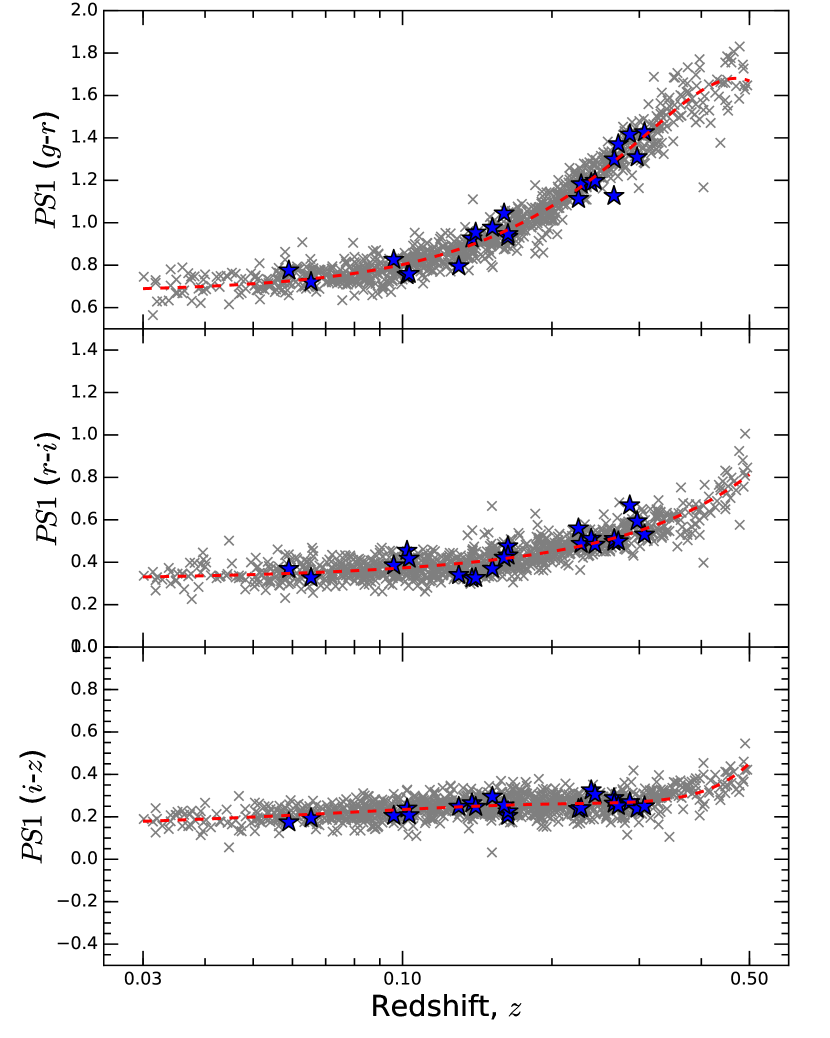
In order to reduce chance projection effects along the line of sight, between a cluster and an unassociated AGN, we investigate whether the AGN is consistent with cluster membership. In lieu of having the required spectroscopy to spectroscopically confirm cluster members, we utilise the relationship between observed red sequence colour and redshift for clusters (Andreon 2003; Rykoff et al. 2014; Green et al. 2016). In Green et al. (2016) it was shown that the cluster redshift of our comparison cluster sample can be photometrically estimated to within , at , using the g–r red sequence colour.
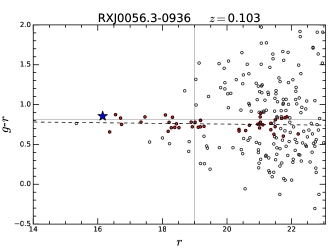
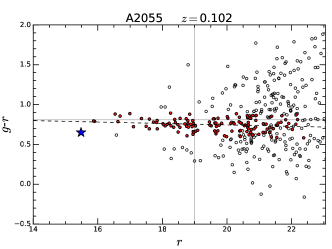
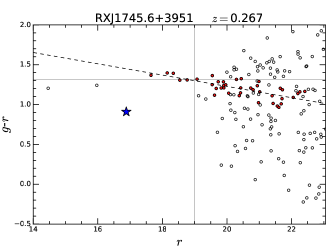
In Fig. 1 we overlay the colour of the apparent red sequences, selected around our AGN, on top of that from our cluster comparison sample. Red sequence colour is defined as the colour, given by the best fitting line of the red sequence, at a flux of 19th magnitude. We find in all of our candidate systems that the red sequence colour is consistent with the colour predicted by the confirmed redshift of the AGN. This suggests that the galactic overdensity we detect is likely at the same redshift of the AGN and hence that the host galaxy is likely a cluster member.
4.2 Red Sequence Richness
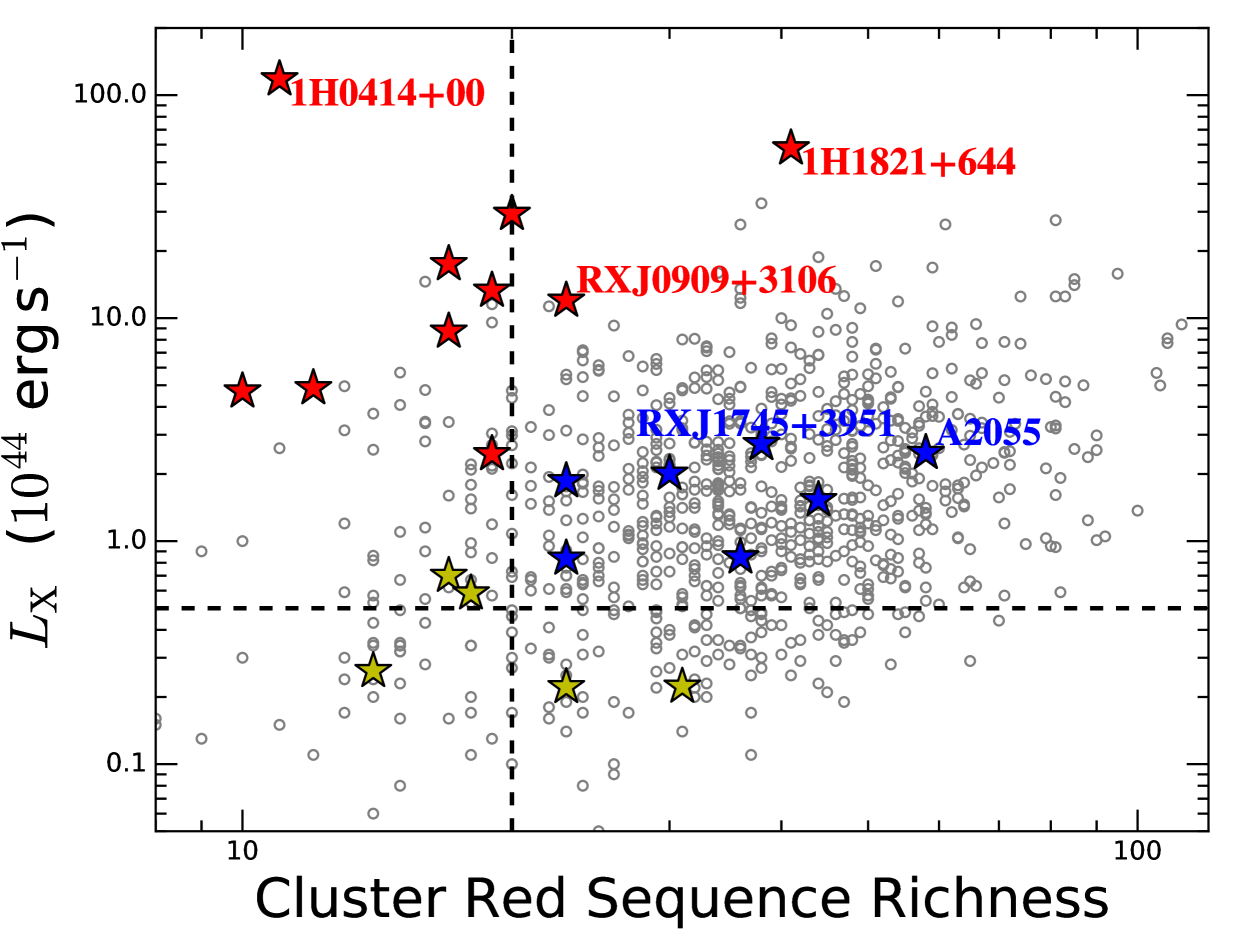
The optical richness of a galaxy cluster, i.e. the number of galaxies in it, scales weakly with the cluster mass (Hall et al. 1997; Johnston et al. 2007; Andreon & Hurn 2010). Hence we expect that the richness of the cluster red sequence – that is, the number of galaxies selected on the cluster red sequence – should scale with the X-ray luminosity of the cluster, (since traces cluster mass). In Figure 2 we plot the X-ray luminosity against the red sequence richness of our cluster comparison cluster sample, where richness is defined as the number of red sequence galaxies brighter than an i-band luminosity of -19 magnitudes, (corresponding to a flux of 16.5 mag at and 22.6 mag at ). We find a weak correlation between and red sequence richness for the cluster sample, but with considerable scatter. A source of scatter in the richness is that we perform our optical photometry within a fixed aperture around the central galaxy. Hence, richness is actually a measure of galaxy density, so diffuse clusters, which tend to be unrelaxed systems that are currently undergoing, or have recently undergone, mergers will be measured with lower richness. So while for any given system one can not assume that because a cluster has a high X-ray luminosity then it will be have a substantially rich red sequence, the overall distribution does provide valuable context for our candidate AGN in cluster cores.
Applying the same procedure of measuring the richness to the 22 AGN candidate systems, we can investigate how the richness of our AGN colour–magnitude relations compare to those of confirmed clusters of similar X-ray luminosity (Fig. 2). By selection, we find all the candidate AGN lie within the scatter of the confirmed cluster sample in terms of richness. So, we can be reasonably confident that all these candidates represent a system where an AGN resides in the central galaxy of at least a group scale structure.
The candidate systems can roughly be divided into three distinct regions, which we colour code for clarity. The systems in the top left (red stars in Fig. 2), which have high X-ray luminosities relative to their richness, are most likely systems where the AGN dominates the X-ray emission. We identify two well known sources within this selection, 1H0414+00 and 1H1821+644, where the AGN is known to dominate. With the exception of 1H1821+644, these tend to have a low richness, suggesting they are likely low mass cluster/group scale overdensities. However it is possible that some are analogues to A689, a system in which a BL Lac is known to reside in a cluster core (although not in the BCG itself) and significantly contaminates the X-ray emission. A Chandra observation revealed an X-ray luminosity for the cluster as when the BL Lac is masked (Giles et al., 2012), an order of magnitude less than the original BCS value of . However this still represents a substantial X-ray luminosity, with a sufficient flux to be detectable as an X-ray cluster in the RASS data. Applying our red sequence selection algorithm yields a richness of 25 for this cluster, making its position in richness– comparable to RXJ0909.9+3106, i.e. over luminous for its given richness. This supports the interpretation that these represent systems where the AGN contribution dominates by as much as an order of magnitude over that of the cluster. Details on these systems are given in Table LABEL:Table:redstars. The candidate systems in the lower left (yellow stars), with a low and/or richness, are likely systems with a moderate AGN in a low mass cluster/group scale system. Details on these systems are given in Table LABEL:Table:othercandidates.
It is the candidates in the centre however, (blue stars), which best match the richness– distribution of our confirmed clusters. As such, they are the systems most likely to exhibit a comparable mix of X-ray emission from the AGN and a rich cluster component, analogous to the Phoenix cluster. We designate these systems, with a richness in excess of 22 red sequence galaxies and , (the dashed lines in Fig. 2), as our ‘best’ candidates. This consists of seven systems, two of which are previously identified systems (A2055 and RXJ1745+3951; see section 4.5). Details on these systems are given in Table LABEL:Table:bestcandidates.
We note there is a more ambiguous source, RXJ0828.2+4154, with a richness narrowly below our best candidate selection criteria, but with a comparable to confirmed clusters (richness and ). However, from a Chandra observation, this source appears to be point source dominated (Donahue private communication).
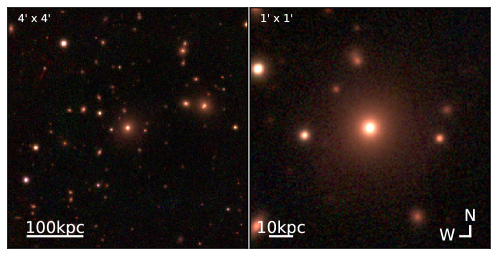
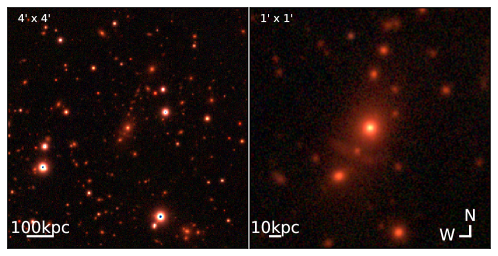
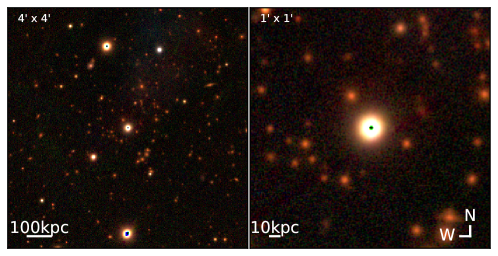
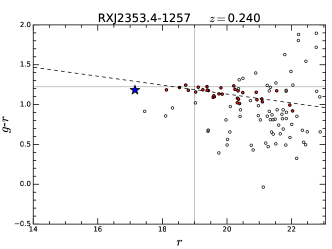
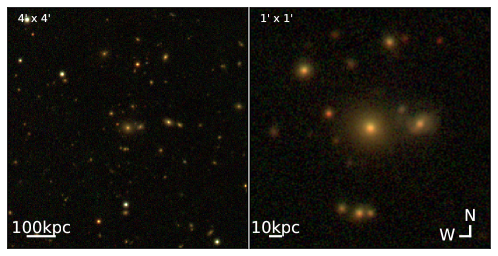
Note, in the appendix (Fig.7), the colour–magnitude diagrams and colour composite images of the cluster and of the BCG, for our ‘best’ candidates and previously confirmed systems, are provided.
4.3 BCG/AGN Luminosity
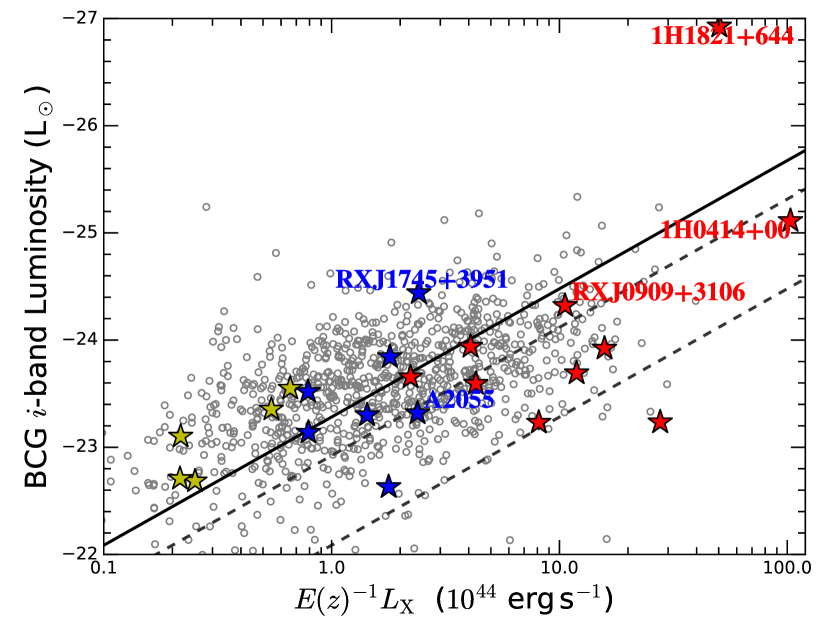
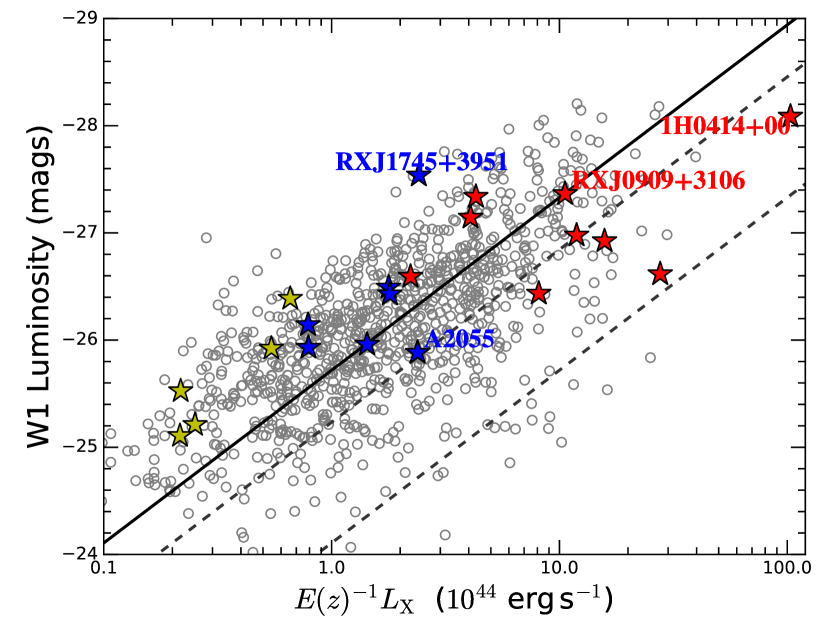
The luminosity of BCGs has been shown to correlate with the X-ray luminosity of their host cluster (e.g. Edge 1991; Stott et al. 2012; Green et al. 2016). Hence in order to check whether our AGN host galaxies are consistent with being BCGs we check the luminosity of the AGN host galaxies in both the optical and Mid-IR. In the PS1 -band we find the AGN host galaxies have luminosities generally consistent with those of BCGs of similar X-ray luminosity clusters (Fig. 3) - indicating these host galaxies have stellar masses consistent with those of BCGs. Similarly in the -band, at , the luminosities of the AGN hosts are generally consistent with BCGs of similar (Fig. 4).
A challenge in the interpretation of these plots is that the AGN itself can contribute to the luminosity of the host BCG, as well as to the X-rays. Hence we maintain the colour coding utilised in Fig. 2 as their relative positions in richness– space provide context in addressing this degeneracy. For example, we notice the majority of the red starred candidate systems appear under-luminous in , with respect to , suggesting either they are dimmer in than most BCGs or they have a higher than similar clusters. But, given these sources have a low richness for their given , it is likely the enhancement of the X-rays, due to the dominant nature of the AGN, is the most significant factor here. 1H1821+644 is over an order of magnitude brighter, in both and W1, than the most luminous BCG from our comparison sample, indicating the luminous quasar dominates the optical and MIR luminosities.
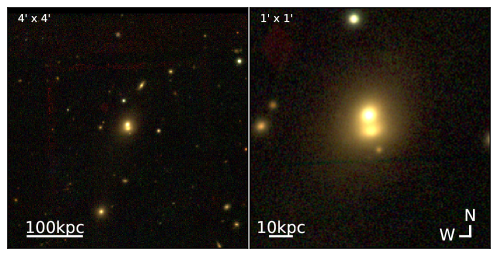
Our best candidate systems are generally well centred with respect to the confirmed BCG sample. However one of our ‘best’ candidate systems also appears under-luminous in , RXJ0056.3-0936. However, this particular system appears to be a multi-component, dumbbell BCG (Fig. 7). In this dumbbell system, the northern component is more consistent with being the BCG, (with , placing it securely within the main distribution of BCGs in Fig. 3), and the BL Lac object is in the southern component. While projection effects within the cluster can not be ruled out, we identify this system as a candidate because it is likely the two components are in the early stages of a merger. This assumption is based on the findings of a follow up study with MUSE IFU spectroscopy of dumbbell BCGs, from the cluster comparison sample, which reveal the majority of dumbbell systems have kinematics consistent with the two components being bound (Green et al. in prep.). Note, as the WISE resolution is insufficient to resolve the two separate components of this dumbbell, the of this galaxy is consistent with the comparison BCGs.
4.4 Confirmation of AGN Nature: BCG/AGN Colours
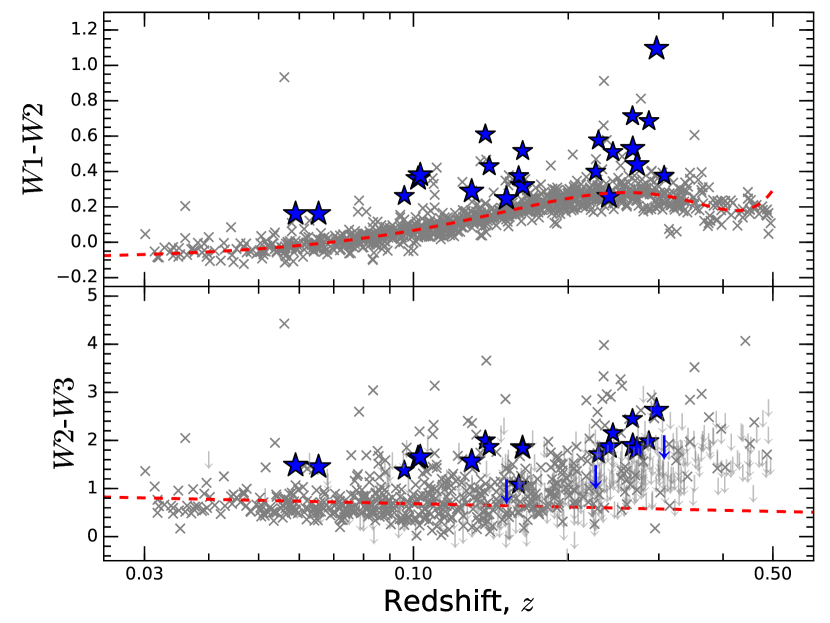
One potential concern is that some of the sources may actually just be ‘ordinary’ clusters – that is a cluster without an AGN in the BCG – which were simply misidentified in the initial RASS X-ray analysis. With this in mind, we investigate the colours of the AGN host galaxies in order to look for properties consistent with AGN. In Green et al. (2016) we measured the colours of the BCGs of the cluster comparison sample and found the bulk population of BCGs were passively evolving. However we found that showed significant colour offsets from passivity due to star formation and/or AGN activity in the BCG. We expect therefore that the AGN in this study should show significant offsets in colour with respect to that of a passive BCG. In addition to investigating the colours, we also check the NVSS data and find that all of our sources are detected at 1.4 GHz, another indicator of the active nature of these galaxies.
In the MIR star formation/AGN activity is characterised by enhanced emission at longer wavelengths, due to reprocessed dust emission, hence our AGN should be redder than passively evolving galaxies of similar redshift. In WISE observations we expect AGN to be red in both W1–W2 and W2–W3 but star forming galaxies to be red in just W2–W3. In Fig. 5 we overlay the WISE W1–W2 and W2–W3 colours for our AGN host galaxies over those of the comparison BCG sample and find that almost all of our AGN candidates are red relative to passive BCGs in both colour indices. There is one source, RXJ2353.4-1257, which appears not to show the expected excess, but a archival NTT spectra is consistent with the BL Lac identification. This supports the assumption that these candidate systems are AGN, rather than a misidentified ‘ordinary’ clusters.
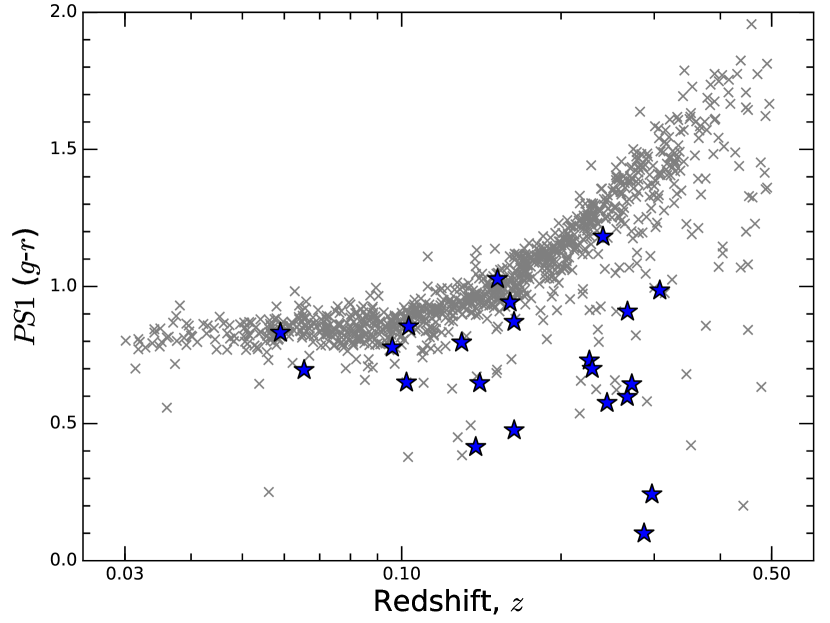
In Fig. 6 we overlay the PS1 g–r colour of our AGN host galaxies over those of the comparison BCGs. We find that the majority of our AGN hosts are significantly blue relative to the bulk population of passive BCGs at a similar redshift. Since 20/22 of these sources are identified as BL Lac objects this is as expected, given that one of the characteristics of BL Lacs is a strong blue continuum in their spectra (Massaro et al., 2012). This further supports the validity of the AGN identification.
4.5 Previously Identified AGN in BCGs
In our analysis we have independently rediscovered a number of sources which have already been identified as an AGN hosted by BCG. These cover a broad range in terms of the relative AGN-to-cluster X-ray contributions, providing valuable context for the candidate systems. Where given below, the relative contribution of AGN and cluster emission are estimated from summing the relative photon counts, in XMM-Newton and Chandra imaging, which can roughly be attributed to point-source-like emission and the more extended emission (similar to the approach outlined in Russell et al. 2013). As such, they are only approximate values and do not take into consideration X-ray variability or the spectral energy distribution of the components.
1H1821+644: This highly luminous broad-line quasar resides in the BCG of a high mass, strong cool core cluster. Interestingly, the ICM around the quasar has a significantly lower entropy and temperature and steeper gradients than comparable clusters (Walker et al., 2014). Within 80 kpc the gradients and profiles are consistent with those of cooling flows, suggesting the AGN is failing to heat ICM and offset radiative cooling as expected. From the Chandra analysis Russell et al. (2010), we know the quasar dominates the central region, but that the cluster is also a significant contributor of X-rays. The relative X-ray contributions are estimated as roughly one part cluster to two parts quasar. The position of this AGN in –Richness space (Fig. 2) is as expected for an X-ray source dominated by the AGN emission, characterised by a relatively low richness for a high . Similarly the high relative to the BCG luminosity is as expected for an AGN dominated system. The extreme optical and MIR luminosity, and MIR colours, indicate the dominant nature of the quasar at these wavelengths.
H0414+009: For a long time H0414+009 has been known to be a BL Lac object hosted by a BCG (McHardy et al. 1992; Falomo et al. 1993). Archival XMM-Newton and Chandra reveal clear point source domination. This is fully consistent with the significant offset in both richness and BCG luminosity from the comparison cluster sample.
A2055: This is an example of a BL Lac object in the BCG of a known Abell cluster. From an archival XMM-Newton observation we estimate the relative cluster–AGN contribution as approximately 1:4. This is perhaps surprising as we expected a more comparable mix of two from its richness– position. However, if we consider that the estimated cluster contribution is , its position in richness– space is still comfortably comparable to the cluster sample.
RXJ0909.9+3106: This appears to be a case of a BL Lac in the BCG of a group of galaxies at a redshift of 0.272. An archival Chandra observation shows the presence of extended cluster emission, confirming the presence of a cluster, but the X-ray emission is clearly AGN dominated (by factor of ). This is consistent with our predictions based on the richness– position and the optical/MIR luminosities. Note, a drop in by a factor of 20 would place it comfortably amongst the comparison cluster richness– distribution.
RXJ1745+3951: This BL Lac object has a ROSAT HRI observation which shows extended cluster emission. Although the core could not be resolved the relative contributions of the BL Lac and the cluster were estimated by Gliozzi et al. (1999) to be roughly equal. An optical analysis revealed the presence of a gravitational arc from a strongly lensed galaxy (Nilsson et al. 1999) confirming a high cluster mass, later estimated to be (Lietzen et al., 2008). The richness and BCG luminosities are fully consistent with other clusters at similar , as expected if this roughly equal mix is genuine.
| Cluster/AGN ID | BCG R.A. | BCG DEC | Redshift | Rich. | AGN Class | Comments | |
|---|---|---|---|---|---|---|---|
| (J2000) | (J2000) | (a) | (b) | ||||
| 1H0414+00 | 04:16:54.5 | :04:56 | 0.287 | 118.00 | 11 | BL Lac | Chandra/XMM: point source dominated |
| RXJ0828.2+4154 | 08:28:14.2 | :53:52 | 0.226 | 2.46 | 19 | BL Lac | Chandra: point source dom. (Donahue priv. comm.) |
| RXJ0909.9+3106 | 09:09:53.3 | :06:03 | 0.272 | 12.00 | 23 | BL Lac | Chandra: extended, but AGN dominated |
| RXJ1117.1+2014 | 11:17:06.3 | :14:07 | 0.138 | 29.40 | 20 | BL Lac | NORAS “AGN-Cluster” ID (Böhringer et al., 2000) |
| RXJ1140.4+1528 | 11:40:23.5 | :28:09 | 0.244 | 13.30 | 19 | BL Lac | |
| RXJ1442.8+1200 | 14:42:48.1 | :00:40 | 0.163 | 8.72 | 17 | BL Lac | Dumbbell; Chandra: point source dominated |
| RXJ1617.1+4106 | 16:17:06.3 | :06:47 | 0.267 | 4.86 | 12 | BL Lac | |
| 1H1821+644 | 18:21:54.4 | :20:09 | 0.297 | 57.80 | 41 | Broad-line | Chandra: extended emission, but quasar dominates |
| RXJ2113.9+1330 | 21:13:53.7 | :30:17 | 0.307 | 4.70 | 10 | BL Lac | |
| RXJ2150.2-1410 | 21:50:15.5 | :10:49 | 0.229 | 17.50 | 17 | BL Lac |
| Cluster/AGN ID | BCG R.A. | BCG DEC | Redshift | Rich. | AGN Class | Comments | |
|---|---|---|---|---|---|---|---|
| (J2000) | (J2000) | (a) | (b) | ||||
| RXJ0039.1-2220 | 00:39:08.2 | :20:01 | 0.065 | 0.22 | 23 | Broad-line | |
| RXJ0110.1+4150 | 01:10:04.8 | :49:50 | 0.096 | 0.26 | 14 | BL Lac | |
| RXJ0656.2+4237 | 06:56:10.7 | :37:03 | 0.059 | 0.22 | 31 | BL Lac | |
| RXJ1053.7+4930 | 10:53:44.1 | :29:56 | 0.140 | 0.70 | 17 | BL Lac | |
| RXJ2336.9-2326 | 23:36:53.8 | :26:26 | 0.160 | 0.31 | 18 | BL Lac |
| Cluster/AGN ID | BCG R.A. | BCG DEC | Redshift | Rich. | AGN Class | Comments/X-rays Obs. | |
|---|---|---|---|---|---|---|---|
| (J2000) | (J2000) | (a) | (b) | ||||
| RXJ0014.3+0854 | 00:14:19.7 | :54:02 | 0.163 | 0.85 | 36 | BL Lac | |
| RXJ0056.3-0936 | 00:56:20.1 | :36:32 | 0.103 | 1.86 | 23 | BL Lac | BCG is a dumbbell galaxy |
| RXJ1013.6-1351 | 10:13:35.2 | :51:29 | 0.152 | 1.53 | 44 | BL Lac | |
| RXJ1516.7+2918 | 15:16:41.6 | :18:09 | 0.130 | 0.84 | 23 | BL Lac | |
| A2055 | 15:18:45.7 | :13:56 | 0.102 | 2.49 | 58 | BL Lac | Cluster confirmed: XMM-Newton |
| RXJ1745.6+3951 | 17:45:37.7 | :51:31 | 0.267 | 2.73 | 38 | BL Lac | Cluster confirmed: ROSAT HRI |
| RXJ2353.4-1257 | 23:53:25.1 | :57:01 | 0.240 | 2.01 | 30 | BL Lac |
4.6 Clusters Previously Incorrectly Identified as AGN
There are a number of systems in which the identification of the majority of the X-ray emission has alternated between cluster and AGN. We give two illustrative examples.
Zw2089: This is a LoCuSS cluster that shows relatively broad lines in its optical spectrum, but the point source does not contribute more than 5% to the total cluster flux (Russell et al., 2013).
RXCJ0132.6-0804: Dutson et al. (2013) find that this cluster may contain a Fermi source in its BCG, however an archival Chandra observation finds the majority of the emission is from the extended emission.
Therefore, it is important to be aware that many systems are a combination of both cluster and AGN emission in X-ray data. This is illustrated in the compilation of BL Lac samples, such as the Roma BZCAT sample, where the radio and X-ray properties of clusters can be misinterpreted as being from a BL Lac.
4.6.1 The Roma BZCAT catalogue
| BZCAT ID | Cluster ID | Redshift | Reference |
| 5BZGJ0006+1051 | Z15 | 0.1676 | eBCS Ebeling et al. (2000) |
| 5BZGJ0012-1628 | A11 | 0.1510 | RBSC Bauer et al. (2000) |
| 5BZGJ0014+0854 | MS0011.7+0837 | 0.1633 | EMSS Stocke et al. (1991) |
| 5BZGJ0027+2607 | MACSJ0027.4+2607* | 0.3645 | MACS Ebeling et al. (2010) |
| 5BZGJ0056-0936 | RXJ0056.3-0936 | 0.1031 | This paper |
| 5BZGJ0123+4216 | NVSS cluster | 0.1856 | NVSS Bauer et al. (2000) |
| 5BZGJ0153-0118 | NVSS cluster | 0.2458 | NVSS Bauer et al. (2000) |
| 5BZGJ0425-0833 | EXO0422-086 | 0.0390 | REFLEX Böhringer et al. (2004) |
| 5BZGJ0439+0520 | RXCJ0439.0+0520* | 0.2080 | BCS Ebeling et al. (1998) |
| 5BZGJ0656+4237 | RXJ0656.1+4237 | 0.0590 | This paper |
| 5BZGJ0737+5941 | UGC3927 | 0.0410 | |
| 5BZGJ0737+3517 | A590 | 0.2104 | |
| 5BZGJ0751+1730 | Z1432 | 0.1866 | eBCS Ebeling et al. (2000) |
| 5BZGJ0753+2921 | A602 | 0.0621 | BCS Ebeling et al. (1998) |
| 5BZGJ0834+5534 | 4C+55.16* | 0.2412 | Iwasawa et al. (1999) |
| 5BZGJ0856+5418 | 0.2594 | RBSC Bauer et al. (2000) | |
| 5BZGJ0927+5327 | Z2379* | 0.2011 | eBCS Ebeling et al. (2000) |
| 5BZGJ0944-1347 | NVSS cluster | 0.1782 | RBSC Bauer et al. (2000) |
| 5BZGJ1108-0149 | NVSS cluster | 0.1056 | RBSC Bauer et al. (2000) |
| 5BZGJ1119+0900 | RedMAPPER | 0.3315 | Chandra obs |
| 5BZGJ1350+0940 | RXCJ1350.3+0940* | 0.1325 | RBSC Hogan et al. (2015b) |
| 5BZGJ1356-3421 | PKS1353-341* | 0.2227 | Véron-Cetty et al. (2000) |
| 5BZGJ1407-2701 | A3581* | 0.0218 | REFLEX Böhringer et al. (2004) |
| 5BZGJ1413+4339 | A1885* | 0.0893 | BCS Ebeling et al. (1998) |
| 5BZGJ1445+0039 | 0.3062 | ||
| 5BZGJ1459-1810 | S780* | 0.2360 | REFLEX Böhringer et al. (2004) |
| 5BZGJ1504-0248 | RXCJ1504.1-0248* | 0.2169 | REFLEX Böhringer et al. (2004) |
| 5BZGJ1516+2918 | RXJ1516.7+2918 | 0.1298 | This paper |
| 5BZGJ1532+3020 | MACSJ1532.8+3021* | 0.3621 | BCS Ebeling et al. (1998) |
| 5BZGJ1603+1554 | RXCJ1603.6+1553* | 0.1097 | RBSC Hogan et al. (2015a) |
| 5BZGJ1715+5724 | NGC6338* | 0.0281 | BCS Ebeling et al. (1998) |
| 5BZGJ1717+2931 | RBS1634 | 0.2782 | RBSC Bauer et al. (2000) |
| 5BZGJ1717+4227 | Zw8193* | 0.1829 | eBCSEbeling et al. (2000) |
| 5BZGJ1727+5510 | A2270* | 0.2473 | RBSC Hogan et al. (2015a) |
| 5BZGJ1745+3951 | RGB 1745+398* | 0.2670 | Gliozzi et al. (1999) |
| 5BZGJ1804+0042 | CIZA1804.1+0042 | 0.0700 | CIZA Ebeling et al. (2000) |
| 5BZGJ2003-0856 | NVSS cluster | 0.0572 | RBSC Bauer et al. (2000) |
| 5BZGJ2140-2339 | MS2137.3-2353* | 0.3130 | EMSS Stocke et al. (1991) |
| 5BZGJ2147-1019 | REFLEX cluster | 0.0797 | REFLEX Böhringer et al. (2004) |
| 5BZGJ2320+4146 | CIZA2320.2+4146 | 0.1520 | CIZA Ebeling et al. (2000) |
| 5BZGJ2341+0018 | NORAS cluster | 0.2767 | NORAS Böhringer et al. (2004) |
Table LABEL:Table:BZCAT lists the 41 ROSAT BSC sources which are listed in Massaro et al. (2015) as being BL Lac objects, but in which we are confident the cluster emission dominates. These results are based on a combination of this analysis, archival X-ray data, and the literature. The large majority are listed in Massaro et al. (2015) as “BL Lac-galaxy dominated”, meaning their SEDs suggest dominance of the host galaxy over the nuclear emission. We note their optical spectra show strong emission lines in almost all cases (e.g. 4C+55.16/5BZGJ0834+5534, Iwasawa et al. 1999. Clusters with pointed X-ray observations are noted in the table and in all cases the extended emission dominates. While the selection method used to create the BZCAT sample is efficient in selecting BL Lacs, there is a significant number of sources that need to be filtered out to avoid contamination. Using the fraction of polarisation in the radio, as used by Edge et al. (2003), or the detection of significant extent in the RASS emission (Voges et al., 1999), would have excluded the majority of the sources listed in Table LABEL:Table:BZCAT, without significantly affecting the selection of BL Lacs.
4.7 Lessons for the Future
The pending launch of eROSITA and subsequent X-ray survey will dramatically increase the number of clusters and AGN detected in hard X-rays. The importance of having a clear context in which to place the more ambiguous sources, where there is evidence of both a rich cluster and an AGN, means that we should consider what this study tells us.
Firstly, the number of X-ray selected AGN that reside at the cores of rich clusters is relatively low. There are not many BCGs that are accreting close to their Eddington rate and lost to our X-ray selection. This is to be expected from the likely duty cycle of AGN and we can set a more stringent upper limit to this by noting that very few of the systems identified here are broad-lined AGN. Instead the large majority are BL Lacs, where orientation effects dominate. Therefore, given our parent sample of X-ray clusters is nearly 1000 in total (Green et al. 2016), the duty cycle for high accretion rate events is well below 1%, with just two clearly identifiable broad-line AGN in our sample.
We can also place a crude limit on the angular size of the relativistic beaming cone for jets in BCGs. Assuming the 7 BL Lacs are drawn randomly in orientation from all BCGs, in the total of 949 RASS clusters covered by the PS1 footprint, then only 0.74% of BCGs are beamed towards us. So the opening angle is 7.0∘. If we exclude BCGs with low radio power, (approximately two thirds of the sample) using the radio luminosity function of BCGs in Hogan et al. (2015a), then the fraction of beamed objects increases to approximately 2.2% and hence the implied opening angle is 12.1∘. This is consistent with limits from superluminal motion studies in BL Lacs and beamed flat-spectrum radio galaxies, which suggest angles of 2–5∘ for Lorentz factors less than 10, as should be the case in these sources (Jorstad et al. 2005). Clearly a significantly better constraint can be derived in the near future with the combination of eROSITA and new radio surveys such as VLASS, EMU and WODAN.
Although outside of the immediate scope of this work, a further subtlety to consider, in identifying ambiguous sources and understanding the feedback of AGN in cluster cores, is AGN variability. Variability has the potential to tip the balance of emission between cluster and AGN contributions at the time of some given observation. An illustrative example is NGC1275 in the Perseus cluster (O’Dea et al. 1984; Dutson et al. 2014; Fabian et al. 2015), which has exhibited a variation of at least one order of magnitude on a timescale of a few decades.
5 Summary and Conclusions
We use the PS1 survey to look for signs of a rich cluster around the full ROSAT All Sky Survey AGN population in the PS1 footprint, constituting some 3058 broad-line AGN and 412 BL Lac objects. Of these, we find 22 AGN with signs of a significant overdensity in red galaxies, suggestive of a possible cluster red sequence, and which are hosted by a galaxy visually consistent with being a BCG. We compare the properties of these candidate systems with those of a comparison sample of the confirmed clusters also drawn from the ROSAT All Sky Survey.
We identify seven best candidates, contingent on having a red sequence richness that is most comparable to the confirmed massive clusters at similar X-ray luminosities. Amongst our 22 candidate systems, five have been previously confirmed to be a cluster with a BCG in its central galaxy, with pointed X-ray observations available, strongly validating our technique, and providing valuable context for our candidate systems.
We use the colour of the red sequence as a tracer of redshift to investigate cluster membership of the AGN. We find all our candidate systems have a red sequence colour which is similar to that of the confirmed clusters at similar redshift, indicative that the AGN and red sequence galaxies share a common redshift.
The optical and MIR luminosities of the AGN host galaxies are found to be generally consistent with those of the BCGs of the comparison clusters, at similar X-ray luminosities. This supports our visual identification of the AGN host galaxies as BCGs.
We also check the validity of the initial AGN identification by looking at the MIR and optical colours of our AGN. In the MIR we find all candidate systems show an excess MIR emission with respect to the bulk passively evolving population of comparison BCGs, suggestive of activity. In the optical we find the majority of sources are significantly blue in g–r, with respect to the passively evolving BCGs, consistent with their identification as BL Lacs.
We emphasise the need to consider the ambiguity that exists in the identification of clusters and AGN in X-ray data, and stress it is not necessarily a case of one of the other. This very simple approach of checking for optical overdensities, around X-ray selected AGN, can be utilised to correct for selection effects against the detection of strong AGN in the cores of clusters. This ultimately will provide better statistics relating to both the prevalence of, and energetics involved with, AGN in BCGs - increasing our understanding of the role of AGN feedback in this unique environment. This consideration will be particularly important in the future with the next generation of X-rays survey telescopes, such as eROSITA, set to uncover vast numbers of new X-ray sources; including clusters, AGN and the two combined.
Acknowledgements
We thank the referee for their valuable comments and suggestions to the improvement of this manuscript. TSG received financial support from the Science and Technology Facilities Council (STFC) grant ST/K501979/1. ACE acknowledges support from STFC grant ST/I001573/1.
This research has made use of the NASA/IPAC Extragalactic Database (NED) which is operated by the Jet Propulsion Laboratory, California Institute of Technology, under contract with the National Aeronautics and Space Administration.
The Pan-STARRS1 Surveys (PS1) have been made possible through contributions by the Institute for Astronomy, the University of Hawaii, the Pan-STARRS Project Office, the Max-Planck Society and its participating institutes, the Max Planck Institute for Astronomy, Heidelberg and the Max Planck Institute for Extraterrestrial Physics, Garching, The Johns Hopkins University, Durham University, the University of Edinburgh, the Queen’s University Belfast, the Harvard-Smithsonian Center for Astrophysics, the Las Cumbres Observatory Global Telescope Network Incorporated, the National Central University of Taiwan, the Space Telescope Science Institute, and the National Aeronautics and Space Administration under Grant No. NNX08AR22G issued through the Planetary Science Division of the NASA Science Mission Directorate, the National Science Foundation Grant No. AST-1238877, the University of Maryland, Eotvos Lorand University (ELTE), and the Los Alamos National Laboratory.
AllWISE makes use of data from WISE, which is a joint project of the University of California, Los Angeles, and the Jet Propulsion Laboratory/California Institute of Technology, and NEOWISE, which is a project of the Jet Propulsion Laboratory/California Institute of Technology. WISE and NEOWISE are funded by the National Aeronautics and Space Administration.
References
- Anderson et al. (2003) Anderson S. F., et al., 2003, AJ, 126, 2209
- Anderson et al. (2007) Anderson S. F., et al., 2007, AJ, 133, 313
- Andreon (2003) Andreon S., 2003, A&A, 409, 37
- Andreon & Hurn (2010) Andreon S., Hurn M. A., 2010, MNRAS, 404, 1922
- Bauer et al. (2000) Bauer F. E., Condon J. J., Thuan T. X., Broderick J. J., 2000, ApJS, 129, 547
- Bertin & Arnouts (1996) Bertin E., Arnouts S., 1996, A&AS, 117, 393
- Bîrzan et al. (2004) Bîrzan L., Rafferty D. A., McNamara B. R., Wise M. W., Nulsen P. E. J., 2004, ApJ, 607, 800
- Boehringer et al. (1993) Boehringer H., Voges W., Fabian A. C., Edge A. C., Neumann D. M., 1993, MNRAS, 264, L25
- Böhringer et al. (2000) Böhringer H., et al., 2000, ApJS, 129, 435
- Böhringer et al. (2004) Böhringer H., et al., 2004, A&A, 425, 367
- Bower et al. (2006) Bower R. G., Benson A. J., Malbon R., Helly J. C., Frenk C. S., Baugh C. M., Cole S., Lacey C. G., 2006, MNRAS, 370, 645
- Bruzual & Charlot (2003) Bruzual G., Charlot S., 2003, MNRAS, 344, 1000
- Burns (1990) Burns J. O., 1990, AJ, 99, 14
- Cardelli et al. (1989) Cardelli J. A., Clayton G. C., Mathis J. S., 1989, ApJ, 345, 245
- Cavagnolo et al. (2008) Cavagnolo K. W., Donahue M., Voit G. M., Sun M., 2008, ApJ, 683, L107
- Donahue et al. (2010) Donahue M., et al., 2010, ApJ, 715, 881
- Dunn & Fabian (2006) Dunn R. J. H., Fabian A. C., 2006, MNRAS, 373, 959
- Dutson et al. (2013) Dutson K. L., White R. J., Edge A. C., Hinton J. A., Hogan M. T., 2013, MNRAS, 429, 2069
- Dutson et al. (2014) Dutson K. L., Edge A. C., Hinton J. A., Hogan M. T., Gurwell M. A., Alston W. N., 2014, MNRAS, 442, 2048
- Ebeling et al. (1996) Ebeling H., Voges W., Bohringer H., Edge A. C., Huchra J. P., Briel U. G., 1996, MNRAS, 281, 799
- Ebeling et al. (1998) Ebeling H., Edge A. C., Bohringer H., Allen S. W., Crawford C. S., Fabian A. C., Voges W., Huchra J. P., 1998, MNRAS, 301, 881
- Ebeling et al. (2000) Ebeling H., Edge A. C., Allen S. W., Crawford C. S., Fabian A. C., Huchra J. P., 2000, MNRAS, 318, 333
- Ebeling et al. (2001) Ebeling H., Edge A. C., Henry J. P., 2001, ApJ, 553, 668
- Ebeling et al. (2007) Ebeling H., Barrett E., Donovan D., Ma C.-J., Edge A. C., van Speybroeck L., 2007, ApJ, 661, L33
- Ebeling et al. (2010) Ebeling H., Edge A. C., Mantz A., Barrett E., Henry J. P., Ma C. J., van Speybroeck L., 2010, MNRAS, 407, 83
- Edge (1991) Edge A. C., 1991, MNRAS, 250, 103
- Edge et al. (2003) Edge A. C., Ebeling H., Bremer M., Röttgering H., van Haarlem M. P., Rengelink R., Courtney N. J. D., 2003, MNRAS, 339, 913
- Fabian (1994) Fabian A., 1994, ARA&A, 32, 277
- Fabian (2012) Fabian A. C., 2012, ARA&A, 50, 455
- Fabian et al. (2015) Fabian A. C., Walker S. A., Pinto C., Russell H. R., Edge A. C., 2015, MNRAS, 451, 3061
- Falomo et al. (1993) Falomo R., Pesce J. E., Treves A., 1993, AJ, 105, 2031
- Falomo et al. (2014) Falomo R., Pian E., Treves A., 2014, A&ARv, 22, 73
- Fogarty et al. (2015) Fogarty K., Postman M., Connor T., Donahue M., Moustakas J., 2015, ApJ, 813, 117
- Giles et al. (2012) Giles P. A., Maughan B. J., Birkinshaw M., Worrall D. M., Lancaster K., 2012, MNRAS, 419, 503
- Gliozzi et al. (1999) Gliozzi M., Brinkmann W., Laurent-Muehleisen S. A., Takalo L. O., Sillanpää A., 1999, A&A, 352, 437
- Green et al. (2016) Green T. S., et al., 2016, MNRAS, 461, 560
- Hall et al. (1997) Hall P. B., Ellingson E., Green R. F., 1997, AJ, 113, 1179
- Hlavacek-Larrondo et al. (2012) Hlavacek-Larrondo J., Fabian A. C., Edge A. C., Ebeling H., Sanders J. S., Hogan M. T., Taylor G. B., 2012, MNRAS, 421, 1360
- Hlavacek-Larrondo et al. (2015) Hlavacek-Larrondo J., et al., 2015, ApJ, 805, 35
- Hoffer et al. (2012) Hoffer A. S., Donahue M., Hicks A., Barthelemy R. S., 2012, ApJS, 199, 23
- Hogan et al. (2015a) Hogan M. T., et al., 2015a, MNRAS, 453, 1201
- Hogan et al. (2015b) Hogan M. T., et al., 2015b, MNRAS, 453, 1223
- Iwasawa et al. (1999) Iwasawa K., Allen S. W., Fabian A. C., Edge A. C., Ettori S., 1999, MNRAS, 306, 467
- Johnston et al. (2007) Johnston D. E., et al., 2007, preprint, (arXiv:0709.1159)
- Jorstad et al. (2005) Jorstad S. G., et al., 2005, AJ, 130, 1418
- Kollatschny et al. (2008) Kollatschny W., Kotulla R., Pietsch W., Bischoff K., Zetzl M., 2008, A&A, 484, 897
- Kron (1980) Kron R. G., 1980, ApJS, 43, 305
- Lietzen et al. (2008) Lietzen H., Nilsson K., Takalo L. O., Heinämäki P., Nurmi P., Keinänen P., Wagner S., 2008, A&A, 482, 771
- Lin et al. (2003) Lin Y.-T., Mohr J. J., Stanford S. A., 2003, ApJ, 591, 749
- Mahony et al. (2010) Mahony E. K., Croom S. M., Boyle B. J., Edge A. C., Mauch T., Sadler E. M., 2010, MNRAS, 401, 1151
- Martini et al. (2006) Martini P., Kelson D. D., Kim E., Mulchaey J. S., Athey A. A., 2006, ApJ, 644, 116
- Massaro et al. (2009) Massaro E., Giommi P., Leto C., Marchegiani P., Maselli A., Perri M., Piranomonte S., Sclavi S., 2009, A&A, 495, 691
- Massaro et al. (2012) Massaro E., Nesci R., Piranomonte S., 2012, MNRAS, 422, 2322
- Massaro et al. (2015) Massaro E., Maselli A., Leto C., Marchegiani P., Perri M., Giommi P., Piranomonte S., 2015, Ap&SS, 357, 75
- McDonald et al. (2012) McDonald M., et al., 2012, Nature, 488, 349
- McDonald et al. (2013) McDonald M., Benson B., Veilleux S., Bautz M. W., Reichardt C. L., 2013, ApJ, 765, L37
- McDonald et al. (2014) McDonald M., Roediger J., Veilleux S., Ehlert S., 2014, ApJ, 791, L30
- McHardy et al. (1992) McHardy I. M., Luppino G. A., George I. M., Abraham R. G., Cooke B. A., 1992, MNRAS, 256, 655
- McNamara & Nulsen (2007) McNamara B. R., Nulsen P. E. J., 2007, ARA&A, 45, 117
- McNamara & Nulsen (2012) McNamara B. R., Nulsen P. E. J., 2012, New Journal of Physics, 14, 055023
- McNamara et al. (2000) McNamara B. R., et al., 2000, ApJ, 534, L135
- Nilsson et al. (1999) Nilsson K., Takalo L. O., Pursimo T., Sillanpää A., Heidt J., Wagner S. J., Laurent-Muehleisen S. A., Brinkmann W., 1999, A&A, 343, 81
- O’Dea et al. (1984) O’Dea C. P., Dent W. A., Balonek T. J., 1984, ApJ, 278, 89
- O’Dea et al. (2008) O’Dea C. P., et al., 2008, ApJ, 681, 1035
- Pesce et al. (1990) Pesce J. E., Fabian A. C., Edge A. C., Johnstone R. M., 1990, MNRAS, 244, 58
- Rafferty et al. (2006) Rafferty D. A., McNamara B. R., Nulsen P. E. J., Wise M. W., 2006, ApJ, 652, 216
- Rawle et al. (2012) Rawle T. D., et al., 2012, ApJ, 747, 29
- Rector et al. (1999) Rector T. A., Stocke J. T., Perlman E. S., 1999, ApJ, 516, 145
- Russell et al. (2010) Russell H. R., Fabian A. C., Sanders J. S., Johnstone R. M., Blundell K. M., Brandt W. N., Crawford C. S., 2010, MNRAS, 402, 1561
- Russell et al. (2013) Russell H. R., McNamara B. R., Edge A. C., Hogan M. T., Main R. A., Vantyghem A. N., 2013, MNRAS, 432, 530
- Rykoff et al. (2014) Rykoff E. S., et al., 2014, ApJ, 785, 104
- Santos et al. (2008) Santos J. S., Rosati P., Tozzi P., Böhringer H., Ettori S., Bignamini A., 2008, A&A, 483, 35
- Schlafly & Finkbeiner (2011) Schlafly E. F., Finkbeiner D. P., 2011, ApJ, 737, 103
- Schwope et al. (2000) Schwope A., et al., 2000, Astronomische Nachrichten, 321, 1
- Siemiginowska et al. (2010) Siemiginowska A., Burke D. J., Aldcroft T. L., Worrall D. M., Allen S., Bechtold J., Clarke T., Cheung C. C., 2010, ApJ, 722, 102
- Stein et al. (1976) Stein W. A., Odell S. L., Strittmatter P. A., 1976, ARA&A, 14, 173
- Stocke et al. (1991) Stocke J. T., Morris S. L., Gioia I. M., Maccacaro T., Schild R., Wolter A., Fleming T. A., Henry J. P., 1991, ApJS, 76, 813
- Stott et al. (2012) Stott J. P., et al., 2012, MNRAS, 422, 2213
- Tonry et al. (2012) Tonry J. L., et al., 2012, ApJ, 750, 99
- Tremblay et al. (2012) Tremblay G. R., et al., 2012, MNRAS, 424, 1042
- Urry & Padovani (1995) Urry C. M., Padovani P., 1995, PASP, 107, 803
- Véron-Cetty et al. (2000) Véron-Cetty M.-P., Woltjer L., Staveley-Smith L., Ekers R. D., 2000, A&A, 362, 426
- Vikhlinin et al. (2007) Vikhlinin A., Burenin R., Forman W. R., Jones C., Hornstrup A., Murray S. S., Quintana H., 2007, in Böhringer H., Pratt G. W., Finoguenov A., Schuecker P., eds, Heating versus Cooling in Galaxies and Clusters of Galaxies. p. 48 (arXiv:astro-ph/0611438), doi:10.1007/978-3-540-73484-0_9
- Voges et al. (1999) Voges W., et al., 1999, A&A, 349, 389
- Walker et al. (2014) Walker S. A., Fabian A. C., Russell H. R., Sanders J. S., 2014, MNRAS, 442, 2809
- Wright et al. (2010) Wright E. L., et al., 2010, AJ, 140, 1868
- Zenn & Ebeling (2010) Zenn A. R., Ebeling H., 2010, A&A, 524, A30
Appendix A Colour–Magnitude Diagrams and Colour Composite Images
Here we show the – colour-magnitude diagram, as well as colour images at cluster and BCG scale, for the ‘best’ candidates and the previously identified systems.