The red sequence at birth in the galaxy cluster Cl J1449+0856 at
Abstract
We use HST/WFC3 imaging to study the red population in the IR-selected, X-ray detected, low-mass cluster Cl J1449+0856 at z=2, one of the few bona-fide established clusters discovered at this redshift, and likely a typical progenitor of an average massive cluster today. This study explores the presence and significance of an early red sequence in the core of this structure, investigating the nature of red sequence galaxies, highlighting environmental effects on cluster galaxy populations at high redshift, and at the same time underlining similarities and differences with other distant dense environments. Our results suggest that the red population in the core of Cl J1449+0856 is made of a mixture of quiescent and dusty star-forming galaxies, with a seedling of the future red sequence already growing in the very central cluster region, and already characterising the inner cluster core with respect to lower density environments. On the other hand, the color-magnitude diagram of this cluster is definitely different from that of lower-redshift clusters, as well as of some rare particularly evolved massive clusters at similar redshift, and it is suggestive of a transition phase between active star formation and passive evolution occurring in the proto-cluster and established lower-redshift cluster regimes.
Subject headings:
galaxies: clusters: individual (Cl J1449+0856) — galaxies: high-redshift — galaxies: evolution1. Introduction
In the nearby Universe and up to , cluster cores host the most massive early-type galaxies containing stars nearly as old as the Hubble time, making for a “red sequence” in their color-magnitude diagram (CMD) (e.g., Kodama & Arimoto 1997; Mei et al. 2009), often considered as a defining signature of dense environments. Observations of the evolution of the red galaxy population back to the proto-cluster regime show that, although massive passive galaxies and tight red sequences in cluster cores are already common even earlier than (e.g., Lidman et al. 2008; Newman et al. 2014), the red sequence seems to increase its scatter, depopulate at lower stellar masses (note possible dependence on cluster mass, e.g. Tanaka et al. 2007; Andreon 2008; Hilton et al. 2009; Papovich et al. 2010; Rudnick et al. 2012; Lemaux et al. 2012; Cerulo et al. 2016) and eventually dissolve in most distant cluster progenitor environments. A first sequence probably appears at high stellar masses just before (Kodama et al. 2007; Zirm et al. 2008), in agreement with star formation histories inferred for lower-redshift passive cluster galaxies (e.g., Gobat et al. 2008; Rettura et al. 2010; Strazzullo et al. 2010; Snyder et al. 2012), placing their major star formation epoch at .
In the last few years, cluster studies systematically approached this expected formation epoch and indeed started revealing increasing star formation, nuclear and merging activity in clusters (e.g., Hilton et al. 2010; Hayashi et al. 2011; Stanford et al. 2012; Brodwin et al. 2013; Tran et al. 2015; Santos et al. 2015; Webb et al. 2015; Alberts et al. 2016). Wang et al. (2016) study of a structure seemingly captures the massive star formation event likely producing the future red sequence. On the other hand, although often co-existing with still actively star-forming (SF) sources, quiescent galaxies are found in cluster cores even up to (e.g., Kurk et al. 2009; Gobat et al. 2011, 2013; Spitler et al. 2012; Tanaka et al. 2013; Strazzullo et al. 2013; Smail et al. 2014; Newman et al. 2014; Cooke et al. 2016), with enhanced quiescent fractions with respect to field levels testifying to an early onset of environmental signatures on galaxy population properties.
In this work, we follow-up on our previous studies of the cluster Cl J1449+0856 (hereafter ClJ1449) at z=1.995 (Gobat et al. 2011, 2013; Strazzullo et al. 2013; Valentino et al. 2015, 2016, hereafter G11, G13, S13, V15, V16) with an investigation of the CMD based on Hubble Space Telescope ( HST) observations. These data provide a deep, high-resolution probe of the restframe U-B color of galaxies in ClJ1449, significantly improving our previous photometric analyses and eventually enabling a study of the red population in one of the most distant cluster environments known thus far.
ClJ1449 is a low-mass ( M⊙), IRAC-color selected, X-ray detected structure in the mass range of typical progenitors of today’s massive clusters (G11). In contrast with rare examples of impressively evolved structures at similar redshift (Andreon et al. 2014; Newman et al. 2014), ClJ1449 thus probably draws a more common picture of galaxy populations in the first clusters at this crucial epoch.
We assume =0.3, =0.7, H0=70 km s-1 Mpc-1, and a Salpeter (1955) IMF. Magnitudes are in the AB system.
2. Observations and measurements
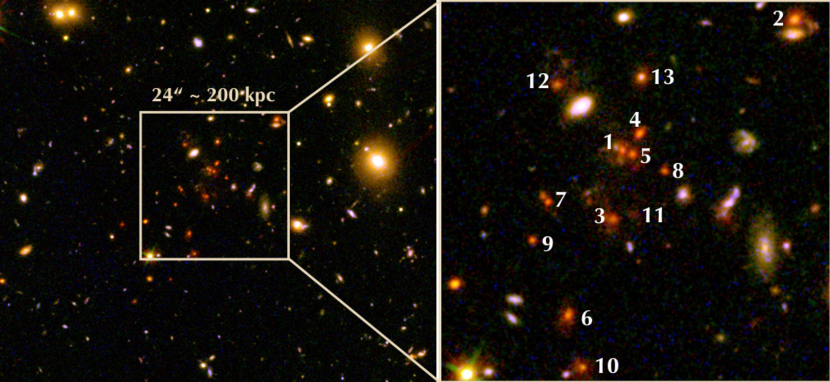
This work is largely based on HST Wide Field Camera 3 (WFC3) observations of ClJ1449 in the F105W and F140W bands. Fig. 1 shows an image of the cluster field, and highlights all potential red cluster members in the central region (m105-m1400.9, kpc). We further use optical/NIR data and derived quantities from our previous work, and specifically spectroscopic redshifts (G11, G13, V15) to identify cluster members, complemented with photometric redshift (photo-z) based membership (S13, see original papers for details). In the following we refer to: i) interlopers including spectroscopic and photo-z interlopers, ii) possible members including uncertain, low-likelihood photo–z candidate members (S13), and iii) members including spectroscopic and high-likelihood photo-z members (S13). We use photometric measurements and derived quantities from S13, complemented where needed with new measurements performed with the same approach accounting for the new F105W data111Measurements for some galaxies will thus differ from those in S13. We note (in particular for source ID 1, see Fig. 1) that the new F105W data support in some (rare) case a different source extraction than the one used in S13, resulting in different source properties. Furthermore, we redetermined stellar masses using the newly available photometry, and - in contrast to S13 - using the original photometric zero-points rather than those adjusted for photo-z determination. Stellar masses used here are thus not identical to those in S13..
We also use a control field of 60 arcmin2 in the CANDELS (Grogin et al. 2011) GOODS-S field as a statistical comparison for galaxy populations in ClJ1449. We use multiwavelength photometry from Guo et al. (2013) and photo–zs from Schreiber et al. (2015). Lacking sufficiently deep F140W-band imaging, we measure synthetic m140 magnitudes by convolving best-fit SEDs from Pannella et al. (2015) with the F140W response function. In the magnitude range of interest, we estimate a mag uncertainty for these synthetic magnitudes, which is not relevant for our purposes.

3. The color-magnitude diagram
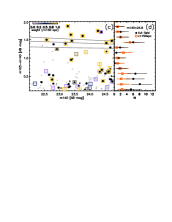
Fig. 2a shows the F105W-F140W CMD in the field of ClJ1449, over a region extending to a maximum clustercentric distance r=500 kpc (proper) at (1’, about the estimated Mpc for ClJ1449, G13, V16). All galaxies in the probed field are shown, but cluster members are highlighted with colored symbols according to their stellar population properties (Sec. 4, Fig. 5).
Fig. 2c shows an alternative, photo–z independent picture of the CMD, largely based on statistical background subtraction (individual membership is only considered for spectroscopic sources, and only affects Fig. 2c in minor details). This CMD is obtained by subtracting, for each galaxy in the control (GOODS-S) field, an area-normalised fractional galaxy contribution to the closest galaxy in color-magnitude space in the ClJ1449 field (see e.g. van der Burg et al. 2016). All galaxies in the ClJ1449 field are shown (black/gray and colored symbols for the full-field and kpc CMD, respectively), but symbol size/color scales with their excess probability over the control field CMD. The excess probability222Being statistical, the excess probability in Fig. 2c obviously does not directly reflect cluster membership probability on a galaxy-by-galaxy basis. across the CMD of Fig. 2c is meant to represent the background-subtracted color-magnitude distribution of cluster galaxies in ClJ1449, as an independent confirmation of the color distribution based on individual membership shown in Fig. 2a.
As compared with clusters, or even with the massive cluster JKCS041 (Newman et al. 2014), the CMD of ClJ1449 shows a clearly less dominant, more scattered red galaxy population. Nonetheless, a first albeit still sparsely populated red sequence is found close to the expected location, confirming the presence of a characteristic population of red sources in the cluster core (G11, G13, S13), and further highlighting red-sequence outliers. As a reference, the red sequence predicted at z=2 by Kodama & Arimoto (1997, KA97) models is also shown. An estimate of the intrinsic m105-m140 scatter (restframe U-B) (determined as in Lidman et al. 2008, in our case affected by very poor statistics) of all core ( kpc) red members with m105-m1401.2 (regardless of their quiescent/SF nature, see Sec. 4), is ( if considering only core members consistent within 0.15 mag with the KA97 models). On the other hand, with the exception of ID 4 quiescent members lie on a tight sequence with (see Secs. 4, 5, see also e.g. Stanford et al. 2012).
Fig. 2b and 2d show, respectively, the color distribution of all galaxies in the ClJ1449 field (full field and kpc), and of cluster galaxies (statistically background subtracted as from Fig. 2c). Fig. 2b also shows for comparison the color distribution of all galaxies in the control field. Figures 2b and 2d are not affected by uncertainties in the individual membership determination, as they use the full galaxy sample or a statistically background-subtracted sample (as for Fig. 2c). They thus provide a further confirmation and quantification of the excess population of red sources in the cluster field shown in Fig. 2a.
Besides the very clear excess of red galaxies, Fig. 2 generally suggests that the “green valley” is still indeed an underdense region in the CMD of ClJ1449 over the full ( kpc) area probed, with the excess of red sources being located at markedly redder colors, thus constraining the relevance of the population transitioning from the “blue cloud” at bright magnitudes. On the other hand, although statistics are very poor, we note that virtually all green-valley sources likely belonging to the cluster are located within kpc from the cluster center.
4. The red population
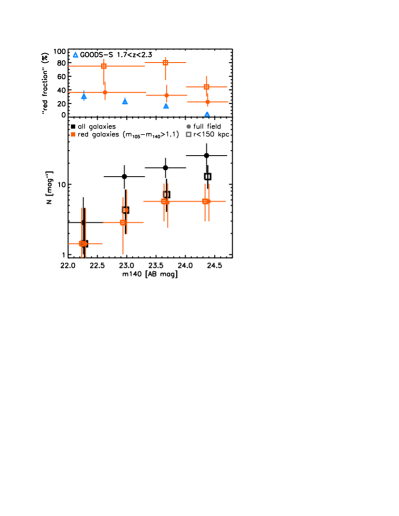
In order to further highlight the relevance of the red population in ClJ1449, Fig. 3 compares the F140W luminosity functions (LFs) of all and red galaxies in the ClJ1449 field, and in the central kpc area. The LF is essentially determined through statistical background subtraction using the GOODS-S control field (though we make use of spectroscopic and photometric redshift information to remove obvious interlopers, in particular at the bright end where statistics are very poor, e.g., Strazzullo et al. 2010). The “red” galaxy LF is obtained selecting galaxies with m105-m1401.1 and, here again, includes the full red population regardless of stellar population properties discussed below. Fig. 3 also shows the corresponding red fraction as a function of m140 magnitude, determined as the ratio of the red and the total LFs, and compared with the analogous red fraction for galaxies in the GOODS-S control field. Like Fig. 2, Fig. 3 shows again that the red population is enhanced only in the very central cluster region, the red fraction in the overall cluster virial volume being similar to the control field levels.
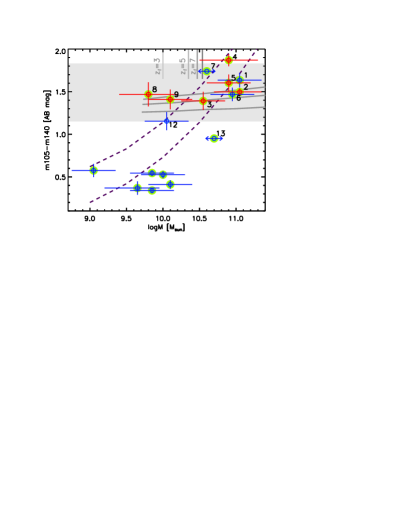
Finally, Fig. 4 shows the color-stellar mass diagram for cluster members, highlighting that - as expected - optically-blue galaxies are typically restricted to low stellar masses, while the high-mass population is typically dominated by red sources (old or dusty, see Sec. 4 below).
The actual nature of the red population shown in Fig. 2 deserves further discussion. Sources labeled as IDs 1, 4 and 5 in Fig. 2a are part of what G11 identified as a “proto-BCG” still in active formation (see Fig. 1, right). The high-resolution deep HST imaging, as well as ALMA observations (Strazzullo et al., in prep.), indeed reveal a complex structure with multiple components. According to photometric and spectroscopic analysis, S13 and G13 classified IDs 1 and 4 of this proto-BCG complex as (dusty) SF and quiescent, respectively; IDs 2, 3, 6, 8, and 9 were also classified as quiescent. The sample of “red sources” highlighted in Fig. 1 further includes four green-valley sources, IDs 10 to 13; based on photo–zs, IDs 10 and 11 are probably interlopers.
We note that IDs 7 and 13 are AGN hosts (G13) which may affect their colors and derived properties (together with significant neighbour contamination of ground-based and IRAC photometry for ID 7). Although we include them for completeness in the figures, a proper analysis of the nature of these two sources is postponed to future work and we thus do not consider them further in the following discussion.
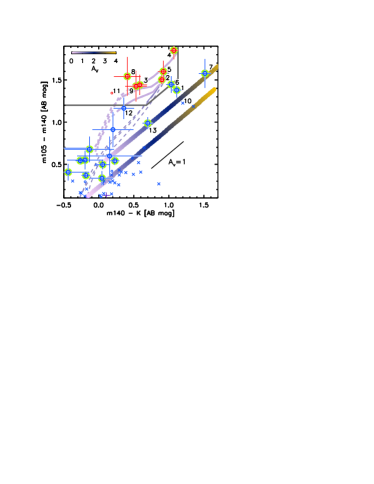
The new F105W imaging allows a further photometric classification of galaxy stellar populations, similar in principle to the UVJ or p/sBzK approaches (Williams et al. 2009; Daddi et al. 2004) aiming at a separation of quiescent and SF galaxies accounting for dust reddening, and independent of SED modeling (as we used in S13) which may be particularly affected by blending in the crowded cluster center when using imaging with poorer resolution. Fig. 5 shows the m140-K vs m105-m140 color-color plot for cluster members (1” diameter aperture colors)333Because of the combination with ground-based K-band imaging, this aperture is larger than the one used in Fig. 2. Although color gradients between these two apertures are generally small, there are few exceptions, notably IDs 1 and 7; given the complex surroundings of these sources this might be partly due to contamination by other sources/components..
We consider the position of cluster galaxies in this diagram to constrain the nature of their stellar populations. As an indicative reference of the location of SF populations in this diagram, we show the colors of two constant star formation rate (SFR) BC03 models at with ages 0.1 and 1 Gyr, attenuated according to Calzetti et al. (2000) with . The evolution of (dust free) models with (SSP) and 0.5 Gyr, and , is also shown, for ages up to the age of the Universe at . As Fig. 5 shows, this observed color combination still allows for the definition of a quiescent region with a boundary parallel to the reddening vector, enabling a classification of stellar populations only relying on observed magnitudes from imaging with relatively good resolution.
For the vast majority of sources, the quiescent/SF classification from Fig. 5 agrees with that UVJ/SED-based from S13. The notable exception relevant for this work is ID 6 (and partly ID13 with an uncertain classification in S13). In Fig. 5, IDs 1, 6 and 12 are formally in the SF region, although very close to the boundary line, thus their m105-m140-K classification may be deemed uncertain. However, the recently identified ALMA continuum and CO(4-3) emission from ID 6 supports its dusty SF nature. Concerning ID 1, as discussed in G11 Spitzer/MIPS 24m emission was observed close to the location of the proto-BCG. However, the ALMA-detected 870m continuum and CO(4-3) emission is clearly associated with a very red faint component south of the main bright sources discussed here, IDs 1, 4, 5, which are instead all below the 870m map level (0.2mJy, 40 M⊙/yr, e.g. Béthermin et al. 2012), as all other red and green valley sources discussed here besides ID 6. Given the estimated stellar masses and colors, this may suggest that most of the massive red sources IDs 1, 2, 3, 4, 5 are likely quiescent/suppressed-SF (at least with respect to the expected mass-SFR relation, e.g. Elbaz et al. 2011) rather than dusty massively SF galaxies. We recall nonetheless the significant uncertainties inherent to this kind of analysis; a more detailed discussion of the ALMA observations will be presented in Strazzullo et al., in preparation. For IDs 8, 9, 12, 13, given the expected stellar masses and SFRs, the available ALMA observations do not add significant constraints.
5. Conclusions
We use HST/WFC3 observations to further investigate the population of optically-red galaxies in the cluster ClJ1449 at z=2. This work highlights once more the presence of a numerically small but characteristic population of red galaxies concentrated within kpc from the cluster center. Many of these red sources lie along a “red sequence” which is close to passive evolution expectations at this redshift, however this sequence is significantly more scattered than in clusters (e.g. Mei et al. 2009; Foltz et al. 2015), notably with the presence of extremely red sources, and is partly contaminated by dusty SF galaxies. The red population in ClJ1449 is more sparse and scattered even as compared with some (rather exceptional) cluster at similar redshift (notably JKCS041 at , Newman et al. 2014), although we also note results from e.g. Hilton et al. (2010); Papovich et al. (2010); Stanford et al. (2012); Cerulo et al. (2016) and references therein on the marked increase of cluster red-sequence scatter at .
Even among the red galaxies that are deemed to be quiescent rather than dusty SF, two sources scatter above the KA07 red-sequence prediction (IDs 4 and 5), suggesting dust attenuation and/or supersolar metallicity (see Fig. 5), although we recall the especially crowded environment of these specific galaxies possibly affecting photometric accuracy. As a reference, the colors of ID 4 may be reproduced with a young (age0.5 to 1 Gyr) solar-metallicity BC03 SSP with , or possibly with a dust-free super-solar (Z=0.05) SSP with a .
Early and recent results on the investigation of optically red galaxies in dense environments at highlighted the - sometimes dominant - contribution of dusty, highly SF sources (e.g. Zirm et al. 2008; Wang et al. 2016). The analysis presented here, also with the support of recent ALMA observations, suggests that indeed ClJ1449 hosts in its very central region a mixture of quiescent and dusty SF galaxies, at the same time highlighting a population that is seemingly dominated in number by galaxies with suppressed star formation making for a first, still forming red-sequence seedling. In combination with previous work, this study underlines differences and similarities in galaxy population properties of cluster progenitors of different masses in a crucial redshift range, providing the picture of one of the most distant spectroscopically confirmed bona-fide cluster environments with an estimated mass placing it among the average progenitors of today’s clusters rather than exceptionally massive structures.
References
- Alberts et al. (2016) Alberts, S., Pope, A., Brodwin, M., et al. 2016, ApJ, 825, 72
- Andreon (2008) Andreon, S. 2008, MNRAS, 386, 1045
- Andreon et al. (2014) Andreon, S., Newman, A. B., Trinchieri, G., et al. 2014, A&A, 565, A120
- Béthermin et al. (2012) Béthermin, M., Daddi, E., Magdis, G., et al. 2012, ApJ, 757, L23
- Brodwin et al. (2013) Brodwin, M., Stanford, S. A., Gonzalez, A. H., et al. 2013, ApJ, 779, 138
- Calzetti et al. (2000) Calzetti, D., Armus, L., Bohlin, R. C., et al. 2000, ApJ, 533, 682
- Cameron et al. (2011) Cameron, E., Carollo, C. M., Oesch, P. A., et al. 2011, ApJ, 743, 146
- Cerulo et al. (2016) Cerulo, P., Couch, W. J., Lidman, C., et al. 2016, MNRAS, 457, 2209
- Cooke et al. (2016) Cooke, E. A., Hatch, N. A., Stern, D., et al. 2016, ApJ, 816, 83
- Daddi et al. (2004) Daddi, E., Cimatti, A., Renzini, A., et al. 2004, ApJ, 617, 746
- Elbaz et al. (2011) Elbaz, D., Dickinson, M., Hwang, H. S., et al. 2011, A&A, 533, A119
- Foltz et al. (2015) Foltz, R., Rettura, A., Wilson, G., et al. 2015, ApJ, 812, 138
- Gobat et al. (2011) Gobat, R., Daddi, E., Onodera, M., et al. 2011, A&A, 526, A133
- Gobat et al. (2008) Gobat, R., Rosati, P., Strazzullo, V., et al. 2008, A&A, 488, 853
- Gobat et al. (2013) Gobat, R., Strazzullo, V., Daddi, E., et al. 2013, ApJ, 776, 9
- Grogin et al. (2011) Grogin, N. A., Kocevski, D. D., Faber, S. M., et al. 2011, ApJS, 197, 35
- Guo et al. (2013) Guo, Y., Ferguson, H. C., Giavalisco, M., et al. 2013, ApJS, 207, 24
- Hayashi et al. (2011) Hayashi, M., Kodama, T., Koyama, Y., Tadaki, K.-I., & Tanaka, I. 2011, MNRAS, 415, 2670
- Hilton et al. (2010) Hilton, M., Lloyd-Davies, E., Stanford, S. A., et al. 2010, ApJ, 718, 133
- Hilton et al. (2009) Hilton, M., Stanford, S. A., Stott, J. P., et al. 2009, ApJ, 697, 436
- Kodama & Arimoto (1997) Kodama, T. & Arimoto, N. 1997, A&A, 320, 41
- Kodama et al. (2007) Kodama, T., Tanaka, I., Kajisawa, M., et al. 2007, MNRAS, 377, 1717
- Kurk et al. (2009) Kurk, J., Cimatti, A., Zamorani, G., et al. 2009, A&A, 504, 331
- Lemaux et al. (2012) Lemaux, B. C., Gal, R. R., Lubin, L. M., et al. 2012, ApJ, 745, 106
- Lidman et al. (2008) Lidman, C., Rosati, P., Tanaka, M., et al. 2008, A&A, 489, 981
- Mei et al. (2009) Mei, S., Holden, B. P., Blakeslee, J. P., et al. 2009, ApJ, 690, 42
- Newman et al. (2014) Newman, A. B., Ellis, R. S., Andreon, S., et al. 2014, ApJ, 788, 51
- Pannella et al. (2015) Pannella, M., Elbaz, D., Daddi, E., et al. 2015, ApJ, 807, 141
- Papovich et al. (2010) Papovich, C., Momcheva, I., Willmer, C. N. A., et al. 2010, ApJ, 716, 1503
- Rettura et al. (2010) Rettura, A., Rosati, P., Nonino, M., et al. 2010, ApJ, 709, 512
- Rudnick et al. (2012) Rudnick, G. H., Tran, K.-V., Papovich, C., Momcheva, I., & Willmer, C. 2012, ApJ, 755, 14
- Salpeter (1955) Salpeter, E. E. 1955, ApJ, 121, 161
- Santos et al. (2015) Santos, J. S., Altieri, B., Valtchanov, I., et al. 2015, MNRAS, 447, L65
- Schreiber et al. (2015) Schreiber, C., Pannella, M., Elbaz, D., et al. 2015, A&A, 575, A74
- Smail et al. (2014) Smail, I., Geach, J. E., Swinbank, A. M., et al. 2014, ApJ, 782, 19
- Snyder et al. (2012) Snyder, G. F., Brodwin, M., Mancone, C. M., et al. 2012, ApJ, 756, 114
- Spitler et al. (2012) Spitler, L. R., Labbé, I., Glazebrook, K., et al. 2012, ApJ, 748, L21
- Stanford et al. (2012) Stanford, S. A., Brodwin, M., Gonzalez, A. H., et al. 2012, ApJ, 753, 164
- Strazzullo et al. (2013) Strazzullo, V., Gobat, R., Daddi, E., et al. 2013, ApJ, 772, 118
- Strazzullo et al. (2010) Strazzullo, V., Rosati, P., Pannella, M., et al. 2010, A&A, 524, A17
- Tanaka et al. (2007) Tanaka, M., Kodama, T., Kajisawa, M., et al. 2007, MNRAS, 377, 1206
- Tanaka et al. (2013) Tanaka, M., Toft, S., Marchesini, D., et al. 2013, ApJ, 772, 113
- Tran et al. (2015) Tran, K.-V. H., Nanayakkara, T., Yuan, T., et al. 2015, ApJ, 811, 28
- Valentino et al. (2016) Valentino, F., Daddi, E., Finoguenov, A., et al. 2016, ApJ, 829, 53
- Valentino et al. (2015) Valentino, F., Daddi, E., Strazzullo, V., et al. 2015, ApJ, 801, 132
- van der Burg et al. (2016) van der Burg, R. F. J., Muzzin, A., & Hoekstra, H. 2016, A&A, 590, A20
- Wang et al. (2016) Wang, T., Elbaz, D., Daddi, E., et al. 2016, ApJ, 828, 56
- Webb et al. (2015) Webb, T., Noble, A., DeGroot, A., et al. 2015, ApJ, 809, 173
- Williams et al. (2009) Williams, R. J., Quadri, R. F., Franx, M., et al. 2009, ApJ, 691, 1879
- Zirm et al. (2008) Zirm, A. W., Stanford, S. A., Postman, M., et al. 2008, ApJ, 680, 224