Modulation of the superconducting critical temperature due to quantum confinement at the LaAlO3/SrTiO3 interface
Abstract
Superconductivity develops in bulk doped SrTiO3 and at the LaAlO3/SrTiO3 interface with a dome-shaped density dependence of the critical temperature , despite different dimensionalities and geometries. We propose that the dome of LaAlO3/SrTiO3 is a shape resonance due to quantum confinement of superconducting bulk SrTiO3. We substantiate this interpretation by comparing the exact solutions of a three-dimensional and quasi-two-dimensional two-band BCS gap equation. This comparison highlights the role of heavy bands for in both geometries. For bulk SrTiO3, we extract the density dependence of the pairing interaction from the fit to experimental data. We apply quantum confinement in a square potential well of finite depth and calculate in the confined configuration. We compare the calculated to transport experiments and provide an explanation as to why the optimal ’s are so close to each other in two-dimensional interfaces and the three-dimensional bulk material.
I Introduction
The discovery of superconductivity at the interface between LaAlO3 and SrTiO3 (LAO/STO) Reyren et al. (2007) has spurred fundamental questions regarding the nature of the superconductivity, in particular, the pairing mechanism. A phonon-mediated mechanism Klimin et al. (2014) has received experimental support Boschker et al. (2015), but unconventional scenarios have also been put forward Stephanos et al. (2011); Scheurer and Schmalian (2015). STO has a domelike dependence of on the electron density both in the three-dimensional (3D) bulk material Schooley et al. (1964); *Schooley-1965; *Koonce-1967; Lin et al. (2014) and in the interfaces Caviglia et al. (2008); Joshua et al. (2012); Bell et al. (2009); Bert et al. (2012), with approximately the same value of the maximum . Carriers are confined within a thickness of typically 10 nm at low temperature Reyren et al. (2007); Caviglia et al. (2008); Copie et al. (2009); Dubroka et al. (2010); Gariglio et al. (2015a), which causes quantum confinement to an effective two-dimensional electron liquid (2DEL). Hartree shifts in the shell affect the band structure Maniv et al. (2015), and Rashba coupling at the interface may mix singlet and triplet pairing channels Gor’kov and Rashba (2001); Scheurer and Schmalian (2015). The superfluid density in the 2DEL is much lower than the normal-state Hall density, Bert et al. (2012); Kirtley et al. (2012) suggesting that 2D fluctuations influence the superconducting properties Caviglia et al. (2008); Benfatto et al. (2009). Some experiments have reported evidence of magnetic order coexisting with, or phase segregated from, the superconducting phase Li et al. (2011); Bert et al. (2011); Dikin et al. (2011); Daptary et al. (2017). Disorder at the interface may also induce phase separation and percolation Caprara et al. (2012); *Caprara-2013.
In a broad perspective, the LAO/STO 2DEL may be regarded as an instance of a quasi-2D superconductor produced by the confinement of a 3D superconductor in a film geometry Bianconi et al. (2014). Quantum confinement is a well-known strategy for changing the , which has been continuously explored theoretically and experimentally since the sixties Thompson and Blatt (1963); [][; andreferencestherein.]Valentinis-2016b. The vertical localization of electronic states in the film changes the pairing strength, and the formation of subbands leads to oscillations of —often termed shape resonances—as a function of the confinement length and/or carrier density. In this context, the different behaviors in STO and LAO/STO do not rule out a common mechanism.
Here we propose an interpretation of the dome in LAO/STO as the result of a shape resonance triggered by the confinement of carriers at the STO surface. We support this scenario with a microscopic calculation reproducing both the STO and the LAO/STO superconducting domes with the same pairing model, taking into account measurements of the 2DEL thickness and confinement effects for the latter. According to the new interpretation, the differences between the two domes confirm the commonality of the pairing mechanism for the 2D and 3D cases. LAO/STO offers new opportunities to study shape resonances, thanks to a continuously tunable carrier density, in contrast to metallic thin films, whose thickness can only be changed in increments of 1 unit cell. Our modeling, furthermore, clarifies the roles of the STO light and heavy bands in LAO/STO superconductivity, showing that is controlled almost exclusively by the heavy one.
In order to describe the superconductivity of bulk STO, we first build in Sec. II a minimal microscopic model able to capture the density dependence of with a small number of parameters. In Sec. III, we discuss recent experimental data by some of us on the LAO/STO 2DEL thickness Gariglio et al. (2016). With these data at hand, we can deduce from the measured Hall 2D density an equivalent 3D density for the 2DEL. This allows us to confine the bulk model along one dimension, setting the carrier density to the equivalent 3D density of the 2DEL, and thus to obtain in Sec. IV a prediction for in the confined geometry, which we compare with the measurements at the LAO/STO interface. Our main results are interpreted and discussed in Sec. V; conclusions and perspectives are given in Sec. VI.
II Two-band model for bulk STO
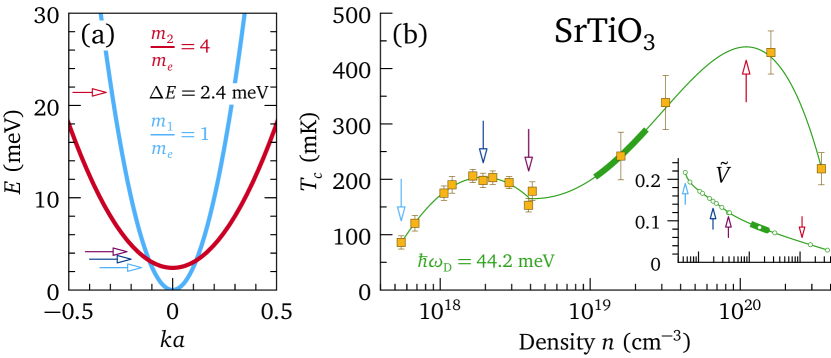
Focusing on the essential ingredients, we opt for two parabolic bands and a BCS pairing interaction to describe STO. The low-energy sector of the STO conduction band involves three bands of mostly Ti character, split by a crystal field and spin-orbit interaction van der Marel et al. (2011); Allen et al. (2013). We discard one band lying 30 meV above the other two and not occupied at the densities considered in this study. The bare masses of the remaining two bands and their splitting at the point are chosen such that the 2D density of states evaluated at with the tight-binding and parabolic dispersions agree best. We then renormalize both band masses by a factor of 2, representing the effect of electron-phonon coupling and the emergence of large polarons Eagles (1969); van Mechelen et al. (2008); *Devreese-2010. The resulting band structure is shown in Fig. 1(a), where the parameters are indicated as well. The pairing mechanism in STO is still debated Klimin et al. (2014); Edge et al. (2015). Standard phonon-mediated pairing is questioned because the low density of STO puts it in the antiadiabatic regime , where and are the Fermi and Debye energies, respectively. Leaving alone the origin of pairing, it is believed that STO is amenable to a BCS description with low coupling constants, of the order of 0.1–0.3 van der Marel et al. (2011); Allen et al. (2013). We adopt a local BCS interaction of strength with a dynamical cutoff meV, consistent with the Debye temperature of STO Ahrens et al. (2007). The interaction is the same in both bands and we neglect interband coupling, for simplicity. In this model, for independent of the density , the critical temperature can only increase with increasing Fernandes et al. (2013); Valentinis et al. (2016b), in contradiction with the observations Schooley et al. (1964); *Schooley-1965; Koonce et al. (1967); Lin et al. (2014). To explain the dome, must drop with increasing Lin et al. (2014). We fix the -dependent interaction such that the model reproduces the data from Ref. Lin et al., 2014. This data set is preferred because it covers a broad range of densities, but this choice does not affect any of our conclusions. The resulting interaction decreases monotonically with increasing as shown in the inset in Fig. 1(b). We interpolate this dependency to get a continuous parametrization . Figure 1(b) displays the data from Ref. Lin et al., 2014 on top of the continuous curve resulting from that interpolation. The calculation takes full account of the energy-dependent density of states, including the fact that , and uses the self-consistent chemical potential calculated at Valentinis et al. (2016b). With this parametrization the heavy band starts to be populated before the first maximum of the double dome, as shown by quantum oscillations Lin et al. (2014). A glimpse at the band structure and the value of reveals that the heavy band contributes to the pairing instability even when it is not populated (see arrows in Fig. 1).111In fact, the contribution of the heavy band is dominant: if the interaction is switched off in the light band, the calculated changes by less than a percent, while if the interaction in the heavy band is reduced by 20%, does not exceed 80 mK at any density.
III Experimental determination of the 2DEL thickness in LAO/STO
Our hypothesis is that the pairing strength at the LAO/STO interface follows the bulk interaction . The carrier density varies across the 2DEL, following the profile of the confinement potential, such that the pairing strength would be, strictly speaking, a function of the position. As the coherence length is large (50–100 nm) compared with the typical confinement length ( nm), which itself is only marginally larger than the Fermi wavelength Copie et al. (2009), we use an average associated with the average carrier density . The density integrated along the confinement direction, , is deduced from the Hall sheet conductance as in Ref. Caviglia et al., 2008. For an estimation of the effective 2DEL thickness , we resort to the analysis of the superconducting transitions measured in magnetic fields perpendicular and parallel to the interface Reyren et al. (2009). The samples were prepared by pulsed laser deposition Cancellieri et al. (2010). For the transport measurements in a dilution cryostat, field-effect devices were realized using the STO substrate as the gate dielectric and Hall bars were photolithographically defined. For each magnetic field, was defined as the midpoint of the transition: in this way the critical fields display a linear temperature behavior in the perpendicular orientation, while in the parallel orientation there is a square root temperature dependence. This confirms the 2D nature of the superconducting state across the whole phase diagram. The angular dependence of the critical fields allows us to determine the in-plane coherence length and the effective thickness of the superconducting 2DEL Gariglio et al. (2015b). From the perpendicular critical field , we extract , where is the flux quantum. Extrapolating to zero temperature we obtain , and using the experimental parallel critical field we arrive at the superconducting thickness . The in-plane coherence length remains larger than the superconducting thickness for all dopings Gariglio et al. (2015b, a), which is again consistent with the 2D character of the superconducting 2DEL.
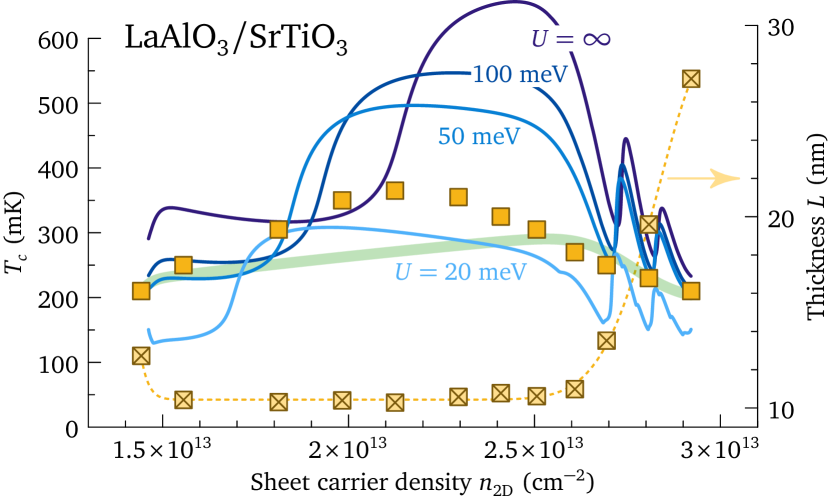
Figure 2 displays the thicknesses and critical temperatures measured as a function of the Hall density Gariglio et al. (2016). The dependence draws a dome with a maximum at 365 mK. The measured thickness is close to 10 nm except at densities above cm-2, where it increases steadily. Figure 1(b) shows that the field-effect doping at the interface explores a relatively narrow range of 3D densities (thick line) compared with the chemical doping. The sharp increase in from to nm between 2.5 and cm-2 is somewhat surprising, especially when contrasted with the density independence of at lower densities. The variation of stems from a reduction in by a factor of 3, while remains approximately constant. This suggests a qualitative change in the shape of the confining potential at high densities. However, extrinsic effects such as disorder that are unrelated to the 2DEL thickness could also contribute to the suppression of the parallel critical field. It should be noted that the effective thickness comes from a Ginzburg-Landau model with uniform order parameter in a deep square well Tinkham (1996). The solution of a more realistic description using a self-consistent potential well cannot be obtained in analytically closed form and is not pursued here for this reason.
IV Critical temperature of STO carriers confined in a square well
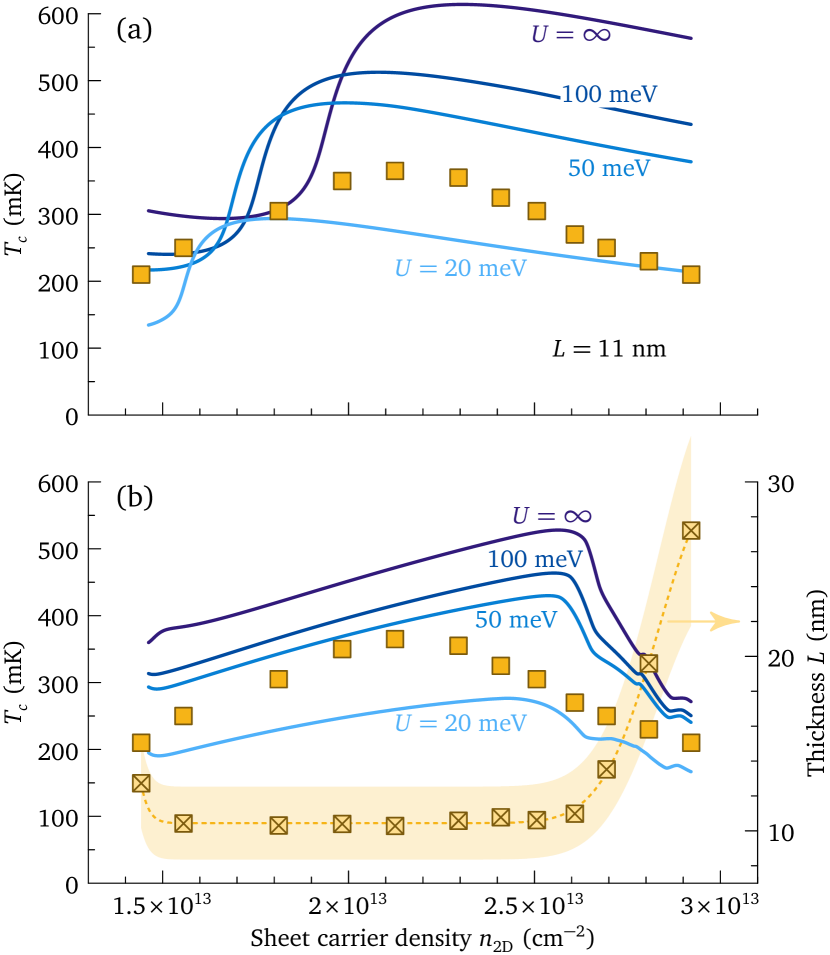
Knowing the equivalent 3D density for each measured , we can determine the pairing strength in the 2DEL. We model the confinement by taking the band structure of Fig. 1(a) into a square potential well of width and depth , following Ref. Valentinis et al., 2016a. This leads to the formation of 2D subbands at energies that depend on and . All subbands are coupled by the pairing interaction, which, furthermore, gets renormalized by the confinement and becomes a function of the band and subband indices via the bound wave functions. The potential well at the LAO/STO interface is certainly not square, but its precise shape is unknown. The formation of 2D bands, interpreted as confinement-induced subbands, is observed experimentally Ben Shalom et al. (2010); Fête et al. (2014); Gariglio et al. (2015a), but their occupations and energies are uncertain, preventing us from reconstructing a more realistic potential. We do not expect qualitative changes in our conclusions upon going from a square to a triangular or self-consistent confinement potential. The square well, moreover, has the advantage that the pairing matrix elements are known analytically Valentinis et al. (2016a). The only unknown parameter of our model is therefore , whose order of magnitude is estimated from first-principles calculations to be a few tens of meV Stengel (2011). Figure 2 compares calculated in the square well for various ’s with the measured of the 2DEL. The calculation yields critical temperatures similar to those measured and a dome-shaped density dependence for all . This is our main result: localizing STO carriers at a density cm-3 into a -nm-thick layer leads, owing to quantum confinement effects, to a dome in as a function of the sheet carrier density between and cm-2, with a maximum similar to the maximum of bulk STO. As becomes large, for , the calculated approaches the 3D value (green line) with rapid oscillations for all ’s. We propose below tentative explanations for why such oscillations are not seen experimentally. The measured is also very close to the 3D value in this regime, where drops because actually decreases with increasing . In the range where nm, the 3D increases monotonically as in Fig. 1, and one notices a density-dependent critical , above which the at the interface is higher than in the bulk Valentinis et al. (2016a). By contrast, in that range the quasi-2D drops after the broad maximum because of the decreasing density-dependent interaction.
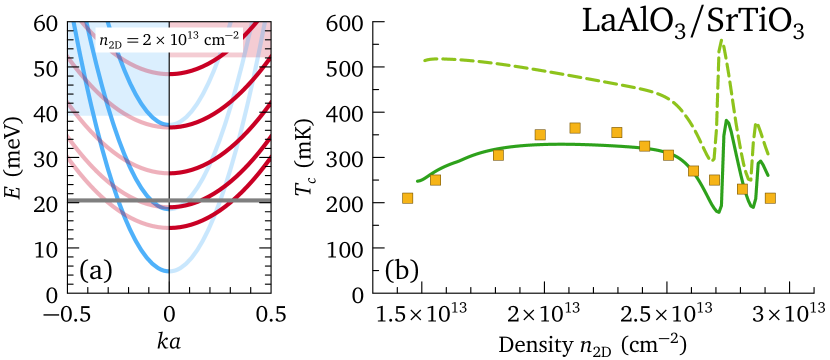
We now refine our model to achieve semiquantitative agreement with the experiment. First, remembering that we mimic a quasitriangular well with a square one, and also because a systematic error in the experimental determination of cannot be excluded, we replace the measured 2DEL thickness with when comparing model and experiment. Second, an increase in the splitting is expected at the interface, since both strain and electric field contribute directly to the fourfold crystal field. A modified screening also modifies the Hartree shifts of the bands Maniv et al. (2015). We adopt the simple dependence with the fit parameter , which ensures that the bulk STO splitting is recovered for a thick well. Finally, the confinement potential is in principle linked with and via Poisson’s equation. The simplest relation results from dimensional analysis as . The model parameters are adjusted to get the best fit displayed in Fig. 3(b), with , nm, and . The result is expected, because a square well of width hosts an electron gas thicker than a triangular well of the same width. Moreover the effective thickness nm matches the value measured by AFM Basletic et al. (2008). Figure 3(a) shows the subband structure with a splitting five times larger than the bulk splitting at a density of cm-2. We find that two light and two heavy subbands are partly occupied. Photoemission measurements have reported two light subbands lying below the lowest heavy band Cancellieri et al. (2014); our model reproduces this configuration at densities higher than cm-2. The Hall-coefficient nonlinearity observed in Ref. Joshua et al., 2012 at cm-2 corresponds in our model to entering the second heavy subband. Finally, the fitted dielectric constant is consistent with the high polarizability of STO: it agrees well with the value obtained from the low-temperature field-dependent dielectric function of STO, given approximately by with and kV/m Christen et al. (1994); Copie et al. (2009), if we substitute for the order of magnitude of the interface electric field, e.g., mV/nm at .
Although we have until now compared the critical temperature with the mean-field from the calculation, in Fig. 3(b) we show that the model is not inconsistent with the pseudogap scenario suggested by tunneling experiments Richter et al. (2013), in which the mean-field continues to increase as the density is reduced, while the critical temperature is suppressed by 2D fluctuations.
V Interpretation and discussion
In a thin-film geometry, the critical temperature of a weak-coupling BCS superconductor is a continuous oscillating function of film thickness and electron density Valentinis et al. (2016a). Pronounced oscillations due to the rapid change in are visible in Figs. 2 and 3(b), but not resolved in the experiment. Note that the detailed oscillating behavior is sensitive to the shape of the potential well, but the very existence of these oscillations is not, as they simply reflect the presence of subbands. The model involves three types of singularities, which leave specific signatures in : a subband lying above the chemical potential begins contributing to ; the minimum of a subband lies exactly below the chemical potential; and a new subband gets localized in the well. This leads to a quite complex landscape as a function of and , further complicated by the presence of two types of subbands associated with the bulk light and heavy bands. The maxima do not coincide with any particular singularity of the model but occur approximately when the chemical potential crosses the bottom of a subband. Let us first discuss this rich landscape, before turning to the absence of sharp oscillations in the experiment.
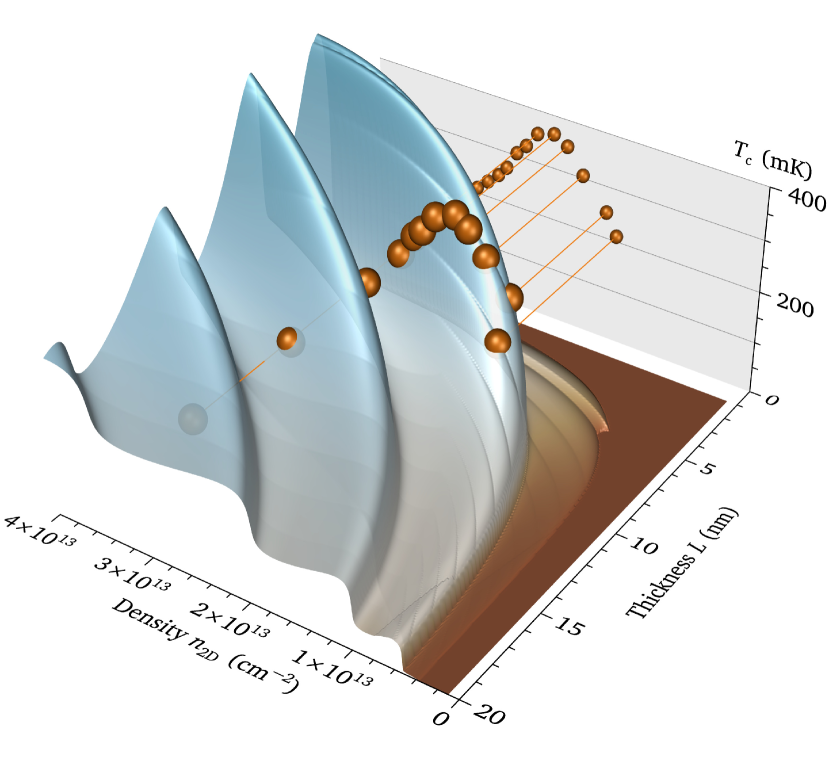
Using our square-well model, we plot in Fig. 4 the evolution of as a function of both and in the domain of thicknesses and densities relevant for the 2DEL. The experimental data are shown for comparison at the rescaled thickness . To describe the features we start at 5-nm thickness and follow the doping from upwards. At the lowest doping is exponentially small and reaches a first low- step near , before rising steeply to 400 mK for doping of the order of . At this thickness and for the doping range displayed in the figure, superconductivity is entirely in the two heavy subbands [the two lowest red curves in Fig. 3(a)]. The low- stage corresponds to the first heavy subband, with a suppressed by a shallow confinement potential (see Fig. 2 for the effect of on ) Valentinis et al. (2016a). For a fixed 2D carrier density, the number of occupied subbands varies with the layer thickness as . Since passes through a maximum when a new heavy subband becomes occupied, the effect of increasing the thickness results in a succession of maxima; the amplitude of these oscillations decays rapidly with increasing thickness since the layer becomes more and more like a 3D bulk sample with a carrier density approaching according to . The location of maxima is given approximately by with integer . The scars running at a small angle with respect to the first maximum are slope changes of occurring when a new heavy subband gets bound in the well as increases, leading to a slight enhancement. The very faint lines almost parallel to the density axis indicate that a new heavy subband enters the pairing window at . These features reflect that in our calculation we use a BCS-type model interaction with a sharp cutoff at . Finally, crossing the third light subband gives another faint structure crossing the previous ones and ending at zero density near nm; other structures associated with the light band are too weak to be visible. Moving up in density for nm, becomes distinguishable from for , and rises in a succession of steps, each corresponding to a new heavy subband becoming occupied. In the limit of infinite thickness the 3D situation depicted in Fig. 1 is ultimately obtained. The figure illustrates that many combinations of thickness and doping parameters can result in a domelike doping or thickness dependence of , however, the maximal value of itself is never strongly different from observed in optimally doped bulk STO.
We believe that this theoretical observation provides the main clue as to why is so similar in bulk and interface superconductivity: the pairing potential is basically the same in all cases. Tuning of the density of states by 2D confinement allows the effective pairing interaction to be varied to a certain extent, but its main effect is to define the subband structure. Optimal is found for low densities, which holds true in bulk 3D and quasi-2D alike, thus leading to very similar values of the optimal in 2D and 3D systems.
As Fig. 4 clearly demonstrates, the oscillations of for in Fig. 3(b) arise due to the abrupt increase in the well thickness used in the calculation, in order to follow the trend indicated by the critical field analysis. It is possible that the variation of the measured superconducting thickness from 10 to 30 nm results less from an actual change in the charge-distribution thickness than from subtle changes in its shape, e.g., the formation of long tails in STO with a very low density. Figure 5(a) shows that there is no oscillation of the calculated on the overdoped side of the dome if the square-well width stays at a constant value for all densities. We have also examined a scenario where the oscillations are washed out by inhomogeneities. A glimpse at Fig. 4 shows that thickness inhomogeneities are much more effective at suppressing the oscillations than density inhomogeneities. In Fig. 5(b), we show curves obtained by averaging over a range of thicknesses extending around the measured superconducting thickness, consistent with the estimated experimental uncertainty Reyren et al. (2009): this is sufficient to almost completely remove oscillations on the overdoped side. The various simulations displayed in Fig. 5 emphasize that modifications of the model that are able to remove the rapid oscillations of on the overdoped side do not remove the broad maximum between and cm-2, strengthening our claim that the observed dome may be a shape resonance. In order to gain further insight, one would need to calculate in a triangular or self-consistent quantum well. One difficulty with such a calculation is computing the matrix elements for pairing of the various quantum-well eigenstates—to which is exponentially sensitive—with a sufficient accuracy. The square well is, to our knowledge, the only case where these matrix elements are known analytically Valentinis et al. (2016a). The effect of disorder, also expected to smoothen the landscape, should also be investigated.
VI Conclusion
In summary, we have explored the hypothesis that the pairing potential responsible for superconductivity is the same in 2D interfaces and 3D bulk SrTiO3. We showed that the superconducting dome in the 2D material corresponds to a much narrower effective doping range than in the 3D material, and the optimal in this case coincides with a shape resonance due to the onset of occupation of one of the subbands created by the 3D confining potential. We have shown that the optimal should be very similar in the 2D and 3D cases. A prospect for optimization of is offered by tuning of the confinement potential , which in principle allows to be increased by a significant factor, and by controlled tuning of the thickness parameter on the 1-nm scale.
Acknowledgements.
This work was supported by the Swiss National Science Foundation through Grants No. 200021-153405 and No. 200021-162628.References
- Reyren et al. (2007) N. Reyren, S. Thiel, A. D. Caviglia, L. F. Kourkoutis, G. Hammerl, C. Richter, C. W. Schneider, T. Kopp, A.-S. Rüetschi, D. Jaccard, M. Gabay, D. A. Muller, J.-M. Triscone, and J. Mannhart, Science 317, 1196 (2007).
- Klimin et al. (2014) S. N. Klimin, J. Tempere, J. T. Devreese, and D. van der Marel, Phys. Rev. B 89, 184514 (2014).
- Boschker et al. (2015) H. Boschker, C. Richter, E. Fillis-Tsirakis, C. W. Schneider, and J. Mannhart, Sci. Rep. 5, 12309 (2015).
- Stephanos et al. (2011) C. Stephanos, T. Kopp, J. Mannhart, and P. J. Hirschfeld, Phys. Rev. B 84, 100510 (2011).
- Scheurer and Schmalian (2015) M. S. Scheurer and J. Schmalian, Nat. Comm. 6, 6005 (2015).
- Schooley et al. (1964) J. F. Schooley, W. R. Hosler, and M. L. Cohen, Phys. Rev. Lett. 12, 474 (1964).
- Schooley et al. (1965) J. Schooley, W. Hosler, E. Ambler, J. Becker, M. Cohen, and C. Koonce, Phys. Rev. Lett. 14, 305 (1965).
- Koonce et al. (1967) C. S. Koonce, M. L. Cohen, J. F. Schooley, W. R. Hosler, and E. R. Pfeiffer, Phys. Rev. 163, 380 (1967).
- Lin et al. (2014) X. Lin, G. Bridoux, A. Gourgout, G. Seyfarth, S. Krämer, M. Nardone, B. Fauqué, and K. Behnia, Phys. Rev. Lett. 112, 207002 (2014).
- Caviglia et al. (2008) A. D. Caviglia, S. Gariglio, N. Reyren, D. Jaccard, T. Schneider, M. Gabay, S. Thiel, G. Hammerl, J. Mannhart, and J.-M. Triscone, Nature 456, 624 (2008).
- Joshua et al. (2012) A. Joshua, S. Pecker, J. Ruhman, E. Altman, and S. Ilani, Nat. Comm. 3, 1129 (2012).
- Bell et al. (2009) C. Bell, S. Harashima, Y. Kozuka, M. Kim, B. G. Kim, Y. Hikita, and H. Y. Hwang, Phys. Rev. Lett. 103, 226802 (2009).
- Bert et al. (2012) J. A. Bert, K. C. Nowack, B. Kalisky, H. Noad, J. R. Kirtley, C. Bell, H. K. Sato, M. Hosoda, Y. Hikita, H. Y. Hwang, and K. A. Moler, Phys. Rev. B 86, 060503 (2012).
- Copie et al. (2009) O. Copie, V. Garcia, C. Bödefeld, C. Carrétéro, M. Bibes, G. Herranz, E. Jacquet, J.-L. Maurice, B. Vinter, S. Fusil, K. Bouzehouane, H. Jaffrès, and A. Barthélémy, Phys. Rev. Lett. 102, 216804 (2009).
- Dubroka et al. (2010) A. Dubroka, M. Rössle, K. W. Kim, V. K. Malik, L. Schultz, S. Thiel, C. W. Schneider, J. Mannhart, G. Herranz, O. Copie, M. Bibes, A. Barthélémy, and C. Bernhard, Phys. Rev. Lett. 104, 156807 (2010).
- Gariglio et al. (2015a) S. Gariglio, A. Fête, and J.-M. Triscone, J. Phys.: Condens. Mat. 27, 283201 (2015a).
- Maniv et al. (2015) E. Maniv, M. Ben Shalom, A. Ron, M. Mograbi, A. Palevski, M. Goldstein, and Y. Dagan, Nat. Comm. 6, 8239 (2015).
- Gor’kov and Rashba (2001) L. P. Gor’kov and E. I. Rashba, Phys. Rev. Lett. 87, 037004 (2001).
- Kirtley et al. (2012) J. R. Kirtley, B. Kalisky, J. A. Bert, C. Bell, M. Kim, Y. Hikita, H. Y. Hwang, J. H. Ngai, Y. Segal, F. J. Walker, C. H. Ahn, and K. A. Moler, Phys. Rev. B 85, 224518 (2012).
- Benfatto et al. (2009) L. Benfatto, C. Castellani, and T. Giamarchi, Phys. Rev. B 80, 214506 (2009).
- Li et al. (2011) L. Li, C. Richter, J. Mannhart, and R. Ashoori, Nature Physics 7, 762 (2011).
- Bert et al. (2011) J. A. Bert, B. Kalisky, C. Bell, M. Kim, Y. Hikita, H. Y. Hwang, and K. A. Moler, Nature Physics 7, 767 (2011).
- Dikin et al. (2011) D. A. Dikin, M. Mehta, C. W. Bark, C. M. Folkman, C. B. Eom, and V. Chandrasekhar, Phys. Rev. Lett. 107, 056802 (2011).
- Daptary et al. (2017) G. N. Daptary, S. Kumar, A. Bid, P. Kumar, A. Dogra, R. C. Budhani, D. Kumar, N. Mohanta, and A. Taraphder, Phys. Rev. B 95, 174502 (2017).
- Caprara et al. (2012) S. Caprara, F. Peronaci, and M. Grilli, Phys. Rev. Lett. 109, 196401 (2012).
- Caprara et al. (2013) S. Caprara, J. Biscaras, N. Bergeal, D. Bucheli, S. Hurand, C. Feuillet-Palma, A. Rastogi, R. C. Budhani, J. Lesueur, and M. Grilli, Phys. Rev. B 88, 020504 (2013).
- Bianconi et al. (2014) A. Bianconi, D. Innocenti, A. Valletta, and A. Perali, J. Phys.: Conf. Ser. 529, 012007 (2014).
- Thompson and Blatt (1963) C. J. Thompson and J. M. Blatt, Phys. Lett. 5, 6 (1963).
- Valentinis et al. (2016a) D. Valentinis, D. van der Marel, and C. Berthod, Phys. Rev. B 94, 054516 (2016a).
- Gariglio et al. (2016) S. Gariglio, M. Gabay, and J.-M. Triscone, APL Mater. 4, 060701 (2016).
- van der Marel et al. (2011) D. van der Marel, J. L. M. van Mechelen, and I. I. Mazin, Phys. Rev. B 84, 205111 (2011).
- Allen et al. (2013) S. J. Allen, B. Jalan, S. Lee, D. G. Ouellette, G. Khalsa, J. Jaroszynski, S. Stemmer, and A. H. MacDonald, Phys. Rev. B 88, 045114 (2013).
- Eagles (1969) D. M. Eagles, Phys. Rev. 181, 1278 (1969).
- van Mechelen et al. (2008) J. L. M. van Mechelen, D. van der Marel, C. Grimaldi, A. B. Kuzmenko, N. P. Armitage, N. Reyren, H. Hagemann, and I. I. Mazin, Phys. Rev. Lett. 100, 226403 (2008).
- Devreese et al. (2010) J. T. Devreese, S. N. Klimin, J. L. M. van Mechelen, and D. van der Marel, Phys. Rev. B 81, 125119 (2010).
- Edge et al. (2015) J. M. Edge, Y. Kedem, U. Aschauer, N. A. Spaldin, and A. V. Balatsky, Phys. Rev. Lett. 115, 247002 (2015).
- Ahrens et al. (2007) M. Ahrens, R. Merkle, B. Rahmati, and J. Maier, Physica B 393, 239 (2007).
- Fernandes et al. (2013) R. M. Fernandes, J. T. Haraldsen, P. Wölfle, and A. V. Balatsky, Phys. Rev. B 87, 014510 (2013).
- Valentinis et al. (2016b) D. Valentinis, D. van der Marel, and C. Berthod, Phys. Rev. B 94, 024511 (2016b).
- Note (1) In fact, the contribution of the heavy band is dominant: if the interaction is switched off in the light band the calculated changes by less than a percent, while if the interaction in the heavy band is reduced by 20%, does not exceed 80 mK at all densities.
- Reyren et al. (2009) N. Reyren, S. Gariglio, A. D. Caviglia, D. Jaccard, T. Schneider, and J.-M. Triscone, Appl. Phys. Lett. 94, 112506 (2009).
- Cancellieri et al. (2010) C. Cancellieri, R. Reyren, S. Gariglio, A. D. Caviglia, A. Fête, and J.-M. Triscone, Europhys. Lett. 91, 17004 (2010).
- Gariglio et al. (2015b) S. Gariglio, M. Gabay, J. Mannhart, and J.-M. Triscone, Physica C 514, 189 (2015b).
- Tinkham (1996) M. Tinkham, Introduction to Superconductivity (McGraw-Hill, New York, 1996).
- Ben Shalom et al. (2010) M. Ben Shalom, A. Ron, A. Palevski, and Y. Dagan, Phys. Rev. Lett. 105, 206401 (2010).
- Fête et al. (2014) A. Fête, S. Gariglio, C. Berthod, D. Li, D. Stornaiuolo, M. Gabay, and J.-M. Triscone, New J. Phys. 16, 112002 (2014).
- Stengel (2011) M. Stengel, Phys. Rev. Lett. 106, 136803 (2011).
- Basletic et al. (2008) M. Basletic, J. L. Maurice, C. Carretero, G. Herranz, O. Copie, M. Bibes, E. Jacquet, K. Bouzehouane, S. Fusil, and A. Barthelemy, Nat. Mater. 7, 621 (2008).
- Cancellieri et al. (2014) C. Cancellieri, M. L. Reinle-Schmitt, M. Kobayashi, V. N. Strocov, P. R. Willmott, D. Fontaine, P. Ghosez, A. Filippetti, P. Delugas, and V. Fiorentini, Phys. Rev. B 89, 121412 (2014).
- Christen et al. (1994) H.-M. Christen, J. Mannhart, E. J. Williams, and C. Gerber, Phys. Rev. B 49, 12095 (1994).
- Richter et al. (2013) C. Richter, H. Boschker, W. Dietsche, E. Fillis-Tsirakis, R. Jany, F. Loder, L. F. Kourkoutis, D. a. Muller, J. R. Kirtley, C. W. Schneider, and J. Mannhart, Nature 502, 528 (2013).