The Pan-Pacific Planet Search VI: Giant planets orbiting HD 86950 and HD 222076
Abstract
We report the detection of two new planets orbiting the K giants HD 86950 and HD 222076, based on precise radial velocities obtained with three instruments: AAT/UCLES, FEROS, and CHIRON. HD 86950b has a period of 127057 days at 0.08 AU, and m sin 0.7 . HD 222076b has 19 days at 0.03 AU, and m sin 0.11 . These two giant planets are typical of the population of planets known to orbit evolved stars. In addition, we find a high-amplitude periodic velocity signal (50 m s-1) in HD 29399, and show that it is due to stellar variability rather than Keplerian reflex motion. We also investigate the relation between planet occurrence and host-star metallicity for the 164-star Pan-Pacific Planet Search sample of evolved stars. In spite of the small sample of PPPS detections, we confirm the trend of increasing planet occurrence as a function of metallicity found by other studies of planets orbiting evolved stars.
1 Introduction
Nearly all our knowledge of planets orbiting stars more massive than the Sun comes from Doppler surveys targeting these stars after they have evolved off the main sequence. Subgiants and first-ascent giants are suitable radial velocity targets because their surface gravities remain high enough (log 3) to avoid the large-amplitude pulsations common in red giants (Hekker et al., 2008). Many groups have been conducting precise radial velocity surveys of these stars, with 1000 total targets and 10-15 years of observations (e.g. Sato et al., 2005; Johnson et al., 2006; Reffert et al., 2015).
The Pan-Pacific Planet Search (PPPS - Wittenmyer et al. 2011b) operated on the 3.9m Anglo-Australian Telescope (AAT) between 2009 and 2015, surveying 164 southern giant stars in search of planets as a southern extension of the Northern “retired A stars” programme (Johnson et al., 2006). Since the conclusion of AAT observations in 2014, we have published a series of planet discoveries combining PPPS observations with data from the Okayama planet search (Sato et al., 2013, 2016) and the Chile-based EXPRESS survey, with which we share 37 targets (Wittenmyer et al., 2015, 2016a, 2016b; Jones et al., 2016).
We have secured enough detections from the PPPS sample to make quantitative statements about the occurrence rate of giant planets orbiting evolved stars. For dwarf stars, the metallicity [Fe/H] is now well-known to be positively correlated with the probablity of hosting a giant planet (e.g. Gonzalez, 1997; Santos et al., 2001; Fischer & Valenti, 2005). This is a consequence of the core-accretion model of planet formation, wherein metal-rich disks are more efficient at forming cores due to their enhanced surface density of solids (Pollack et al., 1996).
For giant stars, however, there remains disagreement as to the presence of such a planet-metallicity correlation. Hekker & Meléndez (2007) found that planet-hosting giants had metallicities 0.130.03 dex higher than the overall sample of 380 G and K giants. Their conclusion was bolstered by a subsequent analysis of the same sample with a further seven years of observational data (Reffert et al., 2015). But Takeda et al. (2008) found no difference in the metallicities of planet hosts versus non-hosts in their 322-star Okayama Planet Search sample. A preliminary analysis of the Penn State-Torun Planet Search sample by Zieliński et al. (2010) hinted at an anticorrelation, with the metallicities of RV-variable giant stars 0.150.06 dex lower than the RV-stable stars. Maldonado et al. (2013) and Mortier et al. (2013) analysed large samples of giant stars, derived stellar parameters in a homogeneous manner, and found no significant metallicity differences between stars hosting planets and those not. More recently, however, Jones et al. (2016) presented an analysis of 166 giant stars and found a distinct peak in planet occurrence at [Fe/H]. Clearly, the issue is far from settled.
In this paper, we present two new giant planets from the PPPS sample, in conjunction with data from the EXPRESS survey (Jones et al., 2011). Section 2 briefly describes the observational data and host star properties. Section 3 gives the results of the orbit fitting and describes the vetting process, and Section 4 places these planetary systems in context and discusses the planet-metallicity correlation within the PPPS sample.
2 Observations and Stellar Properties
Observations have been obtained with three instruments in two parallel planet-search efforts using the UCLES spectrograph (Diego et al., 1990) on the AAT, the CHIRON spectrograph (Tokovinin et al., 2013) on the 1.5m telescope at CTIO, and the FEROS spectrograph on the on the 2.2m telescope at La Silla (Kaufer et al., 1999).
UCLES delivers a resolution of /45,000 with a 1 arcsecond slit, on which an iodine cell imprints a dense forest of narrow absorption lines used to calibrate the instrumental point-spread function is calibrated (, 1995; Butler et al., 1996). FEROS on the 2.2m telescope at La Silla has a resolving power of 48,000, and uses a ThArNe lamp for precise wavelength calibration. The instrument is equipped with a simultaneous calibration fibre which is used to correct the night spectral drift. The FEROS radial velocities were computed using the simultaneous calibration method (Baranne et al., 1996), using an improved reduction code presented in Jones et al. (2016; submitted). CHIRON is fed by a single fibre and an image slicer, delivering high resolution (R 80,000) and higher efficiency than the slit and narrow slit modes, also available. The CHIRON echelle spectra are comprised of 71 orders covering a wavelength range between 4100-8800 Å. The spectrograph is also equipped with an iodine cell, which superimposes a rich absorption spectrum in 22 different orders covering between 5000-6200 Å. The radial velocities are computed with the iodine cell technique (Butler et al., 1996), following the newest reduction code described in Jones et al. (2016; submitted). A summary of the observations is given in Table 1, and the velocities from UCLES, FEROS, and CHIRON are given in Tables 2-4.
Stellar properties were derived from iodine-free template UCLES spectra with as described fully in Wittenmyer et al. (2016d). In brief, spectroscopic stellar parameters were determined via a standard 1D, local thermodynamic equilibrium (LTE) abundance analysis using the 2013 version of MOOG (Sneden, 1973) with the ODFNEW grid of Kurucz ATLAS9 model atmospheres (Castelli & Kurucz, 2003). Complete stellar parameters from Wittenmyer et al. (2016d) and other literature sources are given in Table 5.
3 Orbit Fitting and Companion Parameters
Although the data for these stars are sparse and poorly sampled, inspection suggested the presence of velocity signals, belied by the higher than usual scatter. Following a well-trodden path (e.g. Tinney et al., 2011; Wittenmyer et al., 2015, 2016a), we first used a genetic algorithm to search a wide range of orbital periods, running for 10,000 iterations (about possible configurations). The period ranges were chosen based on visual inspection of the velocity data and are as follows: HD 29399 – [700-1100d]; HD 86950 – [1100-1400d]; HD 222076 – [800-1100d]. In all cases, convergence occurred rapidly, a hallmark of a genuine signal. Again as in our previous work, we then used the best solution from the genetic algorithm as a starting point for fitting with a Keplerian model in the Systemic Console version 2.1730 (Meschiari et al., 2009). For all orbit fitting, 7 m s-1 of jitter has been added in quadrature to the internal instrumental uncertainties of each data set. This estimate is derived from the velocity scatter of 37 stable stars in the PPPS as first described in Wittenmyer et al. (2016b). Finally, we estimated the parameter uncertainties using the bootstrap routine within Systemic on 10,000 synthetic data set realisations. The results are given in Table 6.
3.1 HD 29399: A false positive
We find that the velocities for HD 29399 can be fit with a planet having 15 days and 34 m s-1; the large uncertainty can be attributed to phase gaps which allow for a family of high-eccentricity solutions. As in our previous work, we checked the All-Sky Automated Survey (ASAS) band photometric data (Pojmanski & Maciejewski, 2004) for variability due to intrinsic stellar processes. We analysed a total of 984 epochs spanning 8.36 years, with a mean value of 6.070.32 mag. This scatter is an order of magnitude larger than that found for previously confirmed planet hosts from the PPPS (Wittenmyer et al., 2015, 2016b). The generalised Lomb-Scargle periodogram of this photometry (Zechmeister & Kürster, 2009) is shown in Figure 1, with the period of the candidate planet marked as a vertical dashed line. There is an extremely significant periodicity squarely at the 765 day period of our radial velocities. Given this evidence and the large photometric variability, we must conclude that the 50 m s-1 signal in the radial velocities is intrinsic to the star and not due to an orbiting planet. While stellar rotation is frequently the culprit in radial velocity false positives (e.g. Robertson et al., 2015; Rajpaul et al., 2016; Johnson et al., 2016), it is extremely unlikely in the case of HD 29399. The projected rotational velocity determined by De Medeiros et al. (2014) is less than 1.2 km s-1; using the stellar radius of 4 in Table 5, this gives a rotation period of 169 days. Of course, since the measured v sin is a lower bound, it remains possible that the true rotational velocity is smaller, arising from a nearly pole-on orientation. However, such an orientation would require an unreasonably high spot coverage to produce the observed variations in the radial velocities. In Section 4.1, we note that HD 29399 may host a debris disk; one might imagine quasi-periodic transits by debris (e.g. Vanderburg et al., 2015; Croll et al., 2015; Rappaport et al., 2016) to cause the photometric and radial velocity variations much as starspots would. However, we show in Section 4.1 that the required debris is best modelled at 1500 K, and hence must orbit far too close to the star to produce a 765-day period by Keplerian orbital motion. Indeed, for such a long periodicity, the most likely source is a stellar magnetic activity cycle. In Section 3.3, we give further evidence via an analysis of the H feature.
3.2 Single planets orbiting HD 86950 and HD 222076
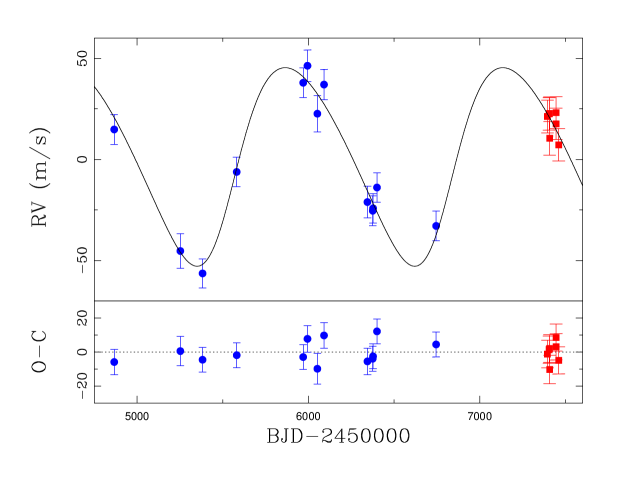
For HD 86950, we find a clear signal with 57 days and 12 m s-1, corresponding to a planet with m sin of 3.60.7 adopting a host star mass of 1.66 . The data and model fit are shown in Figure 2. Examination of 8.9 years (515 epochs) of ASAS photometry shows no periodicities of significance near the planet’s orbital period (Figure 3). The ASAS band photometry has a mean value of 7.470.02 mag.
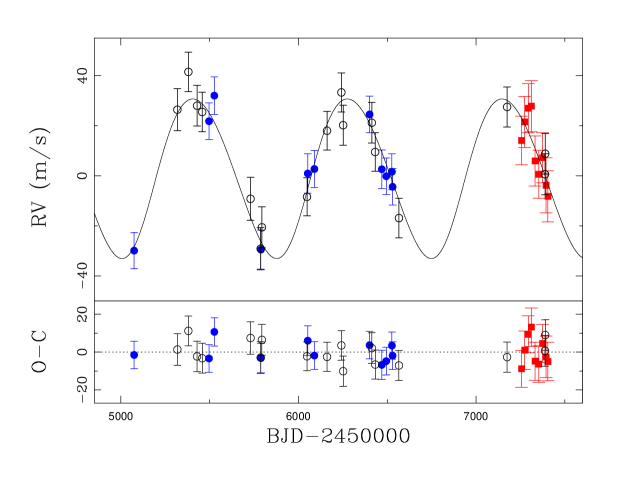
For HD 222076, all three instruments clearly reveal a planet with 19 days and m sin 0.11 assuming a host star mass of 1.07 (Wittenmyer et al., 2016d). The orbit is nearly circular, and this fit has residuals of 5.9 m s-1 (Figure 4). Again, the ASAS photometry reveals no significant periodicities near the planet’s orbital period (Figure 5). The ASAS band photometry has a mean value of 7.460.02 mag. For this star, we have 5.67 years of FEROS spectra, uncontaminated by iodine, from which we can derive several activity indices (bisector velocity span, CCF FWHM, and S-index). None of these indicators (Table 7) show any periodicities or correlations with the radial velocities. We are thus confident that the observed velocity variations are due to an orbiting planet.
3.3 H-alpha activity index
In light of recent debate over the detection of planet-induced stellar reflex motion amidst the confounding effect of stellar activity (e.g. Robertson et al., 2014; Anglada-Escudé & Tuomi, 2015; Fischer et al., 2016), we discuss in this section the H activity indices for the three stars considered here.
Stellar activity can induce spurious velocity signatures that mimic the velocities produced by exoplanets. This can appear at the stellar rotation period or its harmonics (Boisse et al., 2011). Magnetic cycles can also produce radial velocity signals comparable in amplitude to orbiting planets (e.g. Santos et al., 2010; Dumusque et al., 2011; Robertson et al., 2015; Faria et al., 2016). Multiple mechanisms can produce these line profile variations. For example, variable levels of chromospheric activity can produce changes in the level of line profile reversal in some line cores, resulting in changes to both the line centroid and hence the measured radial velocity (Martínez-Arnáiz et al., 2010). These effects will also produce changes in the line’s equivalent width (EW), and so measurement of the EW can provide an indicator of the presence of activity-induced radial velocity variations (Robertson et al., 2014). Stellar activity is also seen to be correlated with the presence of starspots (Berdyugina, 2005; Strassmeier, 2009; Davenport, 2015) and suppression of convection (Haywood et al., 2016), which will produce changes in line profile shapes and so line centroids, resulting in velocity jitter (Reiners et al., 2010; Andersen & Korhonen, 2015). So EW measurements for a line-profile sensitive feature would be expected to be correlated with this source of jitter as well.
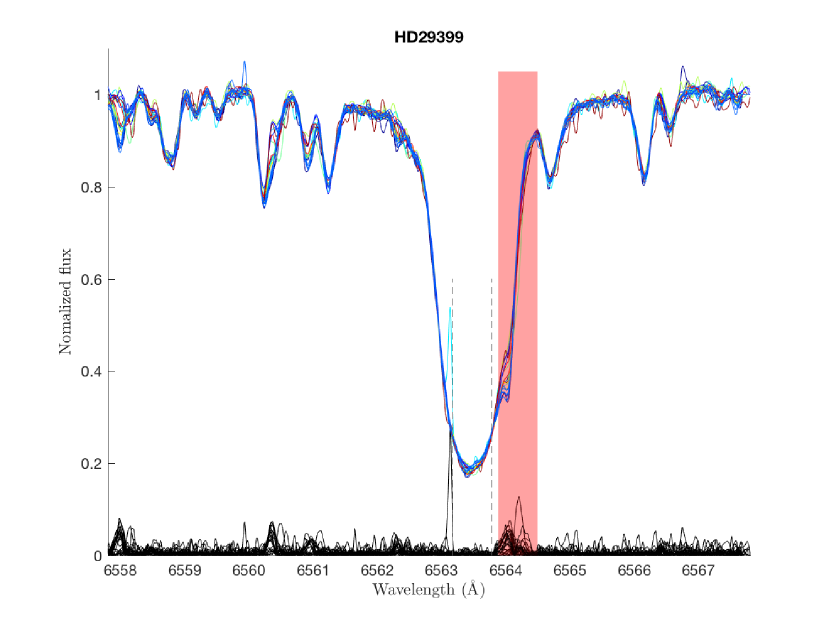
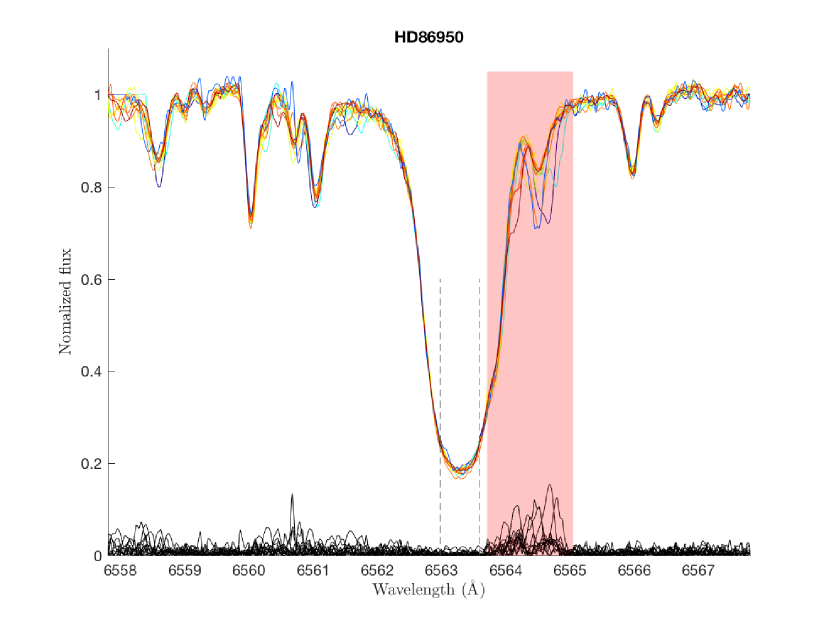
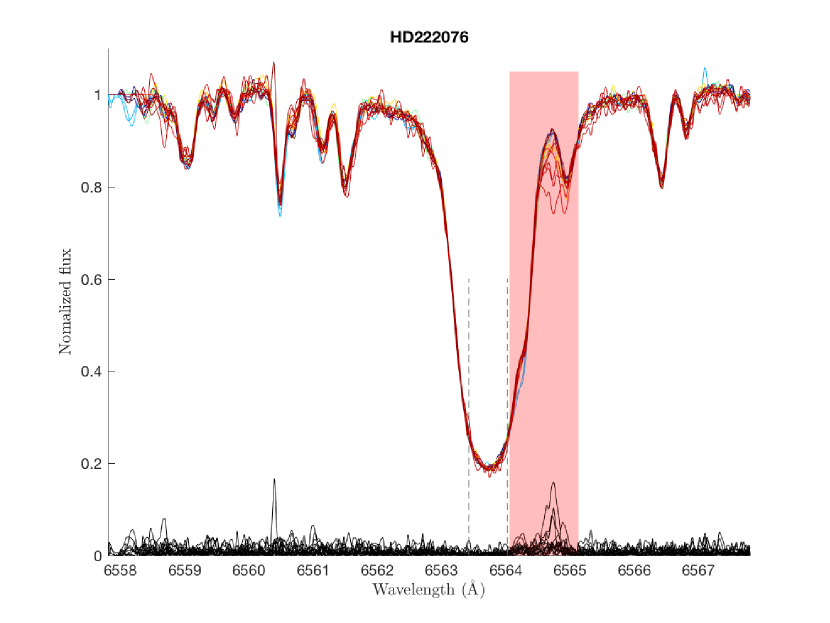
We have therefore measured the equivalent width of H absorption as an indicator of variability in chromospheric activity. Our analysis builds on that presented by (Robertson et al., 2014), with the addition of an automated algorithm for continuum normalisation and telluric contamination identification in the region of the H line. This method (detailed in the Appendix) has the advantage of being robust for arbitrary, slowly varying continua selection, without being parametric for the specific shape of the continuum or the location of specific absorption lines.
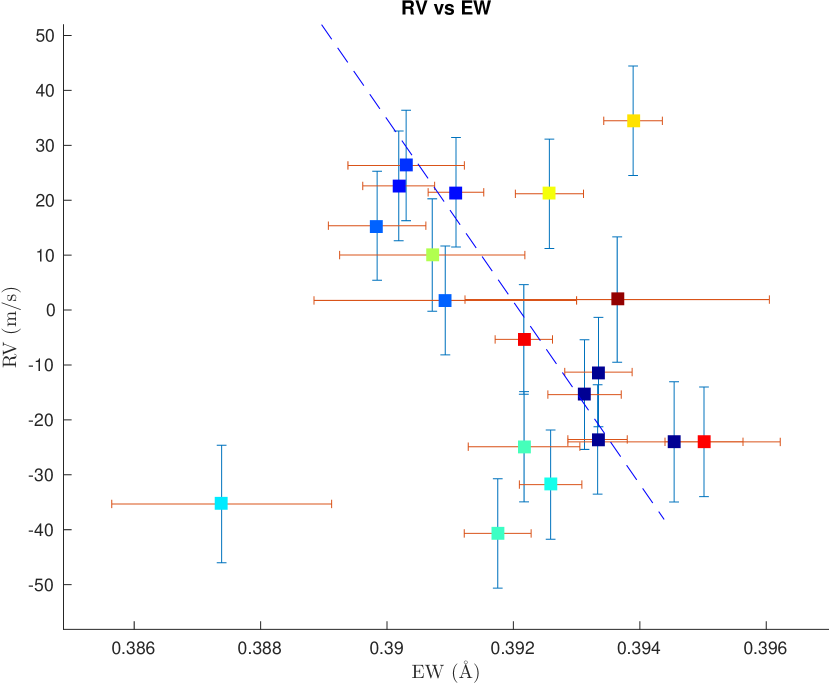
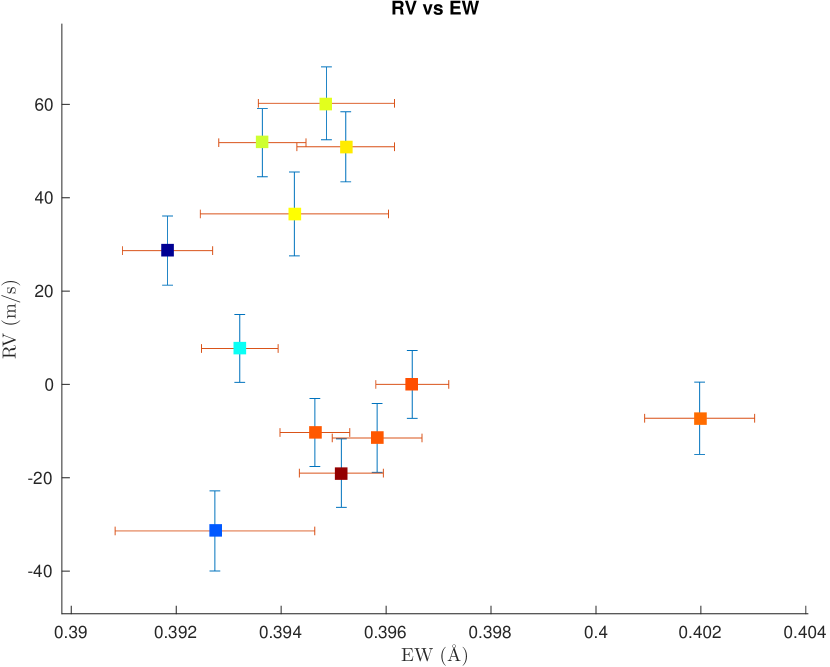
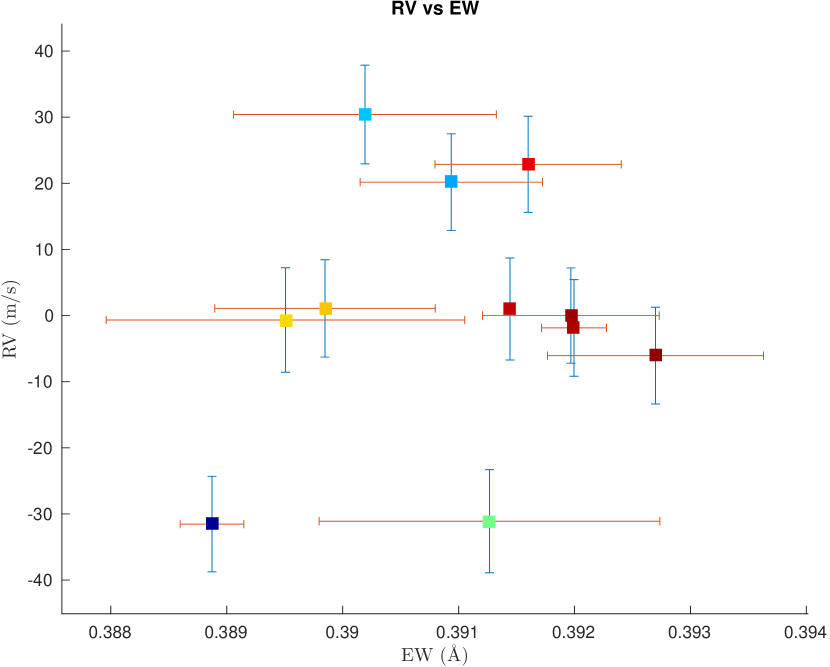
We show the stacked spectra of the three stars featured in this work, along with their RV-EW relations (Fig. 6– 8). For HD 29399, where a strong 2-year periodicity was evident in the photometry and the radial velocities, we find a correlation between the H equivalent width and the radial velocity, further evidence that the RV periodicity is intrinsic to the star and is most likely the result of a magnetic activity cycle as noted in Section 3.1. For the candidate planet hosts HD 86950 and HD 222076, no correlations are seen from the RV-EW plots, supporting our claim that the detected RV variations are not due to chromospheric stellar activity.
4 Discussion and Conclusions
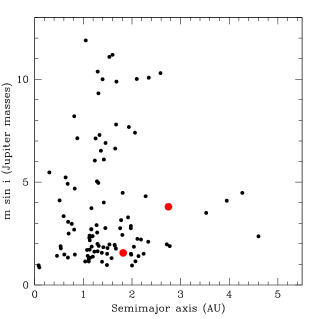
HD 86950b and HD 222076b are typical of the population of planets being found to orbit evolved stars, which are generally beyond 1 AU and with masses greater than 1 Mjup (e.g. Lovis & Mayor, 2007; Döllinger et al., 2009; Bowler et al., 2010; Jones et al., 2014). Figure 9 places these two planets in context with the other planets known to orbit giant stars (i.e. stars with log ). Of the 107 such planets confirmed111http://exoplanets.org, accessed 2016 July, the median semimajor axis is 1.38 AU, and the median m sin is 1.38 .
4.1 Possible debris discs
HD 86950 has been identified by McDonald et al. (2012) as having a possible infrared excess based on the presence of excess emission at m in the AKARI/IRC All-Sky Survey (Ishihara et al., 2010), with a fractional luminosity () of . The presence of both a planetary system and a debris disc around HD 86950 would make it a nearly-unique object amongst sub-giant stars, joining CrB (HD 142091) as one of very few examples of an evolved star hosting both a debris disc and exoplanet Bonsor et al. (2013). Confirmation of this excess (and a better determination of the disc’s properties if confirmed) is therefore critical.
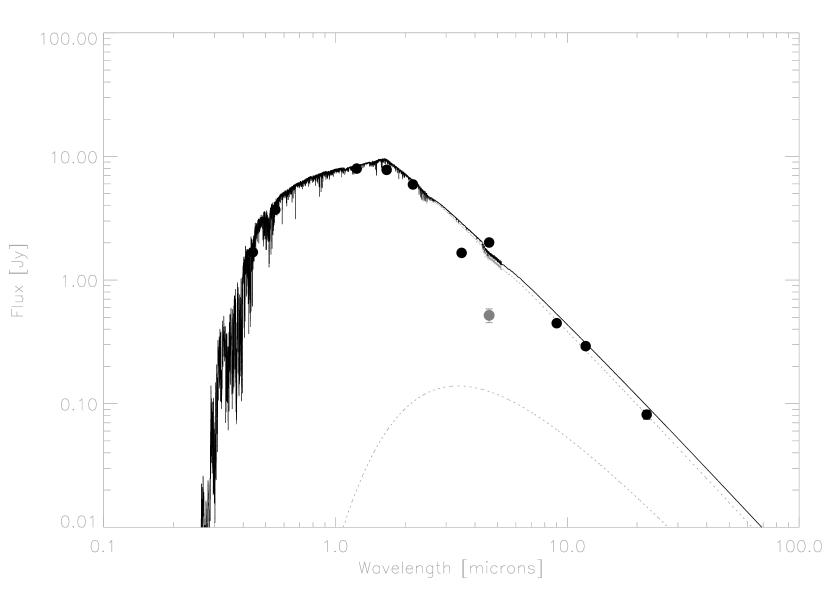
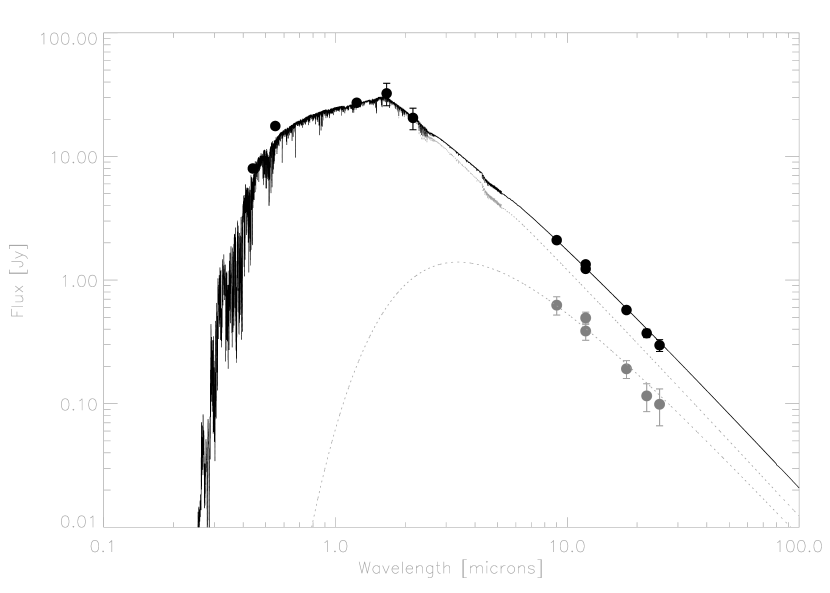
We compiled a spectral energy distribution from photometry spanning optical to mid-infrared wavelengths, including optical , near-infrared 2MASS (Skrutskie et al., 2006), and mid-infrared MSX (Egan et al., 2003) and WISE (Wright et al., 2010) measurements, in addition to the AKARI 9 m datum. We fit the stellar photospheric emission with a model from the BT-SETTL/Nextgen stellar atmospheres grid appropriate for the spectral type (K0III; K, log = 2.0, [Fe/H] = 0.0), and scaled to the stellar radius and distance (Wittenmyer & Marshall, 2015; van Leeuwen, 2007). We colour corrected the AKARI and WISE flux densities assuming blackbody emission from the star. The resulting spectral energy distribution is shown in the left panel of Figure 10. No evidence of significant excess (i.e. () from the system is observed out to wavelengths 22 m, ruling out the warm, bright disc inferred from McDonald et al. (2012). The previous identification of infrared excess from HD 86950 can be attributed to the AKARI flux density not being colour corrected.
We performed a similar analysis of the available photometric data for HD 222076. We find no evidence for an excess, with the maximum at 9m and 1.8 (Figure 10, right panel). McDonald et al. (2012) likewise find no excess in their analysis.
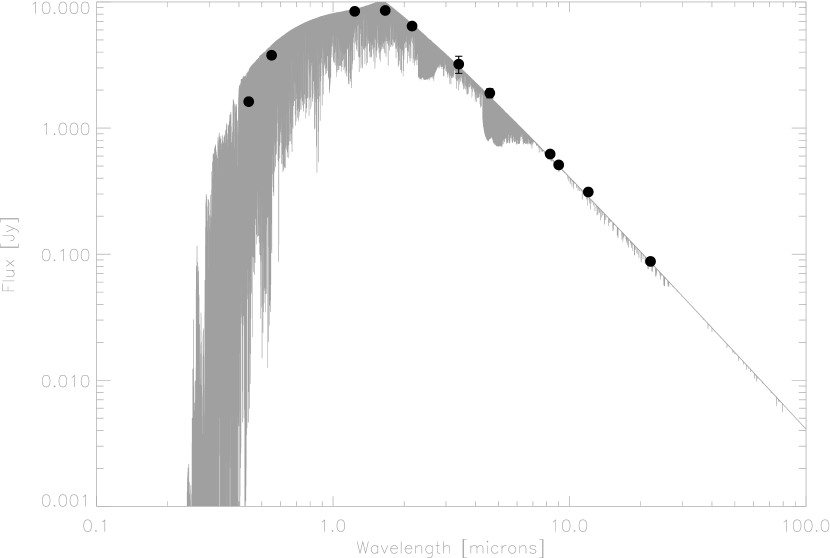
While we find that HD 29399 does not host a planet, we note that McDonald et al. (2012) also identify it as having an excess, with () . Using the same approach as described above, we show the spectral energy distribution for HD 29399 in Figure 11. Photometry for the targets was compiled from Johnson BV, 2MASS JHKs (Cutri et al., 2003), WISE All-Sky Survey (Wright et al., 2010), and the Akari IRC All-Sky Survey (Ishihara et al., 2010). We avoided using WISE W1 and W2 photometry due to known saturation issues for bright () stars. We fit the stellar photospheric emission with the following model atmosphere consistent with the physical parameters given in Table 5: K, log = 3.5, [Fe/H] = 0.0. Adopting a stellar radius of 3.97 and the distance as given in Table 5, we find an infrared excess at the 3-8 level. This can be fitted with a star+dust model using 1500K dust (). The star is not yet so evolved (nor is its photospheric temperature cool enough) that it would be expected to be surrounded by a dusty envelope, one potential origin of the excess. Likewise, the radial velocities rule out the presence of a cool binary stellar companion. If we adopt a 25% larger stellar radius of 5, then the excess disappears and would be consistent with the poorly constrained near-infrared photometry for this star. However, assuming we are confident in the derivation of our stellar parameters and that the circumstellar dust origin for the excess holds, such hot dust might therefore be produced by e.g. delivery of comets from an outer, cool debris belt. Additional measurements of the spectral energy distribution at wavelengths to search for such a debris belt would be of value in this case.
4.2 The giant planet-metallicity relation
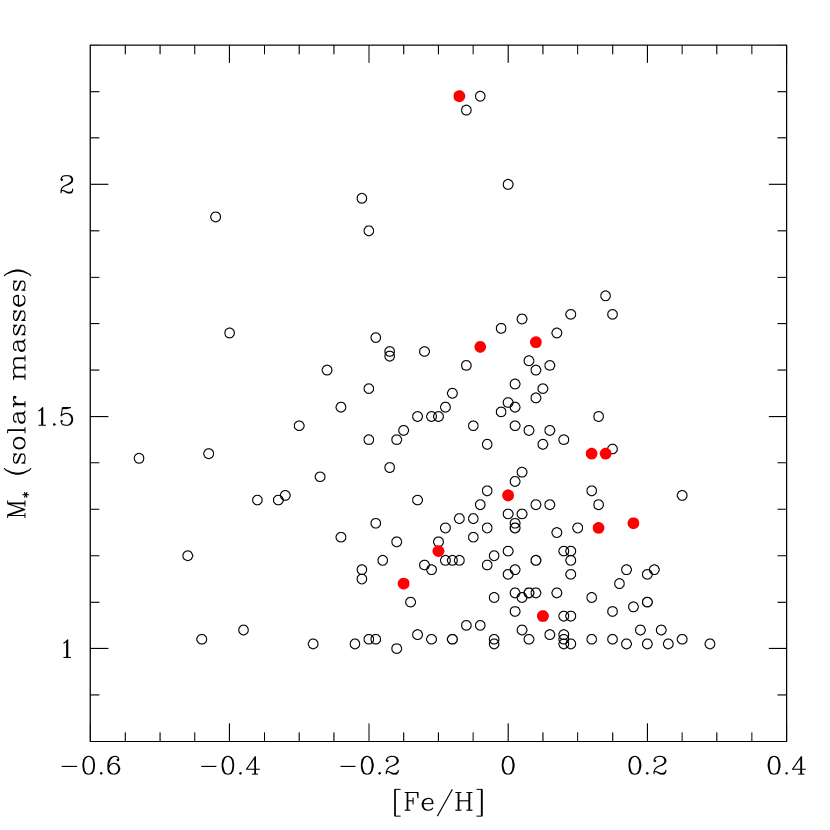
Following recent work by Reffert et al. (2015) and Jones et al. (2016), we now examine the results of the PPPS in light of the planet-metallicity relation for evolved hosts as noted by those authors. Overall, our PPPS sample of 164 stars has 11 confirmed planet hosts, comparable to the 10 planet hosts in 166 stars reported by the EXPRESS survey (Jones et al., 2016). Reffert et al. (2015) reported 15 secure planet hosts (and a further 20 candidates) among 373 giant stars in their Lick Observatory sample. Figure 12 shows the host-star mass versus metallicity [Fe/H] for 164 PPPS stars; the 11 confirmed hosts are shown as red points.
For ease of comparison, we cast our results into the same stellar mass-metallicity bins as used by Reffert et al. (2015). Table 8 shows the PPPS results in these bins; Jones et al. (2016) presented the EXPRESS results in the same format in their Table 3. Our results are broadly consistent; a key difference is that the PPPS sample has very few targets of super-solar metallicity compared to the EXPRESS and Lick surveys. This results in the highest-metallicity bins being sparsely populated and not quite amenable to a full analysis including the dimension of host-star mass (as was performed for the 373-star sample presented in Reffert et al. 2015).
We next investigate the occurrence rate only as a function of [Fe/H] as shown in Figure 13. For ease of comparison with Jones et al. (2016), we use the same bins as from their Figure 8. The 68.3% binomial confidence intervals are computed after Wilson (1927), which is noted by Brown et al. (2001) as a preferable method for small sample sizes.
Consistent with Hekker & Meléndez (2007), Reffert et al. (2015), and Jones et al. (2016), we also show an increasing planet occurrence rate with stellar metallicity. The two samples, of planet hosts and the parent sample, are shown by the K-S test to be drawn from the same distribution with a K-S probability of , i.e. a 70.8% probability that they are from the same underlying distribution.
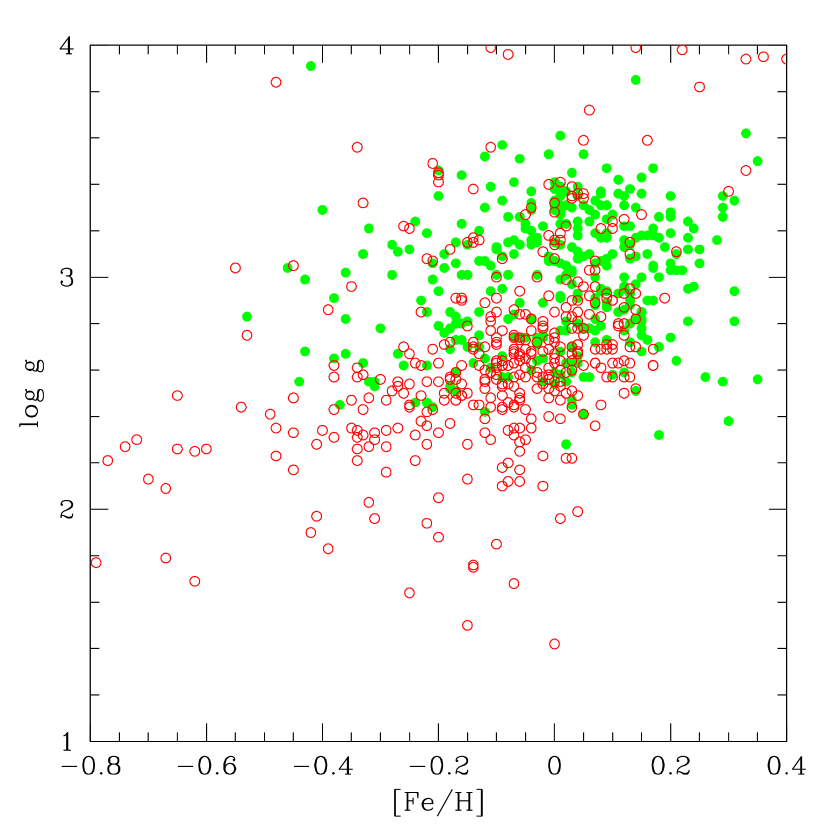
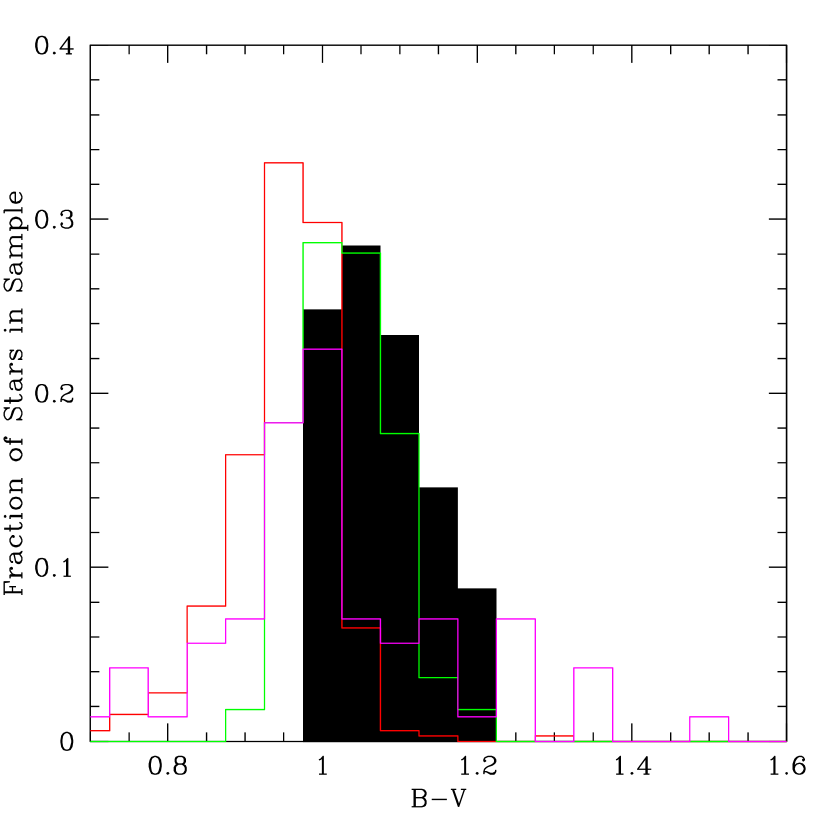
Our findings of a positive correlation between metallicity and planet occurrence are in contrast to the results of some other evolved star surveys (e.g. Pasquini et al., 2007; Takeda et al., 2008; Mortier et al., 2013). The disagreement most likely arises from different selection criteria for the samples of evolved stars observed by the various groups. Mortier et al. (2013) pointed out that since most surveys choose a colour cutoff 1.0, the more metal-rich, low-gravity stars are excluded. To illustrate this, Figure 14 plots the distribution of log versus [Fe/H] for the targets of four surveys, two of which find a planet-metallicity correlation (Jones et al., 2016; Wittenmyer et al., 2016d), and two of which do not (Takeda et al., 2008; Mortier et al., 2013). The surveys which did not find a correlation are shown as red open circles, generally lying at lower [Fe/H] and lower surface gravity than the others. Mortier et al. (2013) showed a similar result in their Figure 6. We also show the differences in (B-V) colours from these four surveys in the right panel of Figure 14. Again, the surveys finding a planet-metallicity correlation tend to sample redder stars with 1.0.
These results from the PPPS do not yet account for survey incompleteness induced by nonuniform detectability (e.g. Howard et al., 2010; Wittenmyer et al., 2011a, 2016c). A more comprehensive analysis of the overall survey completeness is the subject of a forthcoming paper.
References
- Alves et al. (2015) Alves, S., Benamati, L., Santos, N. C., et al. 2015, MNRAS, 448, 2749
- Andersen & Korhonen (2015) Andersen, J. M., & Korhonen, H. 2015, MNRAS, 448, 3053
- Anglada-Escudé & Tuomi (2015) Anglada-Escudé, G., & Tuomi, M. 2015, Science, 347, 1080
- Baranne et al. (1996) Baranne, A., Queloz, D., Mayor, M., et al. 1996, A&AS, 119, 373
- Berdyugina (2005) Berdyugina, S. V. 2005, Living Reviews in Solar Physics, 2
- Boisse et al. (2011) Boisse, I., Bouchy, F., Hébrard, G., et al. 2011, A&A, 528, A4
- Bonsor et al. (2013) Bonsor, A., Kennedy, G. M., Crepp, J. R., et al. 2013, MNRAS, 431, 3025
- Bowler et al. (2010) Bowler, B. P., Johnson, J. A., Marcy, G. W., et al. 2010, ApJ, 709, 396
- Brown et al. (2001) Brown, L.T., Cai, T.T., & DasGupta, A. 2001, Statistical Science, 16, 101
- Butler et al. (1996) Butler, R. P., Marcy, G. W., Williams, E., McCarthy, C., Dosanjh, P., & Vogt, S. S. 1996, PASP, 108, 500
- Castelli & Kurucz (2003) Castelli, F., Kurucz, R. L. 2003, IAU Symposium, 210, 20
- Corben et al. (1972) Corben, P. M., Carter, B. S., Banfield, R. M., & Harvey, G. M. 1972, Monthly Notes of the Astronomical Society of South Africa, 31, 7
- Croll et al. (2015) Croll, B., Dalba, P. A., Vanderburg, A., et al. 2015, arXiv:1510.06434
- Cutri et al. (2003) Cutri, R. M., Skrutskie, M. F., van Dyk, S., et al. 2003, VizieR Online Data Catalog, 2246,
- Davenport (2015) Davenport, J. 2015, Ph.D. Thesis,
- De Medeiros et al. (2014) De Medeiros, J. R., Alves, S., Udry, S., et al. 2014, A&A, 561, A126
- Diego et al. (1990) Diego, F., Charalambous, A., Fish, A. C., & Walker, D. D. 1990, Proc. SPIE, 1235, 562
- Döllinger et al. (2009) Döllinger, M. P., Hatzes, A. P., Pasquini, L., Guenther, E. W., & Hartmann, M. 2009, A&A, 505, 1311
- Dumusque et al. (2011) Dumusque, X., Santos, N. C., Udry, S., Lovis, C., & Bonfils, X. 2011, A&A, 527, A82
- Egan et al. (2003) Egan, M. P., Price, S. D., Kraemer, K. E., et al. 2003, VizieR Online Data Catalog, 5114,
- Faria et al. (2016) Faria, J. P., Haywood, R. D., Brewer, B. J., et al. 2016, A&A, 588, A31
- Fischer & Valenti (2005) Fischer, D. A., & Valenti, J. 2005, ApJ, 622, 1102
- Fischer et al. (2016) Fischer, D. A., Anglada-Escude, G., Arriagada, P., et al. 2016, PASP, 128, 066001
- Gonzalez (1997) Gonzalez, G. 1997, MNRAS, 285, 403
- Han et al. (2014) Han, E., Wang, S. X., Wright, J. T., et al. 2014, PASP, 126, 827
- Haywood et al. (2016) Haywood, R. D., Collier Cameron, A., Unruh, Y. C., et al. 2016, MNRAS, 457, 3637
- Hekker & Meléndez (2007) Hekker, S., & Meléndez, J. 2007, A&A, 475, 1003
- Hekker et al. (2008) Hekker, S., Snellen, I. A. G., Aerts, C., et al. 2008, A&A, 480, 215
- Høg et al. (2000) Høg, E., Fabricius, C., Makarov, V. V., et al. 2000, A&A, 355, L27
- Houk & Cowley (1975) Houk, N., & Cowley, A. P. 1975, University of Michigan Catalogue of two-dimensional spectral types for the HD stars. Volume I. Declinations -90 to -53, by Houk, N.; Cowley, A. P.. Ann Arbor, MI (USA): Department of Astronomy, University of Michigan, 19 + 452 p.,
- Houk & Smith-Moore (1988) Houk, N., & Smith-Moore, M. 1988, Michigan Catalogue of Two-dimensional Spectral Types for the HD Stars. Volume 4, Declinations -26 to -12. N. Houk, M. Smith-Moore.Department of Astronomy, University of Michigan, Ann Arbor, MI 48109-1090, USA. 14+505 pp. Price US 25.00 (USA, Canada), US 28.00 (Foreign) (1988).,
- Howard et al. (2010) Howard, A. W., Marcy, G. W., Johnson, J. A., et al. 2010, Science, 330, 653
- Ishihara et al. (2010) Ishihara, D., Onaka, T., Kataza, H., et al. 2010, A&A, 514, A1
- Johnson et al. (2006) Johnson, J. A., Marcy, G. W., Fischer, D. A., Henry, G. W., Wright, J. T., Isaacson, H., & McCarthy, C. 2006, ApJ, 652, 1724
- Johnson et al. (2016) Johnson, M. C., Endl, M., Cochran, W. D., et al. 2016, ApJ, 821, 74
- Jones & Jenkins (2014) Jones, M. I., & Jenkins, J. S. 2014, A&A, 562, A129
- Jones et al. (2011) Jones, M. I., Jenkins, J. S., Rojo, P., & Melo, C. H. F. 2011, A&A, 536, A71
- Jones et al. (2013) Jones, M. I., Jenkins, J. S., Rojo, P., Melo, C. H. F., & Bluhm, P. 2013, A&A, 556, A78
- Jones et al. (2014) Jones, M. I., Jenkins, J. S., Bluhm, P., Rojo, P., & Melo, C. H. F. 2014, A&A, 566, A113
- Jones et al. (2016) Jones, M. I., Jenkins, J. S., Brahm, R., et al. 2016, A&A, 590, A38
- Kaufer et al. (1999) Kaufer, A., Stahl, O., Tubbesing, S., et al. 1999, The Messenger, 95, 8
- Kochukhov et al. (2010) Kochukhov, O., Makaganiuk, V., & Piskunov, N. 2010, A&A, 524, A5
- Landolt (1983) Landolt, A. U. 1983, AJ, 88, 853
- Lovis & Mayor (2007) Lovis, C., & Mayor, M. 2007, A&A, 472, 657
- Maldonado et al. (2013) Maldonado, J., Villaver, E., & Eiroa, C. 2013, A&A, 554, A84
- Martínez-Arnáiz et al. (2010) Martínez-Arnáiz, R., Maldonado, J., Montes, D., Eiroa, C., & Montesinos, B. 2010, A&A, 520, A79
- McDonald et al. (2012) McDonald, I., Zijlstra, A. A., & Boyer, M. L. 2012, MNRAS, 427, 343
- Meschiari et al. (2009) Meschiari, S., Wolf, A. S., Rivera, E., et al. 2009, PASP, 121, 1016
- Mortier et al. (2013) Mortier, A., Santos, N. C., Sousa, S. G., et al. 2013, A&A, 557, A70
- Pasquini et al. (2007) Pasquini, L., Döllinger, M. P., Weiss, A., et al. 2007, A&A, 473, 979
- Pojmanski & Maciejewski (2004) Pojmanski, G., & Maciejewski, G. 2004, Acta Astronomica, 54, 153
- Pollack et al. (1996) Pollack, J. B., Hubickyj, O., Bodenheimer, P., et al. 1996, Icarus, 124, 62
- Rajpaul et al. (2016) Rajpaul, V., Aigrain, S., & Roberts, S. 2016, MNRAS, 456, L6
- Rappaport et al. (2016) Rappaport, S., Gary, B. L., Kaye, T., et al. 2016, MNRAS, 458, 3904
- Reffert et al. (2015) Reffert, S., Bergmann, C., Quirrenbach, A., Trifonov, T., Künstler, A. 2015, A&A, 574, A116
- Reiners et al. (2010) Reiners, A., Bean, J. L., Huber, K. F., et al. 2010, ApJ, 710, 432
- Robertson et al. (2014) Robertson, P., Mahadevan, S., Endl, M., & Roy, A. 2014, Science, 345, 440
- Robertson et al. (2015) Robertson, P., Roy, A., & Mahadevan, S. 2015, ApJ, 805, L22
- Rothman et al. (2013) Rothman, L. S., Gordon, I. E., Babikov, Y., et al. 2013, J. Quant. Spec. Radiat. Transf., 130, 4
- Santos et al. (2001) Santos, N. C., Israelian, G., & Mayor, M. 2001, A&A, 373, 1019
- Santos et al. (2010) Santos, N. C., Gomes da Silva, J., Lovis, C., & Melo, C. 2010, A&A, 511, A54
- Sato et al. (2005) Sato, B., Kambe, E., Takeda, Y., et al. 2005, PASJ, 57, 97
- Sato et al. (2013) Sato, B., Omiya, M., Wittenmyer, R. A., et al. 2013, ApJ, 762, 9
- Sato et al. (2016) Sato, B., Wang, L., Liu, Y.-J., et al. 2016, ApJ, 819, 59
- Skrutskie et al. (2006) Skrutskie, M. F., Cutri, R. M., Stiening, R., et al. 2006, AJ, 131, 1163
- Sneden (1973) Sneden, C. 1973, ApJ, 184, 839
- Strassmeier (2009) Strassmeier, K. G. 2009, A&A Rev., 17, 251
- Takeda et al. (2008) Takeda, Y., Sato, B., & Murata, D. 2008, PASJ, 60, 781
- Tinney et al. (2011) Tinney, C. G., Wittenmyer, R. A., Butler, R. P., et al. 2011, ApJ, 732, 31
- van Leeuwen (2007) van Leeuwen, F. 2007, A&A, 474, 653
- Tokovinin et al. (2013) Tokovinin, A., Fischer, D. A., Bonati, M., et al. 2013, PASP, 125, 1336
- (72) Valenti, J. A., Butler, R. P. & Marcy, G. W. 1995, PASP, 107, 966.
- Vanderburg et al. (2015) Vanderburg, A., Johnson, J. A., Rappaport, S., et al. 2015, Nature, 526, 546
- Wilson (1927) Wilson, E.B. 1927, J. Amer. Statist. Assoc., 22, 209
- Wittenmyer et al. (2011a) Wittenmyer, R. A., Tinney, C. G., Butler, R. P., et al. 2011a, ApJ, 738, 81
- Wittenmyer et al. (2011b) Wittenmyer, R. A., Endl, M., Wang, L., et al. 2011b, ApJ, 743, 184
- Wittenmyer & Marshall (2015) Wittenmyer, R. A., & Marshall, J. P. 2015, AJ, 149, 86
- Wittenmyer et al. (2015) Wittenmyer, R. A., Wang, L., Liu, F., et al. 2015, ApJ, 800, 74
- Wittenmyer et al. (2016a) Wittenmyer, R. A., Butler, R. P., Wang, L., et al. 2016a, MNRAS, 455, 1398
- Wittenmyer et al. (2016b) Wittenmyer, R. A., Johnson, J. A., Butler, R. P., et al. 2016b, ApJ, 818, 35
- Wittenmyer et al. (2016c) Wittenmyer, R. A., Butler, R. P., Tinney, C. G., et al. 2016c, ApJ, 819, 28
- Wittenmyer et al. (2016d) Wittenmyer, R. A., Liu, F., Wang, L., et al. 2016d, AJ, 152, 19
- Wright et al. (2010) Wright, E. L., Eisenhardt, P. R. M., Mainzer, A. K., et al. 2010, AJ, 140, 1868-1881
- Wright et al. (2011) Wright, J. T., Fakhouri, O., Marcy, G. W., et al. 2011, PASP, 123, 412
- Zechmeister & Kürster (2009) Zechmeister, M., Kürster, M. 2009, A&A, 496, 577
- Zieliński et al. (2010) Zieliński, P., Niedzielski, A., Adamów, M., & Wolszczan, A. 2010, EAS Publications Series, 42, 201
| Star | Span (days) | Mean uncertainty (m s-1) | Instrument | |
|---|---|---|---|---|
| HD 29399 | 22 | 2373 | 1.8 | UCLES |
| 7 | 79 | 4.2 | CHIRON | |
| HD 86950 | 13 | 1879 | 2.8 | UCLES |
| 7 | 66 | 3.9 | CHIRON | |
| HD 222076 | 11 | 1456 | 2.5 | UCLES |
| 17 | 2072 | 4.3 | FEROS | |
| 9 | 149 | 7.2 | CHIRON |
| BJD-2400000 | Velocity (m s-1) | Uncertainty (m s-1) | Instrument |
|---|---|---|---|
| 54866.93634 | -24.01 | 4.68 | AAT |
| 54867.96653 | -23.57 | 1.04 | AAT |
| 54869.89726 | -15.40 | 1.32 | AAT |
| 54870.90323 | -11.30 | 1.15 | AAT |
| 55074.31485 | 22.61 | 1.40 | AAT |
| 55075.31193 | 21.45 | 1.23 | AAT |
| 55140.16735 | 26.33 | 1.76 | AAT |
| 55225.01910 | 1.75 | 0.68 | AAT |
| 55225.91346 | 15.36 | 0.77 | AAT |
| 55226.92603 | 6.46 | 0.91 | AAT |
| 55455.23879 | -35.32 | 4.05 | AAT |
| 55525.12752 | -31.79 | 1.00 | AAT |
| 55580.91947 | -40.68 | 1.07 | AAT |
| 55601.91656 | -24.89 | 1.62 | AAT |
| 55783.26560 | 10.02 | 2.60 | AAT |
| 55879.16028 | 12.69 | 1.31 | AAT |
| 55906.05799 | 21.17 | 1.06 | AAT |
| 55971.05135 | 34.47 | 1.21 | AAT |
| 56344.94543 | -23.99 | 1.32 | AAT |
| 56375.87846 | -5.35 | 1.24 | AAT |
| 56526.22058 | 1.91 | 5.67 | AAT |
| 57238.28861 | -5.13 | 1.55 | AAT |
| 57298.82760 | -6.50 | 4.30 | CHIRON |
| 57299.74140 | -8.70 | 4.80 | CHIRON |
| 57308.68060 | 19.90 | 4.30 | CHIRON |
| 57324.81200 | 9.20 | 4.40 | CHIRON |
| 57332.68480 | 2.30 | 3.90 | CHIRON |
| 57353.71510 | -6.00 | 4.20 | CHIRON |
| 57377.59490 | -10.10 | 3.80 | CHIRON |
Note. — The velocities shown are relative to instrument-specific zero points.
| BJD-2400000 | Velocity (m s-1) | Uncertainty (m s-1) | Instrument |
|---|---|---|---|
| 54866.15767 | 28.67 | 2.43 | AAT |
| 55252.08271 | -31.39 | 4.95 | AAT |
| 55381.85809 | -42.55 | 1.85 | AAT |
| 55581.16782 | 7.70 | 1.97 | AAT |
| 55969.12369 | 51.80 | 2.08 | AAT |
| 55994.08537 | 60.23 | 3.44 | AAT |
| 56051.93221 | 36.53 | 5.64 | AAT |
| 56090.89459 | 50.92 | 2.72 | AAT |
| 56344.07002 | -7.25 | 3.33 | AAT |
| 56375.04442 | -11.47 | 2.34 | AAT |
| 56377.01080 | -10.30 | 1.98 | AAT |
| 56399.95118 | 0.00 | 1.99 | AAT |
| 56745.02214 | -19.00 | 2.18 | AAT |
| 57394.72380 | 3.40 | 4.10 | CHIRON |
| 57404.86600 | 4.70 | 3.80 | CHIRON |
| 57406.82630 | 4.90 | 4.20 | CHIRON |
| 57407.85770 | -7.40 | 4.50 | CHIRON |
| 57445.62610 | 5.30 | 3.70 | CHIRON |
| 57445.64010 | -0.20 | 3.20 | CHIRON |
| 57460.60950 | -10.60 | 3.80 | CHIRON |
Note. — The velocities shown are relative to instrument-specific zero points, which are free parameters in the fitting process and are given in Table 6.
| BJD-2400000 | Velocity (m s-1) | Uncertainty (m s-1) | Instrument |
|---|---|---|---|
| 55074.25071 | -31.5 | 1.8 | AAT |
| 55495.99749 | 20.2 | 2.1 | AAT |
| 55525.93596 | 30.4 | 2.6 | AAT |
| 55788.26403 | -31.1 | 3.4 | AAT |
| 56052.29321 | -0.7 | 3.7 | AAT |
| 56089.28126 | 1.1 | 2.3 | AAT |
| 56400.31160 | 22.9 | 2.0 | AAT |
| 56469.30504 | 1.0 | 3.2 | AAT |
| 56494.25818 | -1.9 | 2.1 | AAT |
| 56526.10530 | 0.0 | 1.7 | AAT |
| 56530.11951 | -6.1 | 2.1 | AAT |
| 55317.88970 | 16.0 | 4.6 | FEROS |
| 55379.90380 | 31.1 | 3.6 | FEROS |
| 55428.75550 | 17.6 | 4.0 | FEROS |
| 55457.72790 | 15.1 | 3.6 | FEROS |
| 55729.91020 | -19.6 | 5.0 | FEROS |
| 55786.89910 | -39.4 | 4.6 | FEROS |
| 55793.83430 | -31.0 | 4.2 | FEROS |
| 56047.93430 | -18.7 | 3.0 | FEROS |
| 56160.79830 | 7.7 | 3.3 | FEROS |
| 56241.62910 | 23.0 | 3.4 | FEROS |
| 56251.66450 | 9.8 | 3.9 | FEROS |
| 56412.86280 | 10.8 | 4.1 | FEROS |
| 56431.84030 | -0.9 | 3.1 | FEROS |
| 56565.68380 | -27.2 | 3.7 | FEROS |
| 57174.87230 | 17.1 | 3.8 | FEROS |
| 57388.55510 | -9.8 | 4.2 | FEROS |
| 57389.55090 | -1.6 | 4.0 | FEROS |
| 57255.75540 | 3.9 | 6.7 | CHIRON |
| 57273.74490 | 11.3 | 7.4 | CHIRON |
| 57293.66430 | 16.7 | 6.8 | CHIRON |
| 57311.66690 | 17.5 | 7.4 | CHIRON |
| 57332.57240 | -4.3 | 7.2 | CHIRON |
| 57353.53290 | -9.7 | 6.6 | CHIRON |
| 57374.53140 | -3.0 | 7.2 | CHIRON |
| 57394.53520 | -14.0 | 8.5 | CHIRON |
| 57404.54130 | -18.5 | 7.4 | CHIRON |
Note. — The velocities shown are relative to instrument-specific zero points, which are free parameters in the fitting process and are given in Table 6.
| HD 29399 | HD 86950 | HD 222076 | ||||
|---|---|---|---|---|---|---|
| Parameter | Value | Ref. | Value | Ref. | Value | Ref. |
| Spec. Type | K1 III | 2 | K1 III | 8 | K0 III | 7 |
| 1.03 | 9 | 1.09 | 10 | 1.030 | 8 | |
| 0.0053 | 1 | 0.0173 | 1 | 0.0121 | 1 | |
| 0.0165 | 1 | 0.0537 | 1 | 0.0374 | 1 | |
| Mass () | 1.680.25 | 1 | 1.660.25 | 1 | 1.070.25 | 1 |
| Distance (pc) | 45.10.5 | 4 | 16922 | 4 | 83.54.3 | 4 |
| 0.070.10 | 1 | 0.040.10 | 1 | 0.050.10 | 1 | |
| 0.110.03 | 3 | 0.080.09 | 7 | 0.16 | 6 | |
| Teff (K) | 4848100 | 1 | 4805100 | 1 | 4806100 | 1 |
| 482853 | 3 | 4900 | 6 | |||
| 5170 | 5 | 4861 | 5 | 4950 | 5 | |
| log | 3.330.15 | 1 | 2.660.15 | 1 | 3.310.15 | 1 |
| 3.270.16 | 3 | 3.18 | 6 | |||
| Luminosity () | 10.0 | 1 | 36.3 | 1 | 8.5 | 1 |
| 9.56 | 5 | 33.38 | 5 | 7.84 | 5 | |
| Radius () | 4.00.6 | 1 | 8.80.6 | 1 | 4.10.6 | 1 |
| Parameter | HD 86950b | HD 222076b |
|---|---|---|
| Period (days) | 127057 | 87119 |
| (BJD-2400000) | 54245161 | 54264189 |
| Eccentricity | 0.170.16 | 0.080.05 |
| (degrees) | 24370 | 24160 |
| (m s-1) | 4912 | 31.92.3 |
| m sin () | 3.60.7 | 1.560.11 |
| (AU) | 2.720.08 | 1.830.03 |
| RMS about fit (m s-1) | 6.1 | 5.9 |
| Zero point – AAT m s-1 | 13.94.7 | -1.62.1 |
| Zero point – FEROS m s-1 | -10.31.8 | |
| Zero point – CHIRON m s-1 | -17.820.4 | -10.35.3 |
| BJD-2400000 | BVS (m s-1) | FWHM (km s-1) | |
|---|---|---|---|
| 55317.8897 | 0.610.9 | 12.7490.065 | 0.1380.004 |
| 55379.9038 | -6.17.3 | 12.7670.076 | 0.1310.002 |
| 55428.7555 | -20.412.4 | 12.7530.064 | 0.1250.002 |
| 55457.7279 | -24.17.9 | 12.8550.077 | 0.1270.002 |
| 55729.9102 | -5.48.4 | 12.8540.072 | 0.1250.003 |
| 55786.8991 | -12.09.8 | 12.8410.076 | 0.1340.002 |
| 55793.8343 | -29.28.3 | 12.8480.075 | 0.1330.003 |
| 56047.9343 | 17.26.6 | 12.8560.077 | 0.1280.002 |
| 56160.7983 | -39.09.4 | 12.8350.072 | 0.1260.002 |
| 56241.6291 | -22.813.6 | 12.7670.063 | 0.1310.002 |
| 56251.6645 | 1.512.7 | 12.8320.072 | 0.1170.002 |
| 56412.8628 | -1.010.5 | 12.7160.067 | 0.0930.004 |
| 56431.8403 | -7.77.5 | 12.7930.066 | 0.1370.004 |
| 56565.6838 | -10.212.4 | 12.8110.066 | 0.1220.002 |
| 57174.8723 | -2.77.0 | 12.7800.068 | 0.1260.002 |
| 57388.5551 | -32.411.2 | 12.8250.072 | 0.1320.002 |
| 57389.5509 | -20.713.6 | 12.7380.065 | 0.1250.002 |
Note. — BVS – bisector velocity span; FWHM – full-width half max of tghe cross-correlation function; – Mount Wilson S-index.


| [Fe/H] | () | (%) | ||
|---|---|---|---|---|
| -0.36 | 1.4 | 10 | 0 | |
| -0.36 | 2.2 | 1 | 0 | |
| -0.36 | 3.0 | 0 | 0 | |
| -0.20 | 1.4 | 27 | 1 | |
| -0.20 | 2.2 | 2 | 0 | |
| -0.20 | 3.0 | 0 | 0 | |
| -0.04 | 1.4 | 60 | 4 | |
| -0.04 | 2.2 | 4 | 1 | |
| -0.04 | 3.0 | 0 | 0 | |
| +0.12 | 1.4 | 49 | 5 | |
| +0.12 | 2.2 | 0 | 0 | |
| +0.12 | 3.0 | 0 | 0 | |
| +0.28 | 1.4 | 10 | 0 | |
| +0.28 | 2.2 | 0 | 0 | |
| +0.28 | 3.0 | 0 | 0 |

Appendix A Continuum normalization
In our UCLES data, the H line is recorded in two echelle orders (orders 19 and 20). Our analysis makes use of only the data in order 19. Order 20 (which is closer to the edge of the echellogram format) was found to be more subject to scattered light contamination than order 19, and so delivered systematically poorer normalization. The order 19 spectra were analysed in a window centred on the H line.
Our continuum fitting algorithm iteratively masks out pixels in the chosen wavelength range based on (1) their first-derivative (i.e. rejecting pixels until no neighbouring pixel has a gradient slopes larger than 10% of the maximum gradient of the original spectrum section), after which it (2) removes the pixels “left behind” at the bottoms of absorption features by keeping the local maxima and removing the local minima. The remaining unmasked continuum points are then (3) fit with linear regression, which is divided out of the original spectrum to create a first-pass normalized spectrum . Cosmic rays are removed from this first-pass continuum-normalised spectrum by rejecting pixels more than 10% above the normalised continuum (i.e. with values ). Steps (1)-(3) are then repeated using the original spectrum but with the cosmic ray pixels (i.e. the outliers above the continuum) removed to produce a final continuum-normalized spectrum .
We then construct a high H template and with it we remove further cosmic rays from the H window (labelled within dashed lines in the stacked spectra) by identifying groups of pixels displaying anomalous variability between exposures. We select the normalized spectrum with the highest as a first template , then shift all other spectra to match the velocity of , using the velocities of §2, to create a high template as the weighted average of the individual spectra. We reject pixels in the H window of individual spectrum that combine to form which deviate from the normalized mean by more than empirically 21 times the expected noise to signal ratio.
The measurement of H activity indices can be impacted by the presence of telluric absorption lines. Unfortunately, B star observations of each night are not available for telluric correction. We therefore generate a list of telluric line locations using the HITRAN (HIgh-resolution TRANsmission molecular absorption) database (Rothman et al., 2013), and use this to mask out the regions potentially contaminated by absorption. In the specific case of our data the prominent line is at rest frame. The telluric contamination is labelled in the shaded region of the stacked profile.
To avoid the telluric contamination, we define our H equivalent width as the sum of the normalised flux obtained from above at a window centred at H line .