The Highly Ionized Circumgalactic Medium is Kinematically Uniform Around Galaxies
Abstract
The circumgalactic medium (CGM) traced by Ovi doublet absorption has been found to concentrate along the projected major and minor axes of the host galaxies. This suggests that Ovi traces accreting and outflowing gas, respectively, which are key components of the baryon cycle of galaxies. We investigate this further by examining the kinematics of 29 Ovi absorbers associated with galaxies at as a function of galaxy color, inclination, and azimuthal angle. Each galaxy was imaged with HST and the absorption was detected in COS/HST spectra of nearby ( kpc) background quasars. We use the pixel-velocity two-point correlation function to characterize the velocity spread of the absorbers, which is a method used previously for a sample of Mgii absorber–galaxy pairs. The absorption velocity spread for Ovi is more extended than Mgii, which suggests that the two ions trace differing components of the CGM. Also contrary to Mgii, the Ovi absorption velocity spreads are similar regardless of galaxy color, inclination, and azimuthal angle. This indicates that the kinematics of the high ionization gas is not strongly influenced by the present star formation activity in the galaxy. The kinematic homogeneity of Ovi absorption and its tendency to be observed mainly along the projected galaxy major and minor axes is likely due to varying ionization conditions and gas densities about the galaxy. Gas in intermediate azimuthal angles may be ionized out of the Ovi phase, possibly resulting in an azimuthal angle dependence on the distribution of gas in higher ionization states.
Subject headings:
galaxies: halos — quasars: absorption lines1. Introduction
The circumgalactic medium (CGM) is a massive reservoir of multiphase gas surrounding a galaxy, with a gas mass comparable to the gas mass in the galaxy itself (Thom et al., 2011; Tumlinson et al., 2011; Werk et al., 2013; Peeples et al., 2014). It regulates the star formation rate of the galaxy through a balance of inflows and outflows into, out of, and through the CGM (e.g., Oppenheimer & Davé, 2008; Lilly et al., 2013). For these reasons, understanding the multiphase nature, locations, and kinematic properties of gas in the CGM is crucial to understanding how galaxies evolve to form the galaxies observed today.
Much of the current understanding of the CGM comes from the low-ionization Mgii doublet absorption in background quasar spectra due to it being easily observable from the ground in optical wavelengths at . Recent work has found that Mgii absorbers are preferentially located along the projected major and minor axes of their host galaxies (Bordoloi et al., 2011; Bouché et al., 2012; Kacprzak et al., 2012; Lan et al., 2014) and their kinematics show distinct differences with galaxy orientation, color, and other properties (Nielsen et al., 2015, 2016). Mgii is commonly associated with outflows (e.g., Rubin et al., 2010, 2014; Bouché et al., 2012; Martin et al., 2012; Bordoloi et al., 2014a, b; Kacprzak et al., 2014) and accretion or recycled outflows (e.g., Steidel et al., 2002; Kacprzak et al., 2010; Stewart et al., 2011; Martin et al., 2012; Rubin et al., 2012; Bouché et al., 2013; Ford et al., 2014).
However, given the multiphase nature of the CGM, Mgii traces only a fraction of the CGM. The high-ionization Ovi doublet absorption is another common tracer of the CGM. Tumlinson et al. (2011) has shown that the presence of Ovi is governed by the star formation rate of the host galaxy, with more absorbers associated with star forming galaxies and more nonabsorbers with passive galaxies. Ovi has been further studied extensively (e.g., Wakker & Savage, 2009; Prochaska et al., 2011; Johnson et al., 2013, 2015; Stocke et al., 2013; Mathes et al., 2014; Savage et al., 2014), but the physical processes giving rise to the gas traced by Ovi is still debated.
Recently, Oppenheimer et al. (2016) examined circumgalactic oxygen in the EAGLE simulations. They found that Ovi is not the dominant ionization state of oxygen in galaxy halos, and that the column densities of Ovi peak for galaxies, with lower column densities for lower and higher mass halos. Given this, the authors suggest that Ovi is primarily a tracer of the virial temperature of a galaxy, where galaxies have a virial temperature that results in the largest Ovi ionization fraction. For galaxies less massive than an galaxy, the virial temperature is too cool for strong Ovi and more massive galaxies ionize the oxygen into higher ionization states. The authors also found no connection between star formation and the Ovi out to 150 kpc, where the median “age” of Ovi is greater than 5 Gyrs. Consequently, the Tumlinson et al. (2011) results may be reflecting the changing ionization conditions with galaxy mass rather than a star formation rate dependence.
Comparing the properties of and processes depositing both the low-ionization gas traced by Mgii and the high-ionization gas traced by Ovi have become more common. For example, Muzahid et al. (2015) studied an absorber–galaxy pair in detail, where the pair has both Mgii and Ovi absorption probed along the minor axis of an edge-on galaxy. The authors concluded that the low- and high-ionization absorption traced recycled accretion and outflows, respectively. The metallicities of the ions are different, with the high-ionization phase having a metallicity (super-solar) over an order of magnitude greater than the low-ionization phase.
Using mock quasar absorption-line observations in hydrodynamic cosmological simulations, Churchill et al. (2015) examined the properties of the multiphase gas in the circumgalactic medium of a dwarf galaxy. The authors traced the line-of-sight spatial locations of the cells that dominate the absorption profiles. They found that while Civ and Ovi are observed at similar velocities as Hi and Mgii, the higher ionization gas traces different structures in different locations (spread over up to 100 kpc) along the line of sight. Also studying the simulated CGM, Ford et al. (2014) found that Ovi primarily traces “ancient outflows” in which the gas was ejected from the galaxy by outflows greater than 1 Gyr prior to . In contrast, they found that Mgii is dominated by recycled accretion.
Kacprzak et al. (2015) measured the orientations (inclinations and azimuthal angles) of galaxies associated with both Ovi absorbers and non-absorbers. They define an azimuthal angle of as having the background quasar sightline aligned with the projected galaxy major axis, and as the sightline along the projected galaxy minor axis. The authors reported that detected Ovi absorption is preferentially found along the major and minor axes of the host galaxy (similar to the behavior of Mgii; Kacprzak et al., 2012), suggesting that the absorbers in these regions traced accretion/recycling and outflows, respectively. Absorption was rarely detected within azimuthal angles of to , with the authors proposing that Ovi is not mixed throughout the CGM. The equivalent widths of absorption were also found to be greater along the minor axis than the major axis, hinting that the velocity spreads, the column densities, or both were dependent on the azimuthal angle at which gas is probed. To further examine the physics involved and the gas properties in relation to the galaxy, we study the kinematics of these Ovi absorbers here.
Both Nielsen et al. (2016) and Nielsen et al. (2015) (hereafter MAGiiCAT IV and MAGiiCAT V, respectively) used the pixel-velocity two-point correlation function (TPCF) method for Mgii absorbers to examine the velocity spreads as a function of galaxy color, redshift, impact parameter, inclination, and azimuthal angle. The TPCF method produced clear results in which the greatest absorber velocity dispersions were located along the projected minor axis () of face-on () blue galaxies. These large velocity dispersions were attributed to bipolar outflows, which, for the largest velocity dispersions, are pointed nearly directly towards or away from the observer. Red galaxies did not show these large dispersions, and in fact, showed the smallest velocity dispersions out of all subsamples, indicating a lack of outflowing material in Mgii. In this paper, we now use this TPCF method on a sample of 29 Ovi absorbing galaxies as a function of galaxy color, inclination, and azimuthal angle. We also compare the Ovi TPCFs to the previous results with Mgii.
This paper is organized as follows: Section 2 describes the Ovi sample and data analysis to obtain the galaxy and absorption properties. We also briefly describe the pixel-velocity two-point correlation function (TPCF) method. Section 3 presents the results of examining the TPCFs of Ovi absorbers as a function of galaxy color, azimuthal angle, and inclination. We also present the TPCFs for our Mgii sample (MAGiiCAT IV and V) in this section for comparison between ions. In Section 4 we discuss our results in the context of previous work. Finally, Section 5 summarizes and concludes our findings. Throughout the paper we use AB magnitudes and a CDM cosmology ( km s-1 Mpc-1, , ).
2. Sample and Data Analysis
In this section, we describe the galaxy properties and the quasar spectra for our Ovi absorber–galaxy sample, which is the focus of this paper. We also briefly describe the Mgii sample published in MAGiiCAT IV and V, which we use here for comparison to the more highly ionized Ovi CGM. Finally, we briefly describe our pixel-velocity TPCF method for studying the absorption kinematics.
2.1. Galaxy Properties
We use the subset of 29 galaxies with colors and detected Ovi doublet absorption from the sample presented in Kacprzak et al. (2015) (hereafter Kacprzak15), which were identified as part of our “Multiphase Galaxy Halos” large HST program (e.g., Kacprzak15, Muzahid et al., 2015, 2016) or obtained from the literature. The galaxies with non-detections in Ovi reported in Kacprzak15 are not included here as we cannot measure their absorption kinematics. The absorption-selected galaxies are located at spectroscopic redshifts of (median ) and within an on-the-sky projected distance of kpc (21.1 kpc kpc, kpc) from a background quasar. These are isolated galaxies, where no neighbors were identified within a projected distance of 200 kpc from the quasar line-of-sight and within a line-of-sight velocity separation of 500 km s-1.
| Field | |||||
|---|---|---|---|---|---|
| (kpc) | (deg) | (deg) | |||
| J012528000555 | 0.3985 | 163.0 | 1.80 | 63.2 | 59.3 |
| J035128142908 | 0.3567 | 72.2 | 0.28 | 28.5 | 4.8 |
| J045608215909 | 0.3818 | 103.4 | 1.78 | 57.1 | 63.7 |
| J045608215909 | 0.4847 | 108.0 | 1.66 | 42.1 | 85.2 |
| J091440282330 | 0.2443 | 105.8 | 1.48 | 38.9 | 18.2 |
| J094331053131 | 0.3530 | 96.4 | 1.40 | 44.3 | 8.1 |
| J094331053131 | 0.5480 | 150.8 | 1.17 | 58.8 | 67.1 |
| J095000483129 | 0.2119 | 93.5 | 3.13 | 47.7 | 16.6 |
| J100402285535 | 0.1380 | 56.7 | 1.21 | 79.1 | 12.3 |
| J100902071343 | 0.2278 | 63.9 | 1.39 | 66.2 | 89.5 |
| J104116061016 | 0.4432 | 56.2 | 2.81 | 49.8 | 4.2 |
| J111908211918 | 0.1380 | 137.9 | 2.21 | 26.3 | 34.4 |
| J113327032719 | 0.1545 | 55.6 | 1.53 | 23.5 | 56.0 |
| J113910135043 | 0.2044 | 93.1 | 2.30 | 83.4 | 5.8 |
| J113910135043 | 0.2123 | 174.8 | 2.10 | 84.9 | 80.4 |
| J113910135043 | 0.2198 | 121.9 | 2.42 | 85.0 | 44.9 |
| J113910135043 | 0.3191 | 73.2 | 1.60 | 83.3 | 39.0 |
| J123304003134 | 0.3185 | 88.9 | 1.63 | 38.6 | 17.0 |
| J124154572107 | 0.2053 | 21.1 | 1.67 | 56.4 | 77.6 |
| J124154572107 | 0.2178 | 94.5 | 1.80 | 17.4 | 62.9 |
| J124410172104 | 0.5504 | 21.2 | 1.34 | 31.6 | 20.1 |
| J130112590206 | 0.1967 | 135.4 | 1.87 | 80.7 | 39.7 |
| J131956272808 | 0.6610 | 103.8 | 1.45 | 65.8 | 86.6 |
| J132222464546 | 0.2142 | 38.5 | 2.33 | 57.8 | 13.8 |
| J134251005345 | 0.2270 | 35.2 | 1.86 | 0.1 | 13.1 |
| J135704191907 | 0.4592 | 45.4 | 1.40 | 24.7 | 64.2 |
| J155504362847 | 0.1893 | 33.4 | 1.69 | 51.8 | 47.0 |
| J213135120704 | 0.4300 | 48.4 | 2.06 | 48.3 | 14.9 |
| J225357160853 | 0.3529 | 203.1 | 1.30 | 36.7 | 88.7 |
We have modified the Kacprzak15 sample slightly in a few cases. The sample we use is summarized in Table 1, and the changes are as follows. The J121920 absorber–galaxy pair is excluded here due to a highly uncertain azimuthal angle measurement. We calculated galaxy colors for two additional galaxies using magnitudes obtained from NED111https://ned.ipac.caltech.edu/: J100402 () and J111908 (). Lastly, the colors quoted by Kacprzak15 for the J045608 galaxies are transposed in their Table 2; the values are published correctly in Nielsen et al. (2013b).
After followup observations with ESI/Keck spectra, we found that the impact parameters of the two J12330031 galaxies ( and ) reported by Werk et al. (2012) appear to be transposed. The galaxy, which is included here, is located at kpc rather than kpc. This error is propagated in Kacprzak15, and the reported inclination and azimuthal angle measurements should be and , respectively. This, however, does not significantly change their results. We also later found that one of the galaxies listed in the Kacprzak15 sample is located in a group environment: Q0122003, , with a neighboring galaxy at . It is also listed in the MAGiiCAT sample as an isolated galaxy, though we do not have a HIRES or UVES quasar spectrum for the associated absorber so it is not included in the MAGiiCAT IV or V analyses. For the work presented here, we do not use this galaxy and have moved it to a group sample for later analysis.
Each of the 29 galaxies in our sample was imaged with WFPC2, WFC3, or ACS on the Hubble Space Telescope (HST) and their morphological properties were modeled using GIM2D (Simard et al., 2002). Full details of the galaxies and their modeling are described in Kacprzak15. We define an inclination of as face-on and as edge-on. An azimuthal angle of indicates that the background quasar sightline is aligned with the projected galaxy major axis, and indicates the sightline is aligned with the projected galaxy minor axis.
Galaxy colors from Kacprzak15, plus an additional color obtained from NED, were converted to colors following similar methods described in Nielsen et al. (2013b, MAGiiCAT I) for direct comparison to the Mgii sample studied in MAGiiCAT IV and V, which uses colors. Colors for each galaxy spectral energy distribution (SED) were calculated and we obtained a linear least-squares fit of to the galaxy SED colors. We then applied this relation to the colors to have a uniform set of colors, and the new values are listed in Table 1.
In order to examine the absorber kinematics for galaxies as a function of different baryon cycle processes and star formation rates, we form various subsamples by using the median galaxy property values of the sample. For the orientation measurements, these values are and . Using the average inclination of galaxies in the universe, as was done in MAGiiCAT V, is not feasible here because the subsample sizes with that cut would not be balanced. The uncertainties on the orientation measurements are small enough such that only one galaxy could potentially shift from being assigned to the minor axis subsample to being assigned to the major axis subsample, and only two galaxies could shift from face-on to edge-on.
The median galaxy color of the sample is . This value is used to compare between galaxies that are more likely to be star-forming or passive rather than with galaxy morphological types or with the color bimodality of galaxies in the universe. Comparing the absorption associated with blue galaxies to that associated with red galaxies is important because previous work has shown that the equivalent widths (which depend on the velocity width and column density of the gas) of low-ionization Mgii absorbers depend on some measure of the star formation rate (e.g., Zibetti et al., 2007; Bordoloi et al., 2011; Rubin et al., 2014). Tumlinson et al. (2011) found that Ovi, which is the focus here, also depends on the SFR of the host galaxy, where star-forming galaxies nearly always have detected absorption and passive galaxies rarely have detected absorption. Since we do not currently have star formation rates, we rely on galaxy color as a proxy for comparison to the Tumlinson sample.
The cut used here, , is roughly consistent with the boundary between star-forming Ovi absorbing galaxies and passive Ovi non-absorbing galaxies. Kacprzak15 show that the boundary between mostly Ovi absorbing and mostly Ovi non-absorbing galaxies is roughly at (same for ). While Kacprzak15 do not have the star formation rates of the galaxies, this cut is consistent with Tumlinson et al. (2011).
The subsample cuts, median redshift, and number of galaxies in each subsample are listed in Table 2. We also list the subsample cuts for the Mgii subsamples from MAGiiCAT IV and V for comparison.
There are no significant correlations between galaxy properties in the sample. There are also no biases with azimuthal angle or inclination; a one-dimensional Kolmogorov–Smirnov (KS) test reports that the azimuthal angles and inclinations of the galaxies are consistent with unbiased samples at the and levels, respectively.
2.2. Quasar Spectra
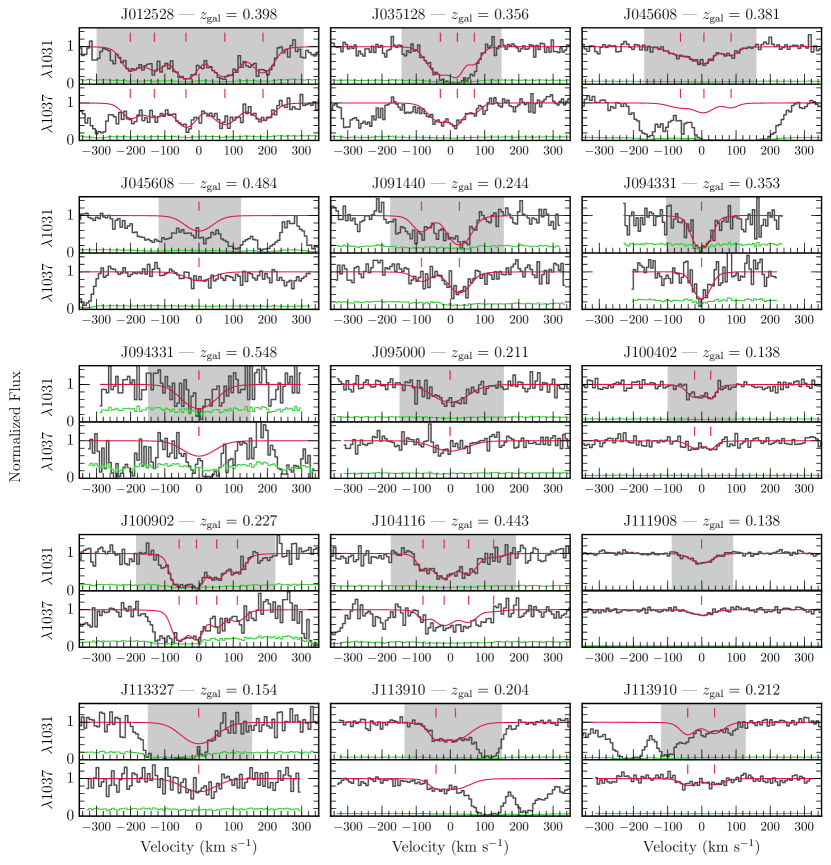
The galaxies described in the previous section are associated with absorption in 23 quasars. Each quasar has a medium resolution (,000, FWHM km s-1) spectrum from COS/HST, which covers the detected Ovi doublet at the redshifts of the targeted galaxies. Full details of the spectra, their reduction, and the modeling of absorption are listed in Kacprzak15. Each Ovi doublet was Voigt profile (VP) fitted, simultaneously when possible to account for blends, using VPFIT.222http://www.ast.cam.ac.uk/rfc/vpfit.html Velocity zero points (i.e., ) were defined as the median velocity of the optical depth distribution of absorption for the Ovi line. The Ovi absorption doublets for the absorber–galaxy pairs are plotted in Figure 1.
The velocity range of each absorber was determined by finding the velocity or wavelength at which the VP model spectrum (rather than the actual spectrum) decreases by 1% from the continuum level. Using the VP model to define the velocity ranges is necessary since several Ovi absorbers are blended with other ions and the spectra are more noisy than the HIRES or UVES spectra for Mgii. For our analysis, we use only those pixels within these velocity bounds, which are plotted as gray shaded regions in the panels of Figure 1.
This method is simpler than the method used for Mgii because the Ovi absorbers have a less complex absorption profile; the Ovi absorbers generally consist of a single broad “kinematic subsystem” while Mgii may be composed of multiple kinematic subsystems (e.g., Churchill & Vogt, 2001, MAGiiCAT IV, V). Only one Ovi absorber (J121920) has two kinematic subsystems, but we exclude this absorber from our analysis because the associated galaxy has a highly uncertain azimuthal angle measurement. When we use this velocity range determination method on the Mgii absorbers from MAGiiCAT IV and V, we find comparable, or more conservative ranges (i.e., velocities closer to km s-1) compared to our previous method in nearly all cases. Thus, the different methods do not produce drastically different results, and our simpler method may actually slightly underestimate the velocity extents of the Ovi kinematics compared to Mgii.
2.3. The Mgii Comparison Sample
We compare the Ovi absorber kinematics to the Mgii absorber kinematics published in MAGiiCAT IV and V. Here we briefly describe the Mgii sample and refer the reader to the MAGiiCAT series papers for further details (Nielsen et al., 2013a, b, 2015, 2016; Churchill et al., 2013).
We use a subset of 30 absorber–galaxy pairs with Mgii absorption from the Mgii Absorber–Galaxy Catalog (MAGiiCAT). All of these galaxies have spectroscopic redshifts (, ), colors (), and Mgii absorption detected in high-resolution background quasar spectra (HIRES/Keck or UVES/VLT) within a projected distance of kpc ( kpc). Additionally, all galaxies have HST images with which the orientations have been measured using GIM2D (Kacprzak et al., 2011b, 2012). Of the 30 Mgii absorber–galaxy pairs, only seven have associated Ovi absorption and overlap with the Ovi sample presented in Section 2.1. Note that the absorber–galaxy pairs in this MAGiiCAT sample have higher redshifts, bluer colors, and smaller impact parameters on average than our main Ovi sample.
Subsamples for the Mgii sample are determined by the median galaxy color of , as well as orientation measurements of (the mean inclination of galaxies in the universe), and . These values and the subsample sizes are tabulated in Table 2 and are further described in MAGiiCAT IV and V.
The absorption kinematics for the Mgii sample have already been fully analyzed in MAGiiCAT IV and V. We present these kinematics here for comparison, but do not present any new results.
2.4. Pixel-velocity TPCFs
To examine the absorber kinematics as a function of galaxy properties, we use the pixel-velocity TPCF method described in detail in MAGiiCAT IV and V. A summary of the method follows.
The pixel-velocity TPCF is calculated by first obtaining the velocities of all pixels within the velocity bounds of detected absorption for a subsample. A velocity of km s-1 corresponds to the optical depth-weighted median of absorption and defines the absorption redshift, . The pixel velocities for all absorbers in a subsample are pooled together as if they came from a single absorber hosted by a galaxy of a certain type, e.g., blue galaxies probed along the projected minor axis. Velocity separations between each pixel pair, without duplications, are then calculated for this pool. The absolute value of these velocity separations are then binned into 20 km s-1 wide bins, which is comparable to the FWHM of COS/HST. The count in each bin is normalized by the total number of pixel velocity pairs in the subsample to account for varying subsamples sizes when comparing between subsamples. The pixel-velocity TPCF is thus a probability distribution function and provides a statistical view of the absorber velocity dispersion for a given galaxy subsample.
Uncertainties in the TPCFs are calculated using a bootstrap analysis with 100 realizations. The uncertainties reported are deviations from the mean of the bootstrap realizations, which allow for asymmetrical uncertainties around the true TPCFs.
To compare TPCFs between subsamples, we perform a chi-squared test, taking into account the uncertainties in the TPCFs. We also report and values, i.e., the velocity separation within which 50% and 90% of the area under the TPCF curve is contained, for each TPCF to help describe where two TPCFs differ in more detail than the chi-squared test provides. These values are tabulated in Table 2. The uncertainties on and are calculated from the bootstrap realizations, similar to the TPCF uncertainties.
The bin sizes for the TPCFs presented here are twice as large as the TPCFs presented with Mgii (MAGiiCAT IV and V) due to a coarser spectral resolution in the COS spectra compared to HIRES spectra. To test the effect that changing the TPCF bin sizes had, we reran the Mgii TPCFs from MAGiiCAT IV and V with the 20 km s-1 bin widths. With larger bin sizes, the general Mgii TPCF results remained unchanged. These coarser Mgii TPCFs are presented with the Ovi TPCFs for comparison between ions.
3. Results
3.1. Full Sample
3.1.1 Sample Distribution
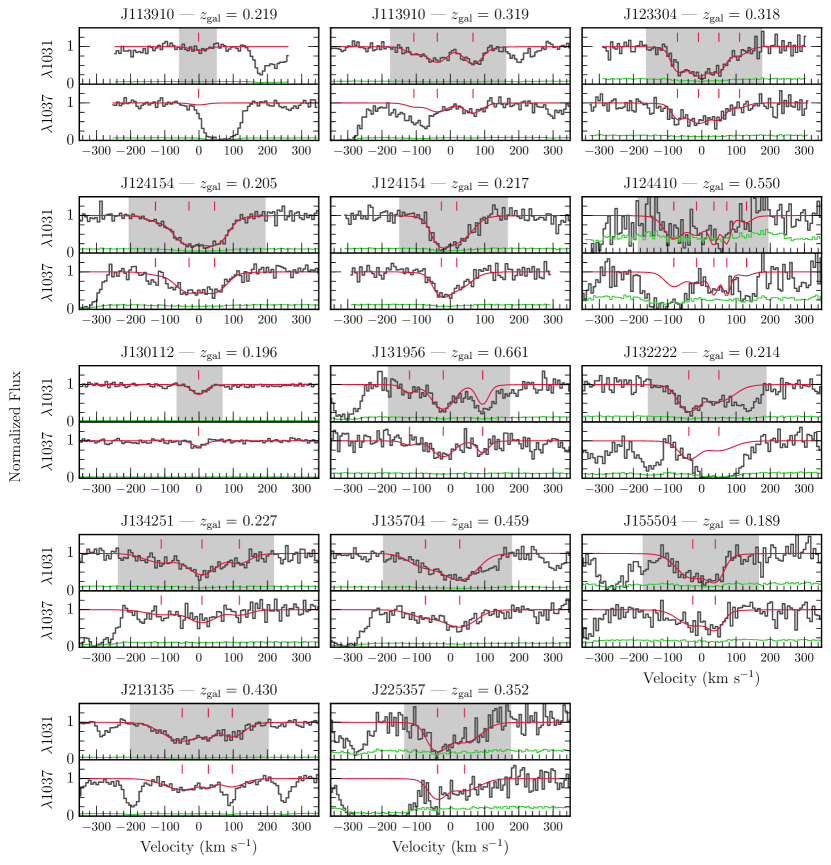
The distribution of both Ovi and Mgii absorbers as a function of their orientation relative to the host galaxy is plotted in Figure 2. Panel (a) presents the azimuthal angle versus impact parameter of each absorber–galaxy pair. The galaxy for each pair is located at kpc, with the major axis aligned with . Points represent the location of the background quasar sightline. Point sizes indicate the velocity width of absorption, i.e., the difference between the extremes of the gray shaded regions in Figure 1. Point sizes can be compared between ions as both are normalized to the maximum velocity spread of the Ovi absorbers.
There is an overlap of seven absorber–galaxy pairs between the Mgii and Ovi samples. These are presented as orange points on top of purple. We note that although the overlapping points (the differing ions) are plotted in the same locations, their values can differ by up to roughly km s-1(for the Mgii profiles, see Kacprzak et al., 2011b). The smallest velocity separation between the for the two ions is 27 km s-1. Given that is the optical depth weighted median of absorption, this indicates that the absorption is distributed differently along the line of sight between the two ions.
The azimuthal angle behavior of the samples discussed in detail by Kacprzak et al. (2012) (Mgii) and Kacprzak15 (Ovi) appears to be present in this plot, though the trend is less obvious here. This is likely because we only present a subset of the Mgii sample studied by Kacprzak et al. (2012). There is a population of absorbers for both ions within of the major axis, a slight gap, and then another, larger population at . Interestingly, the group of three Ovi absorbers located at kpc and appear to have smaller point sizes than the rest of the Ovi absorbers. As shown in Kacprzak15, the frequency of “non-detections” in Ovi ( Å) is largest between . In fact, these three points have Å, the only absorbers with equivalent widths this low in the sample presented here. We refrain from investigating the azimuthal angle distribution preferences of the absorbers further as these were examined previously.
Figure 2(b) presents the impact parameter, , as a function of inclination, , for the Mgii and Ovi samples. Point sizes again represent the velocity width of absorption. The vertical dashed lines represent the inclinations by which we slice the sample into “face-on” () and “edge-on” () subsamples. For the Mgii sample, we used the mean inclination of galaxies in the universe, whereas here we use the median inclination of the Ovi absorbers to even out subsample sizes. The Mgii absorbers appear to have a larger variation in their point sizes (velocity spreads) than Ovi, though this is subtle. Also difficult to discern is the dependence of the point sizes on , , and . We use the pixel-velocity TPCFs to examine these differences in more detail below.
3.1.2 Pixel-velocity TPCFs
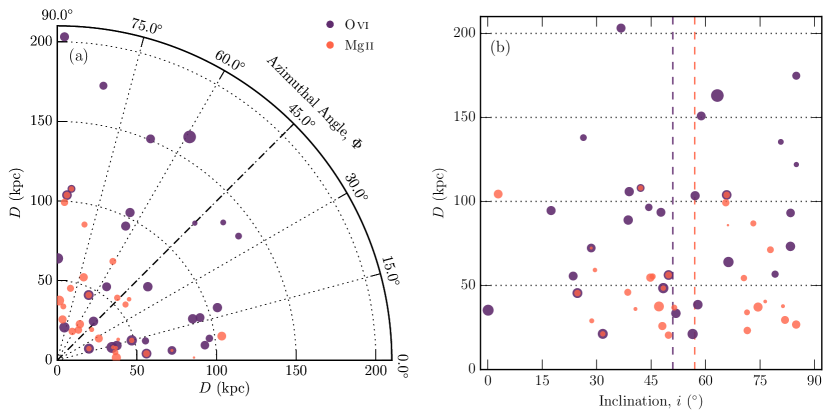
As a first comparison of the kinematics between the different ions, the TPCF for the full sample of Ovi absorbers is plotted as a thick purple line with shading representing errors in Figure 3. The full sample of Mgii absorbers with the same binning is plotted as the thin orange line with shading representing errors. The velocity dispersion of Ovi tends to be large, with pixel velocity separations up to km s-1. This is in contrast to the more narrow Mgii TPCF. Compared to Mgii, and for Ovi are roughly 50% and 40% larger, respectively.
It is important to keep in mind that our Ovi sample of galaxies is located at lower redshifts (), is probed at greater distances on average ( kpc, as shown in Figure 2), and has redder colors () than the Mgii galaxies. We discuss these differences in Section 4. For easy comparison between the two ions, the subsample cuts and sizes for each ion are listed in Table 2 for the rest of the presented results.
| Ovi | MgiiaaThe Mgii data, analysis, results, and conclusions are published in Nielsen et al. (2015) and Nielsen et al. (2016), and references therein | |||||||||
|---|---|---|---|---|---|---|---|---|---|---|
| Sample | Cut | Cut | # Gals | bbkm s-1 | bbkm s-1 | Cut | Cut | # Gals | ||
| Figure 3 | ||||||||||
| All Mgii AbsorbersaaThe Mgii data, analysis, results, and conclusions are published in Nielsen et al. (2015) and Nielsen et al. (2016), and references therein | 0.656 ccValues listed are for Mgii absorbers | 30 ccValues listed are for Mgii absorbers | ccValues listed are for Mgii absorbers | ccValues listed are for Mgii absorbers | ||||||
| All Ovi Absorbers | 0.244 | 29 | ||||||||
| Figure 4 | ||||||||||
| Blue–Major Axis | 0.319 | 7 | 5 | |||||||
| Blue–Minor Axis | 0.459 | 7 | 10 | |||||||
| Red–Major Axis | 0.214 | 9 | 10 | |||||||
| Red–Minor Axis | 0.215 | 6 | 5 | |||||||
| Figure 5 | ||||||||||
| Blue–Face-on | 0.353 | 9 | 8 | |||||||
| Blue–Edge-on | 0.319 | 5 | 7 | |||||||
| Red–Face-on | 0.222 | 6 | 9 | |||||||
| Red–Edge-on | 0.212 | 9 | 6 | |||||||
| Figure 6 | ||||||||||
| Face-on–Major Axis | 0.336 | 10 | 10 | |||||||
| Face-on–Minor Axis | 0.353 | 5 | 7 | |||||||
| Edge-on–Major Axis | 0.209 | 6 | 5 | |||||||
| Edge-on–Minor Axis | 0.305 | 8 | 8 | |||||||
3.2. Color and Orientation
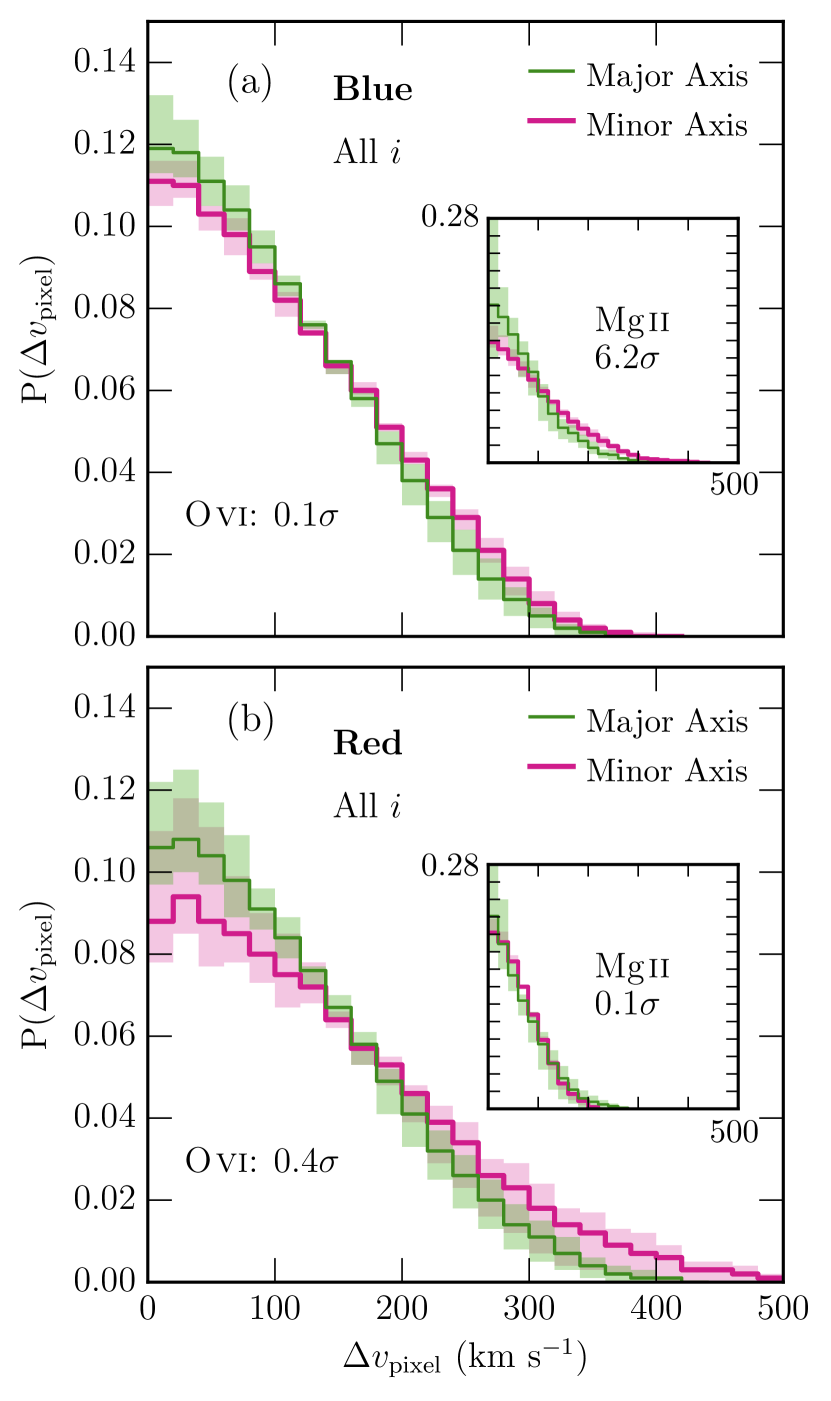
The TPCFs of blue galaxies (panel (a)) and red galaxies (panel (b)) probed along the projected major and minor axes are plotted in Figure 4. There are no differences in the Ovi TPCFs for either panel ( and ) and and for each subsample pair are all consistent within uncertainties. For the subsample pairs not shown, the chi-squared results are (major axis, blue vs. red galaxies) and (minor axis, blue vs. red galaxies). The slightly (but not significantly) larger velocity separation tail for red galaxies in Figure 4(b) is due to a single absorber with Å, which is an outlier in equivalent width for the sample. This unusually strong Ovi equivalent width absorber was studied in detail by Muzahid et al. (2015), who associated the absorption with a large-scale outflow. Removing this absorber does not change the conclusions drawn from the TPCFs. The TPCFs of the Mgii absorbers for the same subsamples (MAGiiCAT V, inset panels) are comparatively more narrow, with the exception of the blue, minor axis subsample in panel (a), which has a velocity dispersion similar to the Ovi.
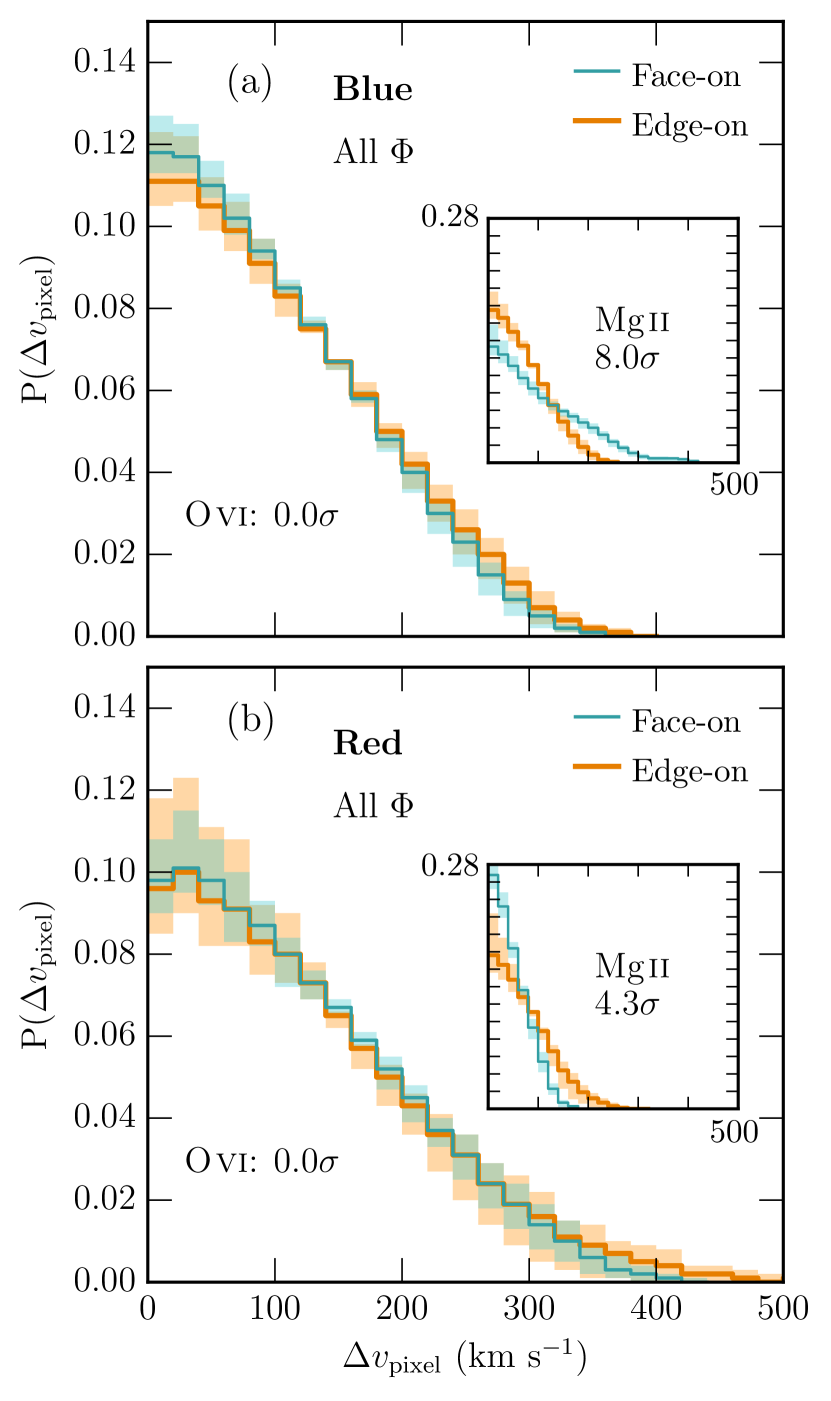
For the TPCFs in Figure 5, which compare face-on and edge-on inclinations for blue galaxies (panel (a)) and red galaxies (panel (b)), there are again no differences in the velocity dispersions for each subsample pair ( for all pairs). The and are also all consistent within uncertainties, and the conclusions do not change when the large equivalent width absorber is removed from the sample. In comparison, while the Mgii TPCFs (published in MAGiiCAT V, inset panels) for edge-on subsamples are consistent within uncertainties, similar to the behavior of Ovi, they have smaller velocity dispersions than Ovi. While the Mgii TPCF for the red, face-on galaxy subsample is also much more narrow than Ovi, the Mgii TPCF for the blue, face-on galaxy subsample is comparable to Ovi.
These results indicate that the kinematics of Ovi absorbers do not depend strongly on galaxy color or star formation activity for various inclinations and azimuthal angles, in contrast to Mgii absorbers as we found in MAGiiCAT V.
3.3. Inclination and Azimuthal Angle
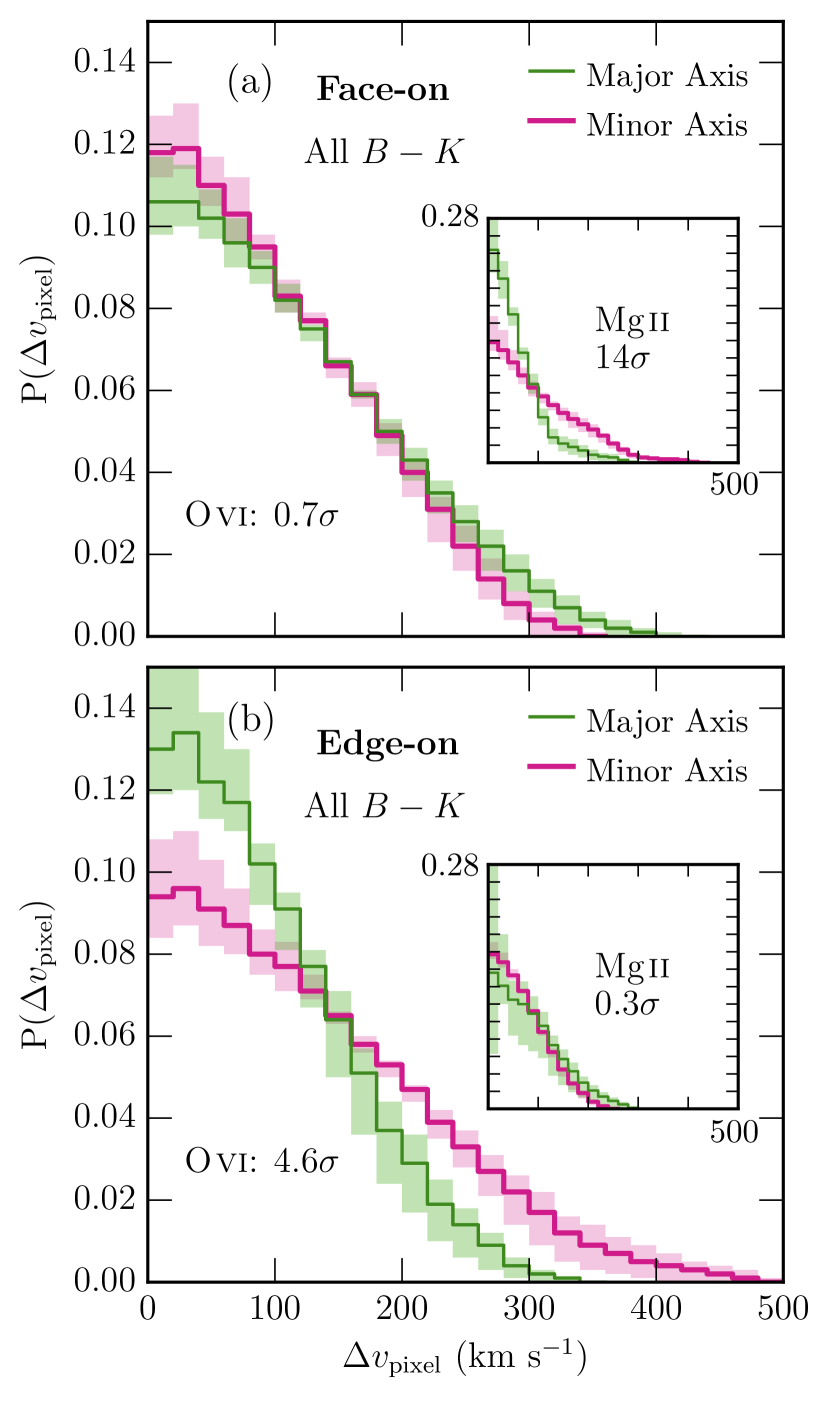
For face-on galaxies in Figure 6(a), we find no differences () in the Ovi TPCFs for galaxies probed along the projected major or minor axes. The and are consistent within uncertainties. This is in contrast to the Mgii results from MAGiiCAT V (inset panels), where face-on, major axis galaxies host absorbers with much smaller velocity dispersions. The face-on, minor axis Mgii TPCF is comparable to the Ovi TPCF.
Conversely, we find significant differences in the Ovi TPCFs for edge-on galaxies probed along the major and minor axes in Figure 6(b). Galaxies probed along the minor axis have larger velocity dispersions than those probed along the major axis, and this result is significant at the level. Both and for these samples are inconsistent within uncertainties. A moderate portion of this difference is caused by the Å absorber (an edge-on, minor axis galaxy; Muzahid et al., 2015); however, removing the absorber from the sample still results in a significance of , though the scatter on the edge-on, minor axis subsample is significantly reduced. This result is in contrast to our previously published results with Mgii (MAGiiCAT V, inset panels), which have TPCFs consistent within uncertainties. The edge-on, major axis subsample for Ovi is comparable to the Mgii subsamples.
For face-on and edge-on galaxies probed along the major axis (not plotted), we find an insignificant difference of where face-on galaxies tend to have a slightly larger velocity spread than edge-on galaxies. This behavior is opposite what we found in Mgii (MAGiiCAT V), though the edge-on Mgii subsample has a velocity dispersion comparable to the same Ovi subsample.
Finally, for galaxies probed along the minor axis (not plotted), we find a significant difference () between the TPCFs of face-on and edge-on galaxies, where absorbers hosted by edge-on galaxies tend to have larger velocity spreads. However, the significance decreases to when we remove the outlying Å absorber. This behavior is also opposite what we found with Mgii. As stated above, the Mgii face-on, minor axis subsample is comparable to Ovi.
As we showed in the previous paragraphs, removing the outlying large equivalent width absorber does not change the results in one comparison (Figure 6(b)), but removes the significant difference in another (minor axis, face-on vs edge-on subsamples). This results from the combination that the edge-on, major axis subsample TPCF is slightly more narrow than the rest of the subsamples, but the uncertainties are large enough to overlap with the face-on subsamples, and the uncertainties on the edge-on, minor axis subsample are reduced when the outlier is removed. Given this, we make the assumption that there are no kinematic differences between these subsamples when the outlying large equivalent width absorber is not included. We also note that a larger sample size would be beneficial in either reducing the uncertainties on the kinematics for the edge-on subsamples along the major and minor axes, or showing more strongly that there is a large variation in the velocity dispersions for these subsamples.
4. Discussion
As we have shown in the previous sections, the kinematics of Ovi absorbers are similar regardless of galaxy color, azimuthal angle, and inclination. Compared to our previously published Mgii TPCFs (MAGiiCAT IV and V), the Ovi TPCFs are more extended and are much less sensitive to the galaxy properties. In subsamples where we expect outflows to dominate the absorption, Mgii and Ovi TPCFs are comparable.
The larger velocity spreads for Ovi than Mgii for nearly all subsamples may be explained if Ovi is collisionally ionized. In this case, Ovi absorption profiles would be broader than Mgii. However, the contrasts between the two ion samples still seem a bit puzzling. If the two ions trace the same gas, then the relative behavior of the TPCFs between the ions should be similar as they are the result of the same baryon cycle processes, i.e., in Figure 5(a), the face-on subsample should be more extended than the edge-on subsample for both Ovi and Mgii, but this is not the case. If we assume that this scenario is true (we show later that it likely is not), we can examine the several differences between the two samples that may be contributing to our TPCF results.
The Ovi sample probes the CGM at larger impact parameters on average ( kpc) than the Mgii sample ( kpc; see Figure 2; MAGiiCAT IV and V). Simulations by Oppenheimer et al. (2016) show an age–radius anti-correlation with Ovi absorption, where the time since the gas was ejected from the galaxy via outflows increases with increasing radii. The lack of a kinematic dependence on orientation in the Ovi sample TPCFs may then be a result of the absorbers being located further away from the galaxy, and thus less dependent on the current star formation activity than for the Mgii sample. This is strengthened by the finding that the Ovi TPCFs show similar behaviors for both blue and red galaxies.
The galaxies hosting Ovi absorbers tend to be redder than Mgii host galaxies, with and , respectively. For Mgii, the kinematics of absorbers around redder galaxies are less sensitive to the orientation at which they are located than they are for blue galaxies (for example, see the inset TPCFs in Figures 4 and 5; also see MAGiiCAT V). Additionally, redder galaxies tend to have lower star formation rates and, consequently, are not expected to have active outflows or accretion. Given this, we would expect less of an orientation dependence for the Ovi absorbers because they are redder galaxies on average than the Mgii sample, which does show an orientation dependence.
The redshift distributions of the two samples are also different. While the galaxies for the Mgii sample were located at a median redshift of (), the Ovi sample has a median of (). In this case, the lower redshift galaxies have lower star formation rates (they tend to be redder), and thus have a less active baryon cycle than at higher redshifts. This would result in a weaker dependence of the absorber kinematics on galaxy orientation for the lower redshift Ovi sample. Kacprzak et al. (2011a) reported the fraction of systems where Mgii absorption velocities were in alignment with the galaxy rotation direction. They found that this fraction decreases by a factor of two from to . Furthermore, they report a factor of three increase at compared to for Mgii absorption spanning both sides of the galaxy systemic velocity. It is possible that CGM kinematics may evolve with redshift; however, we have yet to explore the Mgii TPCFs in the lower redshift range probed by the Ovi sample because of the lack of high-resolution spectra.
While the differences between the two samples listed above probably do have some effect on our results, we do not think they dominate. The discussion above mostly assumes that Ovi and Mgii trace the same components of the CGM. However, it is more likely that, with their differing ionization states and kinematics, the two ions trace different components of the CGM. This is supported by both observations (e.g., Werk et al., 2013; Muzahid et al., 2015) and simulations (e.g., Ford et al., 2014; Churchill et al., 2015). Even for the overlapping seven galaxies in the Mgii and Ovi samples with absorption in both ions, the two ions are offset in (defined as the optical depth-weighted median of the absorption) by as little as km s-1 or as great as km s-1. These seven absorbers show that the distribution of the gas is different in velocity space between ions.
Using roughly the same sample we use here, Kacprzak15 showed that Ovi absorption is preferentially distributed along the major and minor axes of the host galaxies, with non-detected Ovi sightlines primarily located between the major and minor axes. The authors suggested that Ovi is not mixed throughout the CGM and is confined into outflows along the minor axis and inflows or recycled gas along the major axis. They also showed that the Ovi equivalent widths were stronger along the projected minor axis than along the major axis, suggesting that either the column densities, the velocity spreads, or both are larger for absorbers located along the minor axis. These results seem contrary to what we find here with the kinematics.
Since the kinematics of the Ovi absorbers are roughly consistent for all galaxy color and orientation combinations, this suggests that Ovi may not trace different baryon cycle processes. In simulations, Ford et al. (2014) found that Ovi traces gas that was ejected from the galaxy by ancient outflows many Gyr prior to the current epoch, some of which is likely reaccreting onto the galaxy at the time of the mock observations. If this is the case, then the absorbing gas may have plenty of time to mix and form a roughly kinematically uniform Ovi halo at all locations about the galaxy. The sizes of Ovi absorbers are also predicted to be large, on the order of tens to hundreds of kiloparsecs from photoionization modeling (Lopez et al., 2007; Muzahid, 2014; Hussain et al., 2015), so any kinematic differences with galaxy orientation may be wiped out by the large cloud sizes. This is in contrast to the small, pc cloud sizes expected for Mgii (e.g., Rigby et al., 2002; Crighton et al., 2015). A kinematically uniform Ovi halo is therefore reasonable.
The combination of consistent absorber kinematics with orientation and color, the low fraction of absorbing gas in intermediate azimuthal angles from Kacprzak15, and absorption concentrated near the major and minor axes may be the result of differing ionization conditions throughout the CGM. Ovi absorbing gas that is located in the intermediate azimuthal angles may be more susceptible to being ionized out of the Ovi phase due to lower densities, resulting in lower equivalent widths (or upper limits on the equivalent width) and lower covering fractions. Conversely, higher gas densities due to outflows and inflows along the minor and major axes, respectively, may shield the oxygen from being ionized out of the Ovi ionization state and provide more suitable conditions for Ovi. If so, higher ionization phases of oxygen may show an orientation dependence in covering fraction and equivalent width, with possibly a higher incidence of gas in the intermediate azimuthal angles when compared to Ovi.
5. Summary and Conclusions
Using an absorption-selected sample of 29 galaxies () from Kacprzak15, we examined the velocity dispersion of Ovi absorption as a function of galaxy color, inclination, and azimuthal angle. Each absorber–galaxy pair was identified as part of the “Multiphase Galaxy Halos” survey (e.g., Kacprzak15, Muzahid et al., 2015, 2016) or obtained from the literature. The galaxies were found within kpc of a background quasar sightline and have redshifts consistent with detected Ovi absorption in HST/COS quasar spectra. Each galaxy is isolated, with no nearby neighbors within 100 kpc and a line-of-sight velocity separation of 500 km s-1. Galaxies were modeled using GIM2D to obtain their inclinations, morphologies, and the azimuthal angle at which the background quasar probes the CGM relative to the projected galaxy major axis. We use the pixel-velocity TPCF method described in MAGiiCAT IV and V for Mgii on our Ovi absorbers, and compare the results between both Mgii from our previous work and the Ovi here. Our findings include the following:
-
1.
In general, the Ovi TPCFs are more extended than for Mgii, which is expected if the Ovi is collisionally ionized. In orientations in which outflows are expected, such as blue, face-on galaxies probed along the minor axis, the TPCFs are comparable between ions and show similar velocity dispersions.
-
2.
Given the vastly different kinematics of the Ovi absorbers compared to Mgii, it is very likely that the two ions trace different components of the CGM. In fact, the seven galaxies that have both detected Ovi and Mgii show values of (optical depth-weighted median of absorption) that can be offset by up to 100 km s-1.
-
3.
The Ovi absorbers have similar velocity dispersions (Chi-squared test result of ) regardless of galaxy color, inclination angle, and azimuthal angle, indicating that the gas is not strongly influenced by the present star formation activity in the galaxy (i.e., possibly deposited into the CGM by “ancient outflows”). This is despite the findings of Kacprzak15 that Ovi is preferentially observed along the projected major and minor axes of galaxies, which are frequently associated with accretion and outflows, respectively.
-
4.
The TPCF of the minor axis, edge-on subsample (likely dominated by outflowing material) may be more extended than the major axis, edge-on subsample (). This large velocity separation tail is mostly due to a single large equivalent width absorber with a large velocity spread, which is classified as a large-scale galactic outflow by Muzahid et al. (2015). Removing the outlier still results in a significant difference (), however this significance is driven more by the major axis, edge-on subsample TPCF being slightly more narrow. Thus, the significant differences found in Figure 6 are likely not real.
-
5.
The uniform Ovi kinematics with galaxy color and orientation, and the azimuthal location preference of the Ovi absorbers point to ionization effects in the CGM. The gas giving rise to Ovi may be uniformly distributed throughout the CGM, but lower densities in intermediate azimuthal angles () where outflows and accretion are less likely to occur may result in the oxygen being ionized out of the Ovi phase.
To better understand how the kinematics of Mgii and Ovi compare, it would be useful to form a large sample of galaxies with both Ovi and Mgii absorption detected in high resolution quasar spectra. As our samples stand now, it is not straightforward to compare the two ion samples to each other due to differing galaxy property distributions for the separate absorbing samples. Measuring the multiphase kinematics for a set of galaxies like this is necessary for understanding the multiphase CGM.
Lastly, observing the CGM in higher ionization states as a function of galaxy properties is important if the azimuthal angle distribution of Ovi is mainly due to differing ionization conditions. The higher ionization states may also show an azimuthal preference, where the incidence rate of higher ionization absorbers may be larger in the intermediate azimuthal angles than Ovi. While it is not currently feasible to study ions such as Ovii and Oviii because they are located in the x-ray regime, Neviii is observable in the UV. This kinematics–galaxy orientation study could be done with Neviii once a large enough sample is obtained.
References
- Bordoloi et al. (2014a) Bordoloi, R., Lilly, S. J., Kacprzak, G. G., & Churchill, C. W. 2014a, ApJ, 784, 108
- Bordoloi et al. (2011) Bordoloi, R., Lilly, S. J., Knobel, C., et al. 2011, ApJ, 743, 10
- Bordoloi et al. (2014b) Bordoloi, R., Lilly, S. J., Hardmeier, E., et al. 2014b, ApJ, 794, 130
- Bouché et al. (2012) Bouché, N., Hohensee, W., Vargas, R., et al. 2012, MNRAS, 426, 801
- Bouché et al. (2013) Bouché, N., Murphy, M. T., Kacprzak, G. G., et al. 2013, Science, 341, 50
- Churchill et al. (2013) Churchill, C. W., Trujillo-Gomez, S., Nielsen, N. M., & Kacprzak, G. G. 2013, ApJ, 779, 87
- Churchill et al. (2015) Churchill, C. W., Vander Vliet, J. R., Trujillo-Gomez, S., Kacprzak, G. G., & Klypin, A. 2015, ApJ, 802, 10
- Churchill & Vogt (2001) Churchill, C. W., & Vogt, S. S. 2001, AJ, 122, 679
- Crighton et al. (2015) Crighton, N. H. M., Hennawi, J. F., Simcoe, R. A., et al. 2015, MNRAS, 446, 18
- Ford et al. (2014) Ford, A. B., Davé, R., Oppenheimer, B. D., et al. 2014, MNRAS, 444, 1260
- Hussain et al. (2015) Hussain, T., Muzahid, S., Narayanan, A., et al. 2015, MNRAS, 446, 2444
- Johnson et al. (2013) Johnson, S. D., Chen, H.-W., & Mulchaey, J. S. 2013, MNRAS, 434, 1765
- Johnson et al. (2015) —. 2015, MNRAS, 449, 3263
- Kacprzak et al. (2011a) Kacprzak, G. G., Churchill, C. W., Barton, E. J., & Cooke, J. 2011a, ApJ, 733, 105
- Kacprzak et al. (2010) Kacprzak, G. G., Churchill, C. W., Ceverino, D., et al. 2010, ApJ, 711, 533
- Kacprzak et al. (2011b) Kacprzak, G. G., Churchill, C. W., Evans, J. L., Murphy, M. T., & Steidel, C. C. 2011b, MNRAS, 416, 3118
- Kacprzak et al. (2012) Kacprzak, G. G., Churchill, C. W., & Nielsen, N. M. 2012, ApJ, 760, L7
- Kacprzak et al. (2015) Kacprzak, G. G., Muzahid, S., Churchill, C. W., Nielsen, N. M., & Charlton, J. C. 2015, ApJ, 815, 22
- Kacprzak et al. (2014) Kacprzak, G. G., Martin, C. L., Bouché, N., et al. 2014, ApJ, 792, L12
- Lan et al. (2014) Lan, T.-W., Ménard, B., & Zhu, G. 2014, ApJ, 795, 31
- Lilly et al. (2013) Lilly, S. J., Carollo, C. M., Pipino, A., Renzini, A., & Peng, Y. 2013, ApJ, 772, 119
- Lopez et al. (2007) Lopez, S., Ellison, S., D’Odorico, S., & Kim, T.-S. 2007, A&A, 469, 61
- Martin et al. (2012) Martin, C. L., Shapley, A. E., Coil, A. L., et al. 2012, ApJ, 760, 127
- Mathes et al. (2014) Mathes, N. L., Churchill, C. W., Kacprzak, G. G., et al. 2014, ApJ, 792, 128
- Muzahid (2014) Muzahid, S. 2014, ApJ, 784, 5
- Muzahid et al. (2016) Muzahid, S., Kacprzak, G. G., Charlton, J. C., & Churchill, C. W. 2016, ApJ, 823, 66
- Muzahid et al. (2015) Muzahid, S., Kacprzak, G. G., Churchill, C. W., et al. 2015, ApJ, 811, 132
- Nielsen et al. (2013a) Nielsen, N. M., Churchill, C. W., & Kacprzak, G. G. 2013a, ApJ, 776, 115
- Nielsen et al. (2013b) Nielsen, N. M., Churchill, C. W., Kacprzak, G. G., & Murphy, M. T. 2013b, ApJ, 776, 114
- Nielsen et al. (2015) Nielsen, N. M., Churchill, C. W., Kacprzak, G. G., Murphy, M. T., & Evans, J. L. 2015, ApJ, 812, 83
- Nielsen et al. (2016) —. 2016, ApJ, 818, 171
- Oppenheimer & Davé (2008) Oppenheimer, B. D., & Davé, R. 2008, MNRAS, 387, 577
- Oppenheimer et al. (2016) Oppenheimer, B. D., Crain, R. A., Schaye, J., et al. 2016, ArXiv e-prints
- Peeples et al. (2014) Peeples, M. S., Werk, J. K., Tumlinson, J., et al. 2014, ApJ, 786, 54
- Prochaska et al. (2011) Prochaska, J. X., Weiner, B., Chen, H.-W., Mulchaey, J., & Cooksey, K. 2011, ApJ, 740, 91
- Rigby et al. (2002) Rigby, J. R., Charlton, J. C., & Churchill, C. W. 2002, ApJ, 565, 743
- Rubin et al. (2012) Rubin, K. H. R., Prochaska, J. X., Koo, D. C., & Phillips, A. C. 2012, ApJ, 747, L26
- Rubin et al. (2014) Rubin, K. H. R., Prochaska, J. X., Koo, D. C., et al. 2014, ApJ, 794, 156
- Rubin et al. (2010) Rubin, K. H. R., Weiner, B. J., Koo, D. C., et al. 2010, ApJ, 719, 1503
- Savage et al. (2014) Savage, B. D., Kim, T.-S., Wakker, B. P., et al. 2014, ApJS, 212, 8
- Simard et al. (2002) Simard, L., Willmer, C. N. A., Vogt, N. P., et al. 2002, ApJS, 142, 1
- Steidel et al. (2002) Steidel, C. C., Kollmeier, J. A., Shapley, A. E., et al. 2002, ApJ, 570, 526
- Stewart et al. (2011) Stewart, K. R., Kaufmann, T., Bullock, J. S., et al. 2011, ApJ, 738, 39
- Stocke et al. (2013) Stocke, J. T., Keeney, B. A., Danforth, C. W., et al. 2013, ApJ, 763, 148
- Thom et al. (2011) Thom, C., Werk, J. K., Tumlinson, J., et al. 2011, ApJ, 736, 1
- Tumlinson et al. (2011) Tumlinson, J., Thom, C., Werk, J. K., et al. 2011, Science, 334, 948
- Wakker & Savage (2009) Wakker, B. P., & Savage, B. D. 2009, ApJS, 182, 378
- Werk et al. (2012) Werk, J. K., Prochaska, J. X., Thom, C., et al. 2012, ApJS, 198, 3
- Werk et al. (2013) —. 2013, ApJS, 204, 17
- Zibetti et al. (2007) Zibetti, S., Ménard, B., Nestor, D. B., et al. 2007, ApJ, 658, 161