2Sternberg Astronomical Institute, M.V.Lomonosov Moscow State University, Moscow, 119992 Russia
V. Afanasiev , A. Moiseev
ADAM Low- and Medium-Resolution Spectrograph for 1.6-m AZT-33IK Telescope
Abstract
We describe the design of a low- and medium-resolution spectrograph (–) developed at the Special Astrophysical Observatory of the Russian Academy of Sciences (SAO RAS) for the 1.6-m AZT-33IK telescope of Sayan Observatory of the Institute of Solar-Terrestrial Physics of the Siberian Branch of the Russian Academy of Sciences. We report the results of laboratory measurements of the parameters of the instrument and tests performed on the SAO RAS 1-m Zeiss-1000 telescope. We measured the total quantum efficiency of the “spectrograph + telescope + detector” system on AZT-33IK telescope, which at its maximum reaches 56%. Such a hight transparency of the spectrograph allows it to be used with the 1.6-m telescope to determine the types and redshifts of objects with magnitudes –, that was confirmed by actual observations.
1 Introduction
The capabilities of the spectroscopy of faint galaxies and stars on moderate-size telescopes with aperture diameters of 1–1.5 m are determined by the efficiency of the spectrographs employed. Despite their excellent optical quality the well-known universal commercial spectrographs manufactured by Boller & Chivens (Mack et al., 2010) and Carl Zeiss Jena (Geyer, 1975) have rather low transmission (15–20%). In the last three decades focal reducers based on refractive optics exclusively became very popular on large telescopes. The prototype of such devices is EFOSC camera of the 3.6-m ESO telescope (Buzzoni et al., 1984). At the end of the last century an efficient low- and medium-resolution DFOSC — Danish Faint Object Spectrograph and Camera (Andersen et al., 1995) spectrograph equipped with a focal reducer and similar to EFOSC was developed for the 1.54-m telescope at Copenhagen Observatory. The transmission of the optics of such a spectrograph exceeds 70%, and the total quantum efficiency of the “spectrograph + telescope + CCD” system is of about 30%. Since then nine such spectrographs have been made for small telescopes of various observatories. Note that the spectrographs mentioned above are multimode devices, which, in our opinion, is a justified solution in observations on large telescopes, where the observing process is strictly regulated. Multimode spectrographs have many optical elements, which reduce their efficiency and make their use on small telescopes unfeasible. It is more efficient to dedicate small telescopes with highly specialized equipment to single task. Currently, modern optical elements (new glass types, AR coatings, volume holographic gratings, etc.) and readily available commercial systems with highly efficient CCD make it in principle possible to make a low-resolution spectrograph with the efficiency greater than 50–60%.
In this paper we describe a low- and medium-resolution spectrograph (from to ) designed for the 1.6-m AZT-33IK telescope of Sayan Observatory of the Institute of Solar-Terrestrial Physics of the Siberian Division of the Russian Academy of Sciences. The device is intended for acquiring optical spectra of faint galaxies and stars within the framework of the program of ground-based support of “Spectrum–Rontgen–Gamma” space observatory.

2 Design of the instrument
When designing the spectrograph we took advantage of the experience obtained in the process of the development of SCORPIO (Afanasiev & Moiseev, 2005) and SCORPIO-2 (Afanasiev & Moiseev, 2011) instruments for the SAO RAS 6-m telescope, which are similar to EFOSC and which are remote-control oriented. In these instruments we for the first time in the practice of Russian astronomical instrument design used volume phased holographic gratings (Barden et al., 2000), which are 30–80% more efficient than usual ruled gratings.
The spectrograph that we developed is mounted on a controlled rotation stage in the Ritchey–Chretien focus (with the equivalent focal length of 30 m) of the 1.6-m AZT-33IK telescope. The instrument must have high transmission which, combined with a modern Deep Depletion CCD detector, will make it possible to acquire spectra of faint (down to ) starlike targets in the blue and red parts of the spectrum within reasonable exposure times. The spectrograph can also operate in the direct imaging mode to ensure accurate positioning of the target on the slit.
| Equivalent focal ratio | |
|---|---|
| Field of view | |
| Image scale | |
| Wavelength range | – Å |
| QE (telescope + | |
| spectrograph + CCD) | 56% |
| Spectral resolution | – Å |
| (for the -wide slit) | (–) |
∗ — maximum quantum efficiency
Note also that one of the crucial requirements to the spectrograph is that it should be capable of smooth operation at ambient temperatures ranging from C to C as determined by the climatic conditions of Sayan Observatory.
2.1 Optical Layout
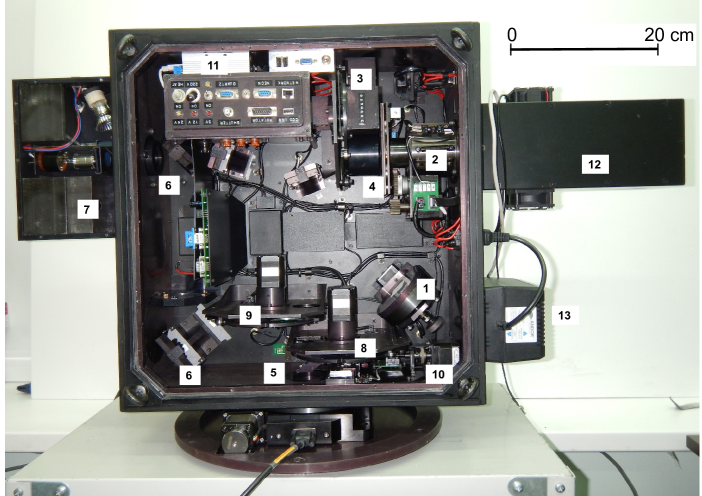
The spectrograph is assembled in accordance with the traditional scheme (Fig. 1): an off-axis mirror collimator forming the exit pupil in the parallel beam and a catadioptric lens camera. The collimator has the focal length of 500 mm and produces a 27-mm diameter exit pupil. Two additional flat beam bending mirrors are used to reduce the overall size of the instrument. The spectrograph camera consists of a three-component six-lens apochromat with a focal length of 109 mm with a geometric focal ratio of . The physical focal ratio—the ratio of the focal length of the camera to the diameter of the collimated beam—is equal to . Lenses have seven-layer antireflection coating applied to them, which operate in the 0.36–1 m wavelength interval and have a transmission coefficient of no less than 98%. Mirrors are coated with a reflective protected silver layer with a reflection coefficient of 99% throughout the entire operating wavelength interval. Antireflection and reflection coatings have been computed and applied at Opto-Technological Laboratory LTD111www.optotl.ru. The mechanical and optical parts of the spectrograph were manufactured at mechanical workshops of the Special Astrophysical Observatory of the Russian Academy of Sciences (SAO RAS). The detector employed is the NEWTON CCD system described below in Section 2.3. Table 1 lists the principal parameters of the spectrograph.
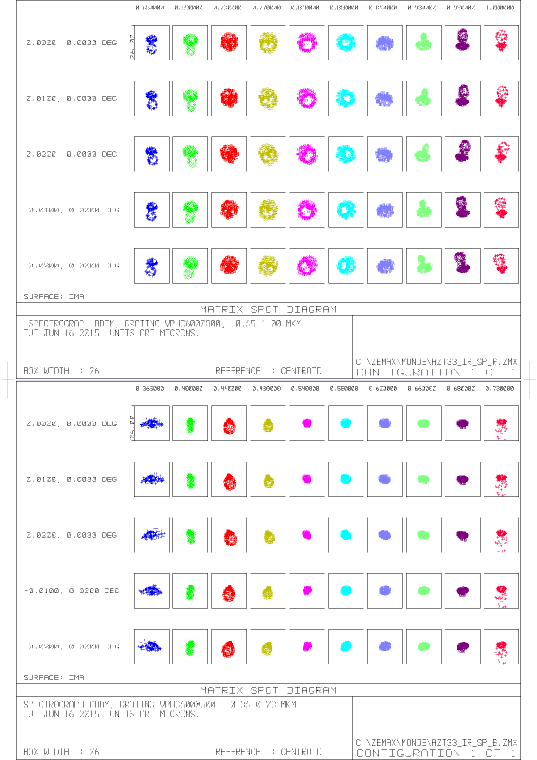
The equivalent focal length of the “telescope + spectrograph” system is 6584 mm, which corresponds to the image scale of 32 m arcsec-1 in the detector plane. The unvignetted field of view has the size of arcmin. The spectrograph uses volume holographic gratings as the dispersing elements. The parameters of these gratings are given below. The size of the circle of diffusion in the spectrograph does not exceed 15 m in the 0.35–1.0 m wavelength interval. Figure 2 shows the computed spot diagrams for two spectral intervals: the red and the blue.
The telecentric optical layout of the calibration unit consists of a two-lens condenser and a field lens, which produce images of the area illuminated by the calibration lamps at the exit pupil of the collimator.
2.2 Mechanical Design of the Spectrograph
The device is made in the form of a rigid duralumin case with several units attached to it:
-
CCD detector;
-
Calibration lamps unit;
-
Mechanism for introducing/withdrawing the diagonal mirror in front of the slit;
-
Slits wheel;
-
Filters wheel;
-
Grisms wheel;
-
Adjustable spherical collimator mirror;
-
Four flat mirrors and the field lens of the calibration unit;
-
Spectrograph camera focusing mechanism.
The following devices are also mounted inside the spectrograph: power supply sources, spectrograph control board, thermostat board, control computer, and spectrograph control panel. One of the spectrograph walls is removable to provide access to all optomechanical elements for adjustment and cleaning of optics. Figure 3 shows the layout of the elements inside the spectrograph. The weight of the spectrograph without the rotation stage and detector is 39 kg.
2.3 CCD Detector
As a detector ADAM uses NEWTON system of highly sensitive optical signal registration device manufactured by ANDOR222http://www.andor.com/ (Northern Ireland) based on a E2V CCD30-11 detector. The camera is connected to the control computer via USB-2 interface. Table 2 lists the principal parameters of the device according to the manufacturer’s specification sheet. The spectrograph control software allows setting the working temperature of the CCD, choose modes with different gains, readout speeds and noise. The data are stored as a standard 16-bit FITS files.
| Type | Thin, back illuminated |
|---|---|
| Format | |
| Pixel size | |
| QEmax | 95% |
| RON | 3.5 ( C) |
| Dark current | px-1 min.-1 |
| Gain, ADU-1 | 2.6 (high) |
| 5.2 (normal) | |
| 11 (low) |
∗ — minimal readout noise
The three-stage Peltier cooling system of the CCD camera provides a working temperature of C. Heat from the hot Peltier junction is removed by a liquid cooling system consisting of CW-3000 powerful commercial chiller and BC103 climate-control unit. The climate-control unit keeps the coolant (propylene glycol) temperature at a constant level. The working temperature of the coolant is –C, and it completely prevents any condensation effects on hoses used to transport the coolant liquid from the chiller to the CCD camera.
2.4 Calibration Unit
The output area of the calibration path is illuminated by two calibrating lamps: (1) a Ne-Ar-He filled lamp (hereafter referred to as the NEON lamp) with line spectrum to calibrate the wavelength scale and (2) continuum-spectrum lamp to produce the “flat field” (hereafter referred to as the FLAT lamp). A combination of SZS7 and SS1 filters is used to equalize the brightness of lines in the red and blue parts of the spectrum of the NEON lamp. The FLAT lamp is equipped with an SZS7 glass filter, which reduces the flux from the lamp at wavelengths longer than 5500 Å, which is necessary for generating more uniform detector illumination in the spectroscopic mode.
2.5 Slits
Wheel 1 contains holders with five slits for spectroscopic observations. The slit widths are strictly fixed and correspond to , , , , and sizes in the focal plane.
2.6 Filters
Wheel 2 allows mounting of five filters of diameter 50 mm and to 4 mm thickness. In one of the filter slots the OS11 filter is located, which cuts off the second order in observations with VPHG600R grism.
2.7 Diffraction Gratings
Wheel 3 contains mounts with three grisms (combination of a transparent diffraction grating and two prisms). The spectrograph uses volume phase holographic gratings manufactured by Wasatch Photonics333http://wasatchphotonics.com/. The parameters of the grisms are listed in Table 3.
| Name | lines/mm | wavelength range | dispersion | sp. resolution |
|---|---|---|---|---|
| Å | Å px-1 | (-slit) | ||
| VPHG300 | 300 | 3510–10300 | 6.4–7.6 | 273–678 |
| VPHG600G | 600 | 3590–7250 | 3.2–3.7 | 561–980 |
| VPHG600R | 600 | 6430–10030 | 3.2–3.6 | 1005–1319 |
2.8 Thermal Stabilization System
The spectrograph case is covered with heat-insulating material. The case of the suspended part of the spectrograph ensures thermal stabilization of the instrument at a level above C at ambient temperatures below 0C. Eight 2T907A transistors mounted on the base plate of the spectrograph case are used as heating elements. The bridge connection with a termistor-based temperature sensor is set so that a decrease of the case temperature below the given threshold causes the increase of the collector current of the transistors. The thermal stabilization system keeps the plate temperature constant to within several tenths of degree. The maximum power dissipated by the thermostat does not exceed 60 W.
2.9 Rotation Stage
The spectrograph is mounted on a Rotation Stage (Standa444http://www.standa.lt/, 8MR190-90-4247), which allows rotating the entire instrument about its axis in order to change position angle of the slit on the sky. The stage can be turned with a relative accuracy of about , which corresponds to one motor step. The zero point position is controlled by a Hall effect sensor. To prevent cable kinking, the control program allows the rotator to be turned only within relative to the zero position.
3 Control system
3.1 Control Electronics
The process of observation includes the transition from direct image mode to the spectroscopic mode, change of filters, grisms, switching on and off calibration lamps, etc. This is what the built-in control system of the spectrograph does. Its “brain” is an ARK-1122F industrial computer manufactured by Advantech. Computer commands are received by Atmega8535 microprocessor, which transmits them to actuator mechanisms via power control elements. Here is the list of such mechanisms in our case:
-
(1) shutter;
-
(2) slits wheel (1) with six positions;
-
(3) filters wheel(2) with six positions;
-
(4) grids wheel with four positions;
-
(5) mechanism for introducing/ withdrawing the calibration illumination mirror;
-
(6) focus of the camera;
-
(7) rotating stage;
-
(8) calibrating FLAT lamp;
-
(9) calibrating NEON lamp.
The shutter is actuated by a solenoid; mechanisms 2 to 7—by step motors; calibrating lamps—by application of high voltage. The built-in microprocessor program actuates the mechanisms, and also determines the logic of their operation and controls their state. To facilitate the assembly and increase the repairability of actuator mechanisms, they have local boards mounted to accommodate some of the elements of the control system. These include aspect sensors, electronic keys, connectors. The temperature of the bearing plate of the spectrograph is controlled by LM75 sensor.
The above technical solutions made it possible to substantially reduce external communications and intelligent computer load, and simplify changing of the spectrograph operation mode.
3.2 Control Software
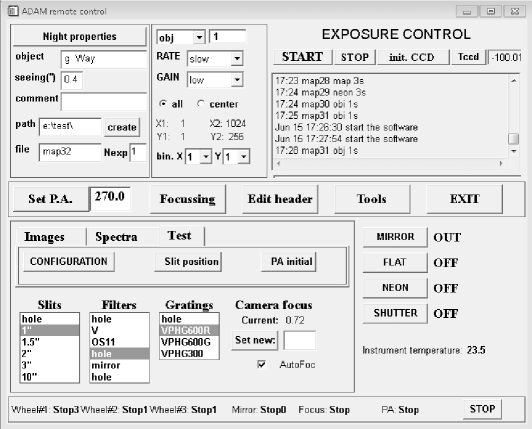
ARK-1122F computer with the software that controls the spectrograph, its state, and data acquisition, works under Windows 7 OS. The control interface is written in IDL555http://www.harrisgeospatial.com/ and allows sending commands to both the local microprocessor and the CCD server (programs written by T. A. Fatkhullin, SAO RAS). Fig. 4 shows the main menu of exposure and spectrograph control. The observer may reside far away from the telescope and control the instrument via TCP/IP protocol using NetOp666http://www.netop.ru/ remote computer administration suite.
All parameters of the current state of the spectrograph (position of movable elements, temperature, etc.), and the main parameters of the telescope (coordinates, focus) are automatically written to the FITS headers.

4 Results of tests
4.1 Laboratory Tests
After making the spectrograph we conducted laboratory measurements of the critical operation parameters such as the transmission of the optics, quantum efficiency, etc.
4.1.1 Quantum Efficiency of the CCD
We performed our measurements using MDR-41 monochromator in the 0.36–1.0 m wavelength range. We used a halogen lamp as the source of light and an Optronic Laboratory rated silicon LED as the detector. The flux from the LED was recorded by OL730D radiometer of the same manufacturer. Our measurements showed that the quantum efficiency agrees with the nominal ratings of E2V CCD30-11 detector: it was greater than 90% in the 0.42–0.83 m wavelength interval and more than 40% at the boundaries of the measurement range (Fig. 5).
4.1.2 Transmission of the Optics
To determine the transmission of the optics without dispersing elements, we compared the monochromatic flux at the entrance and output of the spectrograph in the 0.36–1.0 m wavelength interval. The monochromatic source with a relative aperture of was formed using Jarrel Ash monochromator and a halogen lamp. The measurements were performed using FD-4A photodiode. We thus measured the relative spectral transmission of the spectrograph and determined the absolute transmission using laser emission at 0.6438 m. Our measurements showed that the spectrograph optics has the transmission of 90–95% practically throughout the entire operating wavelength range (Fig. 5).
4.1.3 Image Quality
We estimated the image quality in spectroscopic mode by analyzing the focusing dependences for series of spectra acquired with different camera focal length values and at different positions along the slit. Our measurements showed that within the caustic, which does not exceed 0.1 mm around the best camera focus the of the slit does not exceed 1.4 pixels. The monochromatic size of a 1-arcsec slit is equal to 1.22 pixels. We can thus conclude that the size of the aberration circle of the optics in spectroscopic mode does not exceed 0.5 pixels (13 m). The size of the secondary spectrum in the spectrograph does not exceed 0.1 mm.
4.1.4 Mechanical Flexure
The amounts of flexure determined from the shift of the image while changing the position of the instrument on the telescope is a crucial parameter of any astronomical detection system. Our measurements showed that the maximum flexure determined by rotating the spectrograph about the optical axis set in the horizontal position does not exceed m.
4.1.5 Thermal Conditions
The thermal conditions of the spectrograph are guaranteed by the thermostat mounted inside the spectrograph case and operating independently of the control system. At ambient temperature C it takes no more than eight hours for the thermostat to reach the working temperature of C. Note that optical surfaces and the entrance glass of the CCD do not suffer from condensation at ambient atmospheric humidity of 75–80%.
4.2 Observations on the 1-m telescope
During the period from June 17–21, 2015 test observations were performed on the 1-m Zeiss-1000 telescope of the SAO RAS. To match the telescope with the spectrograph, we made a two-lens converter reducing the aperture ratio from down to . Note that the converter fulfills the telecentrism condition—the path of beams is equivalent to the path of rays of the Sayan Observatory telescope, and the the size of the exit pupil corresponds to the size of the pupil produced when ADAM spectrograph is mounted on the 1.6-m telescope.
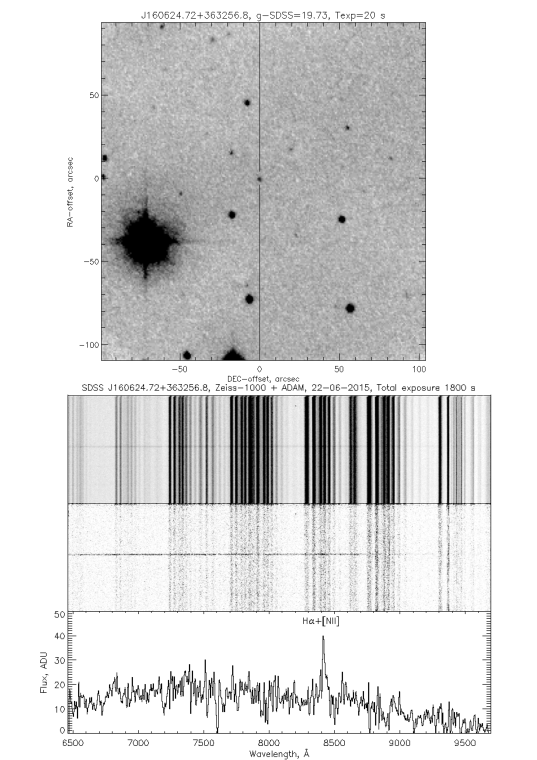
We observed spectrophotometric standards in order to determine the quantum efficiency and acquire spectra of faint targets of various types. Observations were carried out in the remote mode from the SAO RAS institute building. Unfortunately, weather was bad during our observations and only during the night of June 18/19 we could acquire a spectrum for the standard star BD+33 2642 of satisfactory quality in the red to be suitable for estimating the quantum efficiency. We estimated the extraatmospheric quantum efficiency of the “telescope + spectrograph + CCD” system to be of about 60%, which is consistent with the expected value. During the last night of the set, June 21/22, we acquired the spectrum of the Seyfert galaxy J 160624.72+363256.8 (with the SDSS -band magnitude of ), which has a redshift of 0.281 according SDSS data. The seeing during observations was equal to about and atmospheric transparency was satisfactory. The width of the spectrograph slit was and ADU=2.6 . The flux from the target that got through the slit corresponded to an -band magnitude of about . Figure 6 shows the direct image and reduced spectrum of the target. As is evident from the figure, an ratio of about 6–7 can be achieved with a 30-min exposure, demonstrating the high efficiency of the spectrograph.

4.3 Observations on the 1.6-m Telescope
The spectrograph was mounted on the 1.6-m telescope of Sayan Observatory in September 2015. We observed both spectrophotometric standards and starlike targets of various types and brightness. Transparency varied by 20–30% from night to night. Figure 7 shows the curves of the total quantum efficiency of ADAM spectrograph with AZT-33IK telescope for the night of the best transparency. The slit width in these observations was equal to for the typical seeing of . The same figure also shows the quantum efficiency curve for TFOSC spectrograph, which was kindly provided to us by R. A. Burenin. The spectra of various objects acquired during these observations are presented by Burenin et al. (2016). For example, in the case of seeing and slit width of – and , respectively, observing an elliptical galaxy with 30-minute exposure using VPHG600G grism yields a signal-to-noise ratio as high as – in the resulting absorption spectrum. Observations with a VPHG300 grism under the same conditions produce the spectrum of a quasar with a similar signal-to-noise ratio. Furthermore, one-hour exposure with VPHG600R produced the spectrum of a distant () quasar with .
5 Conclusions
Our experience in the development of spectroscopic instruments for the 6-m telescope of the SAO RAS combined with available modern technologies (volume phase holographic gratings, deep depletion CCDs, industrial computers, multilayer antireflection coatings) allowed us to make a sufficiently compact, easy to control, and transparent optical spectrograph. The maximum quantum efficiency of the entire system (including the telescope) exceeds 50%. Relatively short total exposures (of about one hour) on AZT-33IK telescope allow acquiring spectra of starlike objects with integrated magnitudes –. This is a good result for a 1.5-m class telescope.
Acknowledgements.
We are grateful to S. V. Drabek and V. V. Komarov for their assistance with the organization of test observations at the SAO RAS, T. A. Fatkhullin for developing CCD control software, M. V. Eselevich and A. L. Amvrosov for their assistance with adapting the spectrograph to AZT-33IK telescope, and to the anonymous reviewer for the comments that improved the paper.References
- Afanasiev & Moiseev (2005) Afanasiev, V. L., Moiseev, A. V. 2005, Astronomy Letters, 31, 194
- Afanasiev & Moiseev (2011) Afanasiev, V. L., Moiseev, A. V. 2011, Baltic Astronomy, 20, 363
- Andersen et al. (1995) Andersen J., Andersen M. I., Klougart J. et al., 1995, ESO Messenger, 79, 12
- Barden et al. (2000) Barden S. C., Arns J. A., Colburn W. S., Williams J. B. 2000, PASP, 112, 809
- Burenin et al. (2016) Burenin R. A., Amvrosov A. L., Eselevich M. V., et al. 2016, Astronomy Letters, 42, 295
- Buzzoni et al. (1984) Buzzoni B., Delabre B., Dekker H. , et al. 1984, ESO Messenger, 38, 9
- Geyer (1975) Geyer E. H, 1975, Jena Review, 20, 26
- Mack et al. (2010) Mack P., KanniahPadmanaban S. Y., Kaitchuck R., Borstad A., Luzier N. 2010, Bull. Amer. Astron. Soc., 41, 824