Robopol: Optical polarisation monitoring of blazars
Abstract:
The RoboPol program has been monitoring the -band linear polarisation parameters of an unbiased sample of 60 gamma-ray-loud blazars and a “control” sample of 15 gamma-ray-quite ones. The prime drive for the program has been the systematic study of the temporal behaviour of the optical polarisation and particularly the potential association of smooth and long rotations of the polarisation angle with flaring activity at high energies. Here we present the program and discuss a list of selected topics from our studies of the first three observing seasons (2013–2015) both in the angle and in the amplitude domain.
1 Introduction
The variability of both the angle and the degree of optical polarisation has been known since the early polarisation studies of quasars [1]. After the first detection of a long monotonous change of the optical polarisation plane [2] – nowadays termed as “rotation” or “swing” – the attention of the community was caught when a similar event was found in the blazar BL Lacertae [3]. In that particular case the rotation appeared to be associated with structural evolution of the radio jet as well as flaring activity at high energies. The rotation of the optical polarisation plane was interpreted as the natural consequence of an emission element following a helical path. The sequence of events observed at the source (structural evolution, optical-to-gamma rays outburst, and delayed radio flaring activity) led to the understanding that the region where the acceleration takes place is dominated by a helical magnetic field thus providing insight on the inner parts of the jet.
As rotations of the electric vector position angle (EVPA) were being detected, a broad spectrum of alternative possibilities were proposed to interpret the observations. Early studies have been predicting that such events could naturally occur as a result of ”random walks” caused by the evolution of a turbulent magnetic field [4]. Shocks travelling in non-axisymmetric jets have also been discussed as a possible mechanism [5]; flares with significant degree of polarisation occurring in the accretion disc [6]; systems with two independent sources of polarised emission [7] and jet bending [8] are among the most commonly discussed proposals.
The RoboPol111https://robopol.org high cadence blazar polarisation monitoring program was initiated with the aim to conduct a systematic study of these events and explore their full potential to probe the physical processes at the radiating plasma. That involved the design, the funding, the construction and the operation of a 4-channel optical polarimeter.
In the following we provide a brief yet concise description of the program and summarise some among the most noteworthy findings in terms of the angle of polarisation plane as well as the polarisation amplitude. Most of the material that follows is included in a series of papers [9, 10, 11, 12, 13, 14, 15].
2 The RoboPol program
The possible association of the EVPA rotations with the activity in the MeV – GeV energy range (e.g. [8, 16]) has clearly been the drive for the initiation of the RoboPol program. Should such an association be proven physical it could provide insight on the physics of high energy activity. The considerable efforts put on understanding these events prior to RoboPol were primarily event-driven, inevitably resulting in biased datasets unsuitable for statistically rigorous studies. Instead, the guiding principles for RoboPol have been [9, 10]:
-
1.
To create a database of rotation events by systematically observing a sample of gamma-ray blazars as unbiased as possible.
-
2.
To compile a similar dataset for a gamma-ray quiet “control” sample of blazars ideally identical in all properties to the “main” sample (except for the gamma-ray loudness).
-
3.
To carry out this exercise with a cadence (a) adequately broad to cover all possible rates of rotation and (b) adaptive do make most efficient usage of the available observing time.
-
4.
To have all the necessary control on the systematics in order to achieve the necessary degree of accuracy.
Such a dataset would then provide the base for studying the temporal polarimetric behaviour of blazars; assessing the coincidence of rotation events with the activity at high energies; investigating the physical processes producing those events; examining the dependence of the polarisation parameters on source properties; conducting statistically reliable population studies.
To accomplish the aims set by this challenging scientific case three requirements became apparent from the very beginning: large amount of telescope time, a sensitive polarimeter with high degree of systematics control and a carefully selected unbiased sample.
Large amount of telescope time.
The need for continuous monitoring of relatively large samples in combination with the rotation rates that had been known from the literature made it obvious that a good fraction of a week was imperative. That was made possible with the dedication of four nights per week by the Skinakas222http://skinakas.physics.uoc.gr 1.3-m telescope in Crete [17]. This observing time has been applicable for the first three years of the RoboPol operations (2013 – 2015) and for the part of the year that the observatory is operated (typically March or April – November).
The RoboPol polarimeter.
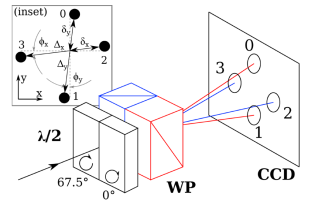
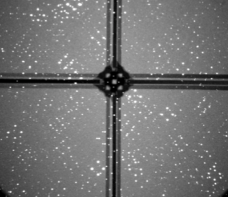
A key element in the success of the RoboPol program has been the four-channel RoboPol polarimeter (Fig. 1, Ramaprakash et al. in preparation). The first essential ingredient in its design has been the complete absence of moving parts (apart from the filter wheel which potentially can rotate). Contrary to many conventional polarimeters, RoboPol features a combination of half-wave retarders followed by two Wollaston prisms in such an arrangement that each point source in the sky is mapped into four spots on the CCD plane (see Fig. 1). Conducting photometry of the four spots gives us directly the angle and degree of polarisation as it is described in Section 2 of [10]. This design minimises the systematics. The second ingredient that improves the sensitivity of the instrument, allowing it to measure the polarisation vectors of weak sources, is the central mask: a “negative” pattern that shadows the regions of the CCD where the four spots of the central object are projected on, lowering the sky background by a factor of 4. Another essential part for the RoboPol smooth operation has been a sophisticated data acquisition and reduction “pipeline” which conducts a series of automatic tasks, outputting the fractional Stokes parameters ( and ) without any human intervention, as it is discussed by [10].
 |
 |
Unbiased sample.
As discussed earlier, the merit of the RoboPol findings relies on the fact that the observed sample has been the result of non-biasing cuts applied on a gamma-ray photon-flux-limited sample.
The “main” sample; gamma-ray-loud (GL) sources: Since the primary drive for the program has been the potential association of the polarisation angle swings and the activity at high energies, the “main” sample was drawn from the Second Fermi Large Area Telescope Source Catalog (2FGL, [18]). Starting from the 2FGL photon-flux-limited list we first applied a photon flux cut (cm-2s-1) to avoid biases from the energy dependent sensitivity of the detector, and excluded sources in the proximity of the galactic plane (galactic latitude ) to minimise possible biases caused by imperfect knowledge of the galactic diffuse background. From the resulting sub-set of 557 sources we selected those that (a) would rise to a maximum elevation of more the at Skinakas for at least 90 consecutive nights in the window June – November and (b) had an archival -band magnitude of less than 17.5. This sub-set was finally examined for field quality and observational constrains to create a list of 62 sources that comprised the “main” gamma-ray-loud sample that was monitored.
The “control” sample; gamma-ray-quiet (GQ) sources: The 15 GHz OVRO monitoring program showed that the gamma-ray-loudness is related to the radio variability amplitude so that GQ sources show lower modulation indices [19]. In order to examine whether the optical polarisation properties are also dependent on the gamma-ray-loudness, we selected the most radio-variable sources of the OVRO catalog that were absent from the 2FGL. After applying similar cuts as for the “main” sample we compiled a list of 15 gamma-ray-quiet sources that comprised our “control” sample.
The two samples were observed as similarly as possible so that, despite their different sizes, a rigorous comparison could be carried out. The details of the sample selection are discussed in [9].
2.1 Observations and dataset
The RoboPol program was operated in its designed “regular” mode for the observing seasons of 2013, 2014 and 2015. The observing cadence was adopted to the source state of activity within a range from one measurement every few days to a few measurements per night. The observations were done in the -band. The observing cycle included a few-second-long exposures for (a) target acquisition optimisation and (b) estimation of the exposure necessary for achieving the desired level of accuracy. The figure of merit was reaching an SNR of 10 for a 3% polarised source of mag in no more than 30 minutes.
The overall uncertainty in the polarisation fraction is of the order of 0.01 and that in the polarisation angle of the order of 1–10 degrees depending on the source brightness and polarisation. The photometry is done using all standard stars found in any given field and the overall error in the -band magnitude is around 0.04 mag [9, 11, 14].
In 2016 the limited fraction of the telescope time that was granted for RoboPol observations was dedicated to a list of 27 sources of the main sample that were most probable to show a rotation event. With the reduced sample we significantly increased the cadence of observations for each monitored source, allowing for an unprecedented time sampling of rotation events. This study will be discussed in a future publication.
3 Polarisation angle rotations
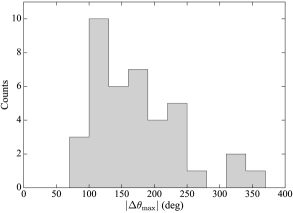
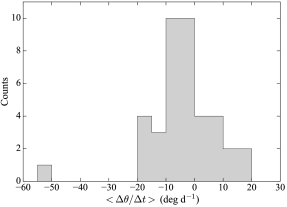
During the first three observing seasons (2013 – 2015) RoboPol detected a total of 40 EVPA rotations in 24 blazars [11, 12, 13] giving already a crude sense of their frequency of occurrence. At least four measurements with significant angle swings between them are required to define an EVPA rotation. The details are discussed in [11]. The rotations detected during the first (2013), second (2014) and third (2015) season are shown in Figures 2 of [11], 3 of [12] and 1 of [13]. All 40 events are listed in Table 1 along with their most important parameters. All the data listed there are taken from [11, 12, 13]. In Figure 2 we show the distributions of two characteristic parameters of the observed rotations: the rotation magnitude and the average rotation rate.
 |
 |
3.1 The first observing season (2013)
The completion of the first observing season (2013, [11]) revealed 16 rotations almost doubling the sample of known events until then. Already that dataset led to a list of noteworthy findings:
Rotations in GL and GQ sources.
Interestingly, the EVPA rotations were exclusively detected in GL sources suggesting a physical connection between the regular temporal variability of optical polarisation angle and the production of high energy emission. The identical treatment by the RoboPol observing scheme of GL and GQ sources excluded the possibility that this dichotomy is caused by differences in the sampling.
Rotations in blazar classes.
Concerning different subclasses of blazars (LSP, ISP and HSP or FSRQs and BLL Lacs) they showed the same probability of showing EVPA rotations. Similarly, there is no preference towards blazars known as TeV emitters or not.
Multiple rotations.
Eight blazars showed more that one rotation during this first observing season. In these cases the rotations can show both senses of rotation, while the angle may rotate at a pace very different (rotation rates may differ by a factor larger than two).
Rotations and gamma-ray activity.
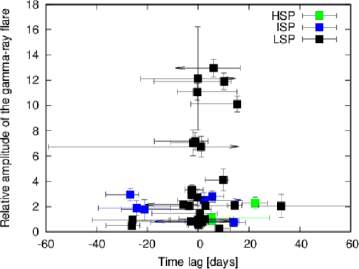
The examination of the high energy activity during those 16 events showed that the gamma-ray photon fluxes on average do not show any systematic increase during the EVPA rotations. However, in those cases where EVPA rotations were accompanied by a gamma-ray flare, the strongest flares appear more contemporaneously with the corresponding rotation, whereas less intense flares show a larger range of time lags between flare and rotation. This is shown in Figure 8 of [11]. If that result were to be confirmed with larger rotation datasets, it would indicate the presence of two families of events: (a) rotation events associated with practically synchronous and bright gamma-ray flares, and (b) rotations that are associated with much weaker gamma-ray outbursts that can occur within a broad range of time lags from the rotation. Further, this would indicate two separate mechanisms inducing EVPA rotations: one potentially deterministic process producing EVPA rotations and higher-amplitude gamma-ray flares contemporaneously, and one potentially stochastic process producing rotations which are not necessarily associated with the weaker gamma-ray flares occurring around the rotation event. This latter case could possibly be realised by random walk processes. Figure 8 of [11] will be revisited in an subsequent publication (Blinov et al. in preparation).
Random walks and EVPA rotations.
One of the mechanisms suggested to naturally produce smooth and long rotations of the EVPA has been random walk processes in an evolving turbulent magnetic field [4]. We conducted Monte Carlo simulations to examine the capacity of this processes to reproduce the phenomenologies we have observed and specifically the rotation magnitude . We find that a random walk process can indeed produce rotations of the observed magnitude in specific cases. It is however unlikely that the entirety of the observed rotations in the first RoboPol season are due to a random walk process (probability , [11]).
3.2 The second observing season (2014)
During the second observing season (2014, [12]) 11 new rotations were detected in 10 sources. The focus was put mostly on comparing the rotating and the non-rotating phases of the source as well as estimating the rate of expected events. Some of the most noteworthy findings, were:
Optical flares and EVPA rotations.
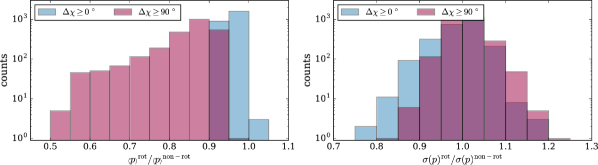
Similarly to the question whether there is always a gamma-ray flare accompanying an EVPA rotation, we have investigated the activity in the optical band during such events. It appears that there is no association of rotations with contemporaneous optical flares. Figure 11 of [12] shows that the distribution of the ratio of the optical flux density during rotation to that over the non-rotating period is peaking at unity; implying that there is no general increase of the optical flux density during rotations. We also studied the flux density modulation index – as a measure of the variability amplitude – during the rotation phase and outside of it to find that during the rotation the variability properties remain – on average – unchanged as well.
Polarisation during EVPA rotations.
We further studied the behaviour of the degree of polarisation during the rotations. Figure 9 in [12] shows the ratio between the polarisation fraction of 27 rotation events (from both the first and second seasons) during the rotation and that outside the rotation. For more than 2/3 of the cases this ratio is below unity. The same exercise showed that the modulation index of the polarisation fraction remains rather unchanged between the two states.
We conducted large number of simulations to investigate the predictions of the random walk model for these two quantities. Figure 3 shows the relative polarisation fraction and the relative variability amplitude during rotation and outside of it. As it is shown there the random walk model can reproduced the observed behaviour even though the simulations refer to idealised cases of very long continuous observations ( days, same time sampling as RoboPol, no seasonal gaps, Kiehlmann et al. in preparation).
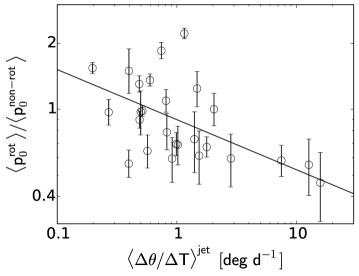
Polarisation and the rotation rate.
Of great theoretical interest is the indication that the relative polarisation fraction (during rotation and outside of it) anti-correlates with the rotation rates measured at the emission frame i.e. corrected for Doppler blueshift and cosmological redshift (see Figure 10 in [12]). Although the Doppler factors used there maybe be irrelevant to the optical emission, their randomisation showed that a slope of the same significance can be produced in less than only 2% of the cases. In Figure 4 we show the same plot updated to include all the events detected with the first three seasons. The correlation coefficient is around with a p-value of around The fitted line has a slope of .
3.3 The third observing season (2015)
During 2015 another 13 rotation events were found in 10 blazars. On the basis of the entirety of events found in all three regular seasons (2013 – 2015) we conducted a thorough analysis presented in [13] which showed that the frequency of rotations varies significantly among blazars. Additionally, no rotation was detected in a GQ blazar. Concerning the event rates we find that only % of sources (collectively in GL and GQ samples) showed rotations with rates deg d-1. The mean frequency of events is estimated to be one every 232 d (in the observer frame). The rest of the sources (72%) did not show rotations, constraining their frequency of occurrence (if any) to less than one every 3230 d.
| RoboPol ID | Survey ID | Class | Season | ||||
|---|---|---|---|---|---|---|---|
| (d) | (deg) | (deg/d) | (d) | ||||
| RBPLJ00452127 | GB6 J00452127 | FSRQ | 113 | 200 | 4.2 | 48 | 2015 |
| RBPLJ01364751 | OC 457 | FSRQ | 59 | 225 | 6.6 | 34 | 2013 |
| … | … | … | 136 | 92 | 2.2 | 42 | 2014 |
| … | … | … | 86 | 114 | 4.4 | 26 | 2015 |
| … | … | … | … | 109 | 5.4 | 20 | 2015 |
| RBPLJ10375711 | GB6 J10375711 | IBL | 54 | 165 | 5.3 | 31 | 2014 |
| RBPLJ02590747 | PKS0256075 | FSRQ | 72 | 180 | 4.8 | 38 | 2013 |
| RBPLJ07217120 | S5 0716+71 | LBL | 88 | 208 | 14.8 | 14 | 2013 |
| RBPLJ08542006 | OJ 287 | LBL | 51 | 154 | 6.7 | 23 | 2013 |
| RBPLJ10487143 | S5 1044+71 | FSRQ | 142 | 188 | 9.0 | 21 | 2013 |
| RBPLJ15120905 | PKS 1510089 | FSRQ | 138 | 243 | 17.3 | 14 | 2014 |
| … | … | … | … | 199 | 18.2 | 11 | 2014 |
| … | … | … | 115 | 120 | 6.0 | 20 | 2015 |
| … | … | … | … | 97 | 7.0 | 14 | 2015 |
| RBPLJ15551111 | PG 1553+113 | HBL | 129 | 128 | 5.6 | 23 | 2013 |
| … | … | … | 155 | 145 | 7.6 | 19 | 2014 |
| RBPLJ15585625 | TXS1557+565 | IBL? | 137 | 222 | 7.2 | 31 | 2013 |
| RBPLJ16353808 | 4C 38.41 | FSRQ | 126 | 119 | 5.7 | 21 | 2015 |
| RBPLJ17487005 | S4 174970 | IBL | 189 | 126 | 3.2 | 39 | 2014 |
| RBPLJ17510939 | OT 081 | LBL | 177 | 335 | 10.5 | 32 | 2014 |
| … | … | … | 134 | 225 | 9.0 | 25 | 2015 |
| RBPLJ18007828 | S5 1803784 | LBL | 145 | 192 | 6.0 | 32 | 2014 |
| … | … | … | 147 | 162 | 2.9 | 56 | 2015 |
| RBPLJ18066949 | 3C 371 | LBL | 143 | 238 | 13.3 | 18 | 2013 |
| … | … | … | 143 | 347 | 16.5 | 21 | 2013 |
| … | … | … | 186 | 187 | 3.0 | 63 | 2014 |
| RBPLJ18092041 | RX J1809.32041 | HBL | 130 | 427 | 4.7 | 91 | 2015 |
| RBPLJ18363136 | RX J1836.23136 | FSRQ | 133 | 182 | 4.7 | 39 | 2015 |
| RBPLJ19276117 | S4 192661 | LBL | 135 | 105 | 4.4 | 24 | 2013 |
| RBPLJ20227611 | S5 2023760 | IBL | 102 | 107 | 4.7 | 23 | 2014 |
| RBPLJ22024216 | BL Lac | LBL | 137 | 253 | 51.0 | 5 | 2013 |
| RBPLJ22321143 | CTA 102 | FSRQ | 140 | 312 | 15.6 | 20 | 2013 |
| … | … | … | … | 140 | 11.8 | 12 | 2013 |
| … | … | … | 156 | 137 | 3.8 | 36 | 2015 |
| RBPLJ22432021 | RGB J2243203 | LBL | 169 | 183 | 5.9 | 31 | 2013 |
| RBPLJ22531608 | 3C 454.3 | FSRQ | 159 | 129 | 18.3 | 7 | 2013 |
| … | … | … | 156 | 145 | 16.3 | 9 | 2014 |
| … | … | … | 116 | 139 | 4.8 | 29 | 2015 |
| … | … | … | … | 101 | 14.5 | 7 | 2015 |
| RBPLJ23113425 | B2 230834 | FSRQ | 36 | 74 | 3.3 | 23 | 2013 |
4 The polarisation fraction
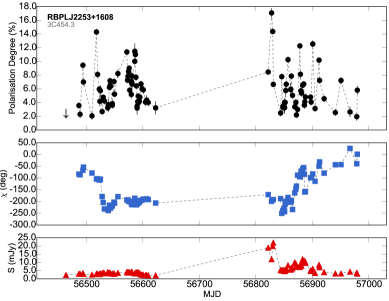
The RoboPol datasets include time series of the polarisation fraction (i.e., the degree of polarisation normalised to unity), the polarisation angle and the -band magnitude (or equivalently the flux density). An example dataset if shown in Figure 5.
In [14] we focused on the degree of polarisation using the datasets collected during the first two seasons. The main aim of our study was to understand the differences between the GL and GQ sources and to investigate the factors that may be driving the occurrence of significant polarisation in blazars. Interestingly, our findings led to an interpretation that could explain also some of the conclusions we reached in the studies of the polarisation angle, as we discuss below.
The polarisation of GL and GQ sources.
The single-shot measurements gathered during the RoboPol commissioning in early summer 2013 disclosed – for the first time – a significant separation of GL and GQ sources in terms of their polarisation degree [9]. We found is that that the population average of the polarisation fraction is more than 6% for the GL sources, but only slightly above 3% for the GQ sources. Using the datasets of the first two seasons that were potentially affected by source variability, updated these mean values to % and %, respectively [14]. For these latter estimates we have used maximum likelihood polarisation fraction which accounts for statistical biases and observational uncertainties, under the assumption that for both populations the polarisation fraction follows lognormal distributions.
The polarisation variability of GL and GQ sources.
Unlike the degree of polarisation its variability amplitude is indistinguishable for GL and GQ sources as we show in Figure 11 of [14]. As we discuss there the two distributions cannot be significantly different.
Polarisation and multi-band variability.
The variability parameters and especially the variability amplitude could be seen as an indication of shocks occurring in the emitting jet. Shocks imply compressions and a consequent local increase of the order of the associated magnetic field. Thus, we expect an at least mild relation between the average degree of polarisation and the variability in different bands as long as these assumptions hold. In Figures 8 and 9 of [14] we looked at the effect the radio and optical modulation index may have on the mean polarisation fraction. Our study suggests that the median polarisation is higher, when the amplitude of variability in radio or optical is larger. That is not however the case for the high energy (2FGL) variability index. Finally, the variability amplitude of the polarisation itself seems to have no influence on the median polarisation (Figure 10 therein).
Polarisation variability and redshift.
Despite the complete absence of a relation between the median polarisation and redshift, we find a relation between the modulation index of the polarisation fraction and redshift. When GL and the GQ sources are examined collectively a Spearman’s test gave a of 0.43 with a p-value of . The positive correlation becomes further significant when upper limits of the modulation index are used (see Figure 12 in [14]). This implies a cosmic evolution of the factors that contribute eruptive polarised emission.
Polarisation and synchrotron peak frequency.
The key discovery of the study presented in [14] is the dependence of the polarisation fraction on the location of the SED synchrotron component peak which is shown in Figure 5 therein. It becomes evident that a synchrotron-peak-dependent envelope is binding the polarisation fraction so that low-synchrotron-peaked (LSP) sources are on average more polarised than high-synchrotron-peaked (HSP) ones. At the same time the polarisation spread decreases towards higher frequencies. As we discuss later this realisation led to sketching a model that can explain a number of observable effects.
Randomness of the angle and synchrotron peak frequency.
Furthermore, we observed that the randomness of the EVPA also depends on the location of synchrotron component peak. LSP sources tend to show a random orientation of their EVPA, unlike HSP sources which tend to show a preferred direction as it is demonstrated in Figure 7 of [14].
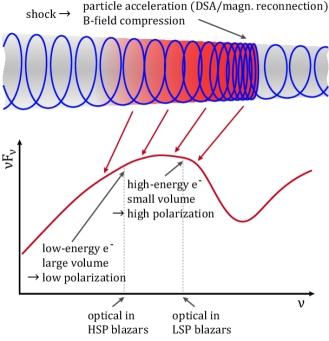
5 A qualitative model for the interpretation of the observed trends
In Figure 6 we show a simple qualitative model that seems able to explain most of the effects we observe. It relies on the shock-in-jet scenario. The jet is assumed to be pervaded by a magnetic field in a helical configuration, on which a turbulent component may be superposed. Mildly relativistic shocks may induce efficient particle acceleration (e.g., via diffusive shock acceleration or magnetic reconnection) in a small volume in the immediate downstream vicinity of the shock. Particles that are advected away from the shock on their way downstream cool via synchrotron and Compton radiative losses. The most energetic particles that produce the emission near and beyond the synchrotron peak are expected to be concentrated in a small volume immediately downstream of the shock. There the shock-compressed magnetic field has a dominant ordered (helical) component as well as shock-generated turbulent magnetic field. As a result, near and beyond the synchrotron peak we expect substantial degrees of polarisation. Owing to progressive cooling of shock-accelerated electrons as they are advected downstream, the volume from which lower frequency synchrotron emission is received is expected to increase monotonically with decreasing frequency. The superposition of radiation from zones with different B-field orientations causes de-polarisation so that one expects a lower degree of polarisation with decreasing frequency.
In the framework of this model the dichotomy between GL and GQ sources can be explained naturally. GL sources are characterised by high degree of variability, indicating a jet dominance for most parts of the SED due to a high degree of Doppler boosting and frequent occurrence of impulsive episodes of particle acceleration as the ones described above. GQ sources on the other hand must be characterised by less extreme Doppler boosting and less efficient particle acceleration events. This leads to energies lower than the ones required for gamma-ray production at detectable levels. As a consequence, optical synchrotron emission is likely to be produced on larger volumes than in the more active GL objects, naturally explaining the lower degree of polarisation.
Even more direct is the explanation that the same model seems to be providing for the dependence of the degree of polarisation on the synchrotron peak. In LSP blazars the synchrotron peak is typically located in the infrared implying that -band emission belongs to the high frequency part of the synchrotron emission. As we discussed above, this is associated with high degree of polarisation. On the other hand, for HSP blazars the synchrotron peak is located in UV or X-rays. In this case the optical emission is part of the low-frequency synchrotron emission which is expected to give lower degrees of polarisation.
Within this framework, for LSP sources the region from which the optical emission emanates is characterised by a dominant helical field component. In those cases then we expect that the rotations will occur (a) deterministically and (b) practically concurrently with the gamma-ray flares.
Some hint that this prediction may indeed be confirmed is given by Figure 7. There we duplicate the plot shown in Figure 8 of [11] except that here we use all available datasets. The sources are labeled according to their synchrotron peak as LSP, ISP and HSP. All the events that are synchronised with the brightest gamma-ray events have occurred exclusively in LSP sources. That is not the case for the second population of events where there is an apparent mixing of source classes.
The combination of a helical and a turbulent component in the context of our assumed model seems to be giving an explanation also for the observation that HSP sources tend to have preferred directions of the polarisation angle while LSP sources incline to a random orientation. The presence of a helical component means that both LSP and HSP sources have an underlying stable EVPA component associated with it. In HSP sources where the variability amplitudes are lower and variability time scales longer, the stable component may be more dominant. That would explain why their EVPA is practically stable. It is essential however to note that only long-term observations can confirm whether the EVPA has a truly preferred orientation on time scales longer than the RoboPol observing periods.
In the case of HSP sources with preferred orientation of the polarisation angle it is only natural to expect that this angle should align either perpendicular or parallel to the jet axis. We have confirmed that this is indeed the case by studying the behaviour of TeV sources as it is demonstrated in Figure 7 of [15].
6 The polarisation of high-energy BL Lac objects (TeV)
In an attempt to understand what triggers the high energy emission in high energy BL Lac objects (TeV) we studied a sample of 32 TeV and 19 non-TeV blazars within the framework of the RoboPol program. The study is in press and currently available at [15] .
With regards to the mean polarisation fraction the TeV-detected sources gave a value of around 5% and non-TeV sources around 7%. This difference however is attributed to host galaxy contribution and is eliminated when the host starlight is accounted for. However, it appears that the TeV sources are characterised by slightly lower fractional polarisation variability amplitude as compared to the non-TeV ones. In fact there seem to be no intrinsic differences in the polarisation properties of the TeV and non-TeV sources.
What is very interesting is that for TeV sources the EVPA tends to concentrate around preferred directions while for non-TeV sources the angle tends to get rather random values. And for the majority of the cases the EVPA and jet are aligned to less the implying a B-field perpendicular to the jet direction (see Figure 7 in [15]). This has been seen as an important confirmation of our qualitative model.
7 Conclusions
Here we have attempted a brief summary of the most noteworthy findings from the first three observing seasons of the RoboPol program. Between 2013 and 2015 RoboPol has created the first unbiased set of EVPA rotations that provided the ground for the first systematic study of these events and gain understanding on the mechanisms that produce them. Already from the first season it became clear that all classes of blazars can rotate. With the dataset from the first two seasons we confirmed that GL are more polarised – as a population – than GQ sources. The polarisation as well as its spread depend on the synchrotron peak while the EVPA clearly shows a preferred direction for HSP sources. A jet populated by a helical field superposed to a turbulent component and with impulsive events of particle acceleration can provide a natural explanation for most of the observed phenomenologies.
The RoboPol program is a collaboration between: University of Crete (Heraklion, Greece), Max-Planck-Institut für Radioastronomie (Germany), California Institute of Technology (USA), Inter-University Centre for Astronomy and Astrophysics (India) and the Torun Centre for Astronomy, Nicolaus Copernicus University (Poland) .
References
- [1] T. D. Kinman, E. Lamla and C. A. Wirtanen, The Optical Brightness Variations and Polarization of the Quasi-Stellar Radio Source 3c 446, ApJ 146 (Dec., 1966) 964.
- [2] S. Kikuchi, Y. Mikami, M. Inoue, H. Tabara and T. Kato, A synchronous variation of polarization angle in OJ 287 in the optical and radio regions, A&A 190 (Jan., 1988) L8–L10.
- [3] A. P. Marscher, S. G. Jorstad, F. D. D’Arcangelo, P. S. Smith, G. G. Williams, V. M. Larionov et al., The inner jet of an active galactic nucleus as revealed by a radio-to--ray outburst, Nature 452 (Apr., 2008) 966–969.
- [4] T. W. Jones, L. Rudnick, R. L. Fiedler, H. D. Aller, M. F. Aller and P. E. Hodge, Magnetic field structures in active compact radio sources, ApJ 290 (Mar., 1985) 627–636.
- [5] A. Konigl and A. R. Choudhuri, A model of the polarization position-angle swings in BL Lacertae objects, ApJ 289 (Feb., 1985) 188–192.
- [6] A. Sillanpää, L. O. Takalo, K. Nilsson and S. Kikuchi, Photopolarimetry of Bl-Lacertae, Ap&SS 206 (Aug., 1993) 55–70.
- [7] C.-I. Bjornsson, Polarization properties of a source in relativistic motion, ApJ 260 (Sept., 1982) 855–867.
- [8] A. A. Abdo, M. Ackermann, M. Ajello, M. Axelsson, L. Baldini, J. Ballet et al., A change in the optical polarization associated with a -ray flare in the blazar 3C279, Nature 463 (Feb., 2010) 919–923, [1004.3828].
- [9] V. Pavlidou, E. Angelakis, I. Myserlis, D. Blinov, O. G. King, I. Papadakis et al., The RoboPol optical polarization survey of gamma-ray-loud blazars, MNRAS 442 (Aug., 2014) 1693–1705, [1311.3304].
- [10] O. G. King, D. Blinov, A. N. Ramaprakash, I. Myserlis, E. Angelakis, M. Baloković et al., The RoboPol pipeline and control system, MNRAS 442 (Aug., 2014) 1706–1717, [1310.7555].
- [11] D. Blinov, V. Pavlidou, I. Papadakis, S. Kiehlmann, G. Panopoulou, I. Liodakis et al., RoboPol: first season rotations of optical polarization plane in blazars, MNRAS 453 (Oct., 2015) 1669–1683, [1505.07467].
- [12] D. Blinov, V. Pavlidou, I. E. Papadakis, T. Hovatta, T. J. Pearson, I. Liodakis et al., RoboPol: optical polarization-plane rotations and flaring activity in blazars, MNRAS 457 (Apr., 2016) 2252–2262, [1601.03392].
- [13] D. Blinov, V. Pavlidou, I. Papadakis, S. Kiehlmann, I. Liodakis, G. V. Panopoulou et al., RoboPol: do optical polarization rotations occur in all blazars?, MNRAS 462 (Oct., 2016) 1775–1785, [1607.04292].
- [14] E. Angelakis, T. Hovatta, D. Blinov, V. Pavlidou, S. Kiehlmann, I. Myserlis et al., RoboPol: the optical polarization of gamma-ray-loud and gamma-ray-quiet blazars, MNRAS 463 (Dec., 2016) 3365–3380, [1609.00640].
- [15] T. Hovatta, E. Lindfors, D. Blinov, V. Pavlidou, K. Nilsson, S. Kiehlmann et al., Optical polarization of high-energy BL Lac objects, ArXiv e-prints (Aug., 2016) , [1608.08440].
- [16] V. M. Larionov, S. G. Jorstad, A. P. Marscher, D. A. Morozova, D. A. Blinov, V. A. Hagen-Thorn et al., The Outburst of the Blazar S5 0716+71 in 2011 October: Shock in a Helical Jet, ApJ 768 (May, 2013) 40, [1303.2218].
- [17] Y. Papamastorakis, Skinakas observatory – Crete, Greece A General Description of Infrastructure and Activities, Ipparchos 2 (Mar., 2007) 14–17.
- [18] P. L. Nolan, A. A. Abdo, M. Ackermann, M. Ajello, A. Allafort, E. Antolini et al., Fermi Large Area Telescope Second Source Catalog, ApJS 199 (Apr., 2012) 31, [1108.1435].
- [19] J. L. Richards, W. Max-Moerbeck, V. Pavlidou, O. G. King, T. J. Pearson, A. C. S. Readhead et al., Blazars in the Fermi Era: The OVRO 40 m Telescope Monitoring Program, ApJS 194 (June, 2011) 29, [1011.3111].