Emergent Weyl fermion excitations in TaP explored by 181Ta quadrupole resonance
Abstract
The 181Ta quadrupole resonance (NQR) technique has been utilized to investigate the microscopic magnetic properties of the Weyl semi-metal TaP. We found three zero-field NQR signals associated with the transition between the quadrupole split levels for Ta with =7/2 nuclear spin. A quadrupole coupling constant, =19.250 MHz, and an asymmetric parameter of the electric field gradient, = 0.423 were extracted, in good agreement with band structure calculations. In order to examine the magnetic excitations, the temperature dependence of the spin lattice relaxation rate (1/) has been measured for the -line (5/2 3/2 transition). We found that there exists two regimes with quite different relaxation processes. Above 30 K, a pronounced (1/) behavior was found, which is attributed to the magnetic excitations at the Weyl nodes with temperature dependent orbital hyperfine coupling. Below , the relaxation is mainly governed by Korringa process with 1/ = constant, accompanied by an additional type dependence to fit our experimental data. We show that Ta-NQR is a novel probe for the bulk Weyl fermions and their excitations.
pacs:
02.40.Pc, 76.60.-k, 76.60.Gv, 31.30.GsThe past decade has seen an explosion of interest in the role of topology in condensed matter physics. Major discoveries have included the two dimensional grapheneCastro Neto et al. (2009) and the topological insulators (TI) (e.g. HgTe or Bi2Se3),Kane and Mele (2005); Bernevig et al. (2006); Hasan and Kane (2010) whose topological properties require the existence of gapless surface states. Many of the new materials host exotic excitations whose observation can be regarded as direct experimental evidence for the existence of quasiparticles. Arguably, the most topical of the new classes of materials are Dirac- and Weyl-semi metals which are predicted to host topologically protected states in the bulk.Wehling et al. (2014) In Dirac semimetals (DSM),Wehling et al. (2014); Young et al. (2012); Wang et al. (2013) (e.g. Cd2As3 or Na3Bi) each node contains fermions of two opposite chiralities, whereas in the Weyl semimetals (WSM),Weng et al. (2015); Shekhar et al. (2015); Sun et al. (2015); Xu et al. (2015); Arnold et al. (2016) an even more interesting situation arises. A combination of non-centrosymmetric crystal structure and sizable spin-orbit coupling (SOC) causes the nodes to split into pairs of opposite chirality (Weyl points). In the ideal case, there would be exactly half filling of the relevant bands, such that the Weyl points would sit at the Fermi level () and the Weyl fermions would be massless. In actuality, Weyl semimetals such as the -electron monophosphides NbP and TaP, does not exactly coincide with the Weyl nodes.Shekhar et al. (2015); Sun et al. (2015); Arnold et al. (2016) However, if the nodes sit close enough to , in a region of linear dispersion ( ), the Weyl physics can still be observed in the excitations in the energy window . A key issue in the study of the monophosphides is therefore to establish how close to the Fermi level the Weyl points sit, and to estimate the range of energy over which the linear dispersion exists. This presents a considerable experimental challenge. The nodes appear in the electronic structure of the bulk, and the materials are fully three-dimensional, so the surface-sensitive techniques that have yielded immense insight into other topological physics are not ideally suited to studying the Weyl points. Primarily, one would like to identify a bulk probe that can excite the Weyl fermions and probe the linear dispersion indirectly via its energy dependence of the density of states around the Fermi level, which is for a Weyl node.Wehling et al. (2014) The magnetic resonance method in general has the ability to probe , and was applied successfully to systems like unconventional superconductors (e.g. UPt3)Curro (2011, 2009); Walstedt (2008); Kuramoto and Kitaoka (2000) or correlated magnetic semimetalsAeppli and Fisk (1992); *Riseborough_2000 (e.g. SmB6Caldwell et al. (2007) or CeRu4Sn6Brüning et al. (2010)). In particular, for unconventional superconductors, the nuclear quadrupole resonance (NQR) spin lattice relaxation provides information about around the and allows us to distinguish between point nodes () and line nodes ().Kuramoto and Kitaoka (2000) Therefore, NQR should be a good tool to study the low energy spin excitations in a Weyl semi metal and is the focus of our presented work. Assuming that some of the Weyl points are energetically not too far from , NQR can probe the magnetic excitations of emergent Weyl fermions via the temperature dependence of the spin-lattice relaxation rate (1/T). Furthermore, a characteristic temperature dependence of the hyperfine coupling between the nuclear spin and electric orbitals near the Weyl nodes has theoretically been predicted which modifies the temperature dependence of (1/T) in a special manner.Okvátovity et al. (2016) In fact, TaP has been known to have two sets of Weyl nodes, one located 41 meV (476 K) below and the other is located 13 meV (151 K) above .Arnold et al. (2016) Accordingly, for temperatures coinciding with the Weyl nodes, excitations associated with the Weyl fermions are expected. Here, we present such characteristic excitations via Ta NQR experiments and explore the emergent Weyl fermion excitations in TaP.
Samples used in the present NQR study were prepared by the chemical transport method. In a first step, TaP was synthesized by direct reaction of the elements tantalum (Alfa Aesar 99.98%) and red phosphorus (Alfa Aesar 99.999%) at 500 C and 600 C in an evacuated fused silica tube for 72 hours. Starting from this microcrystalline powder, TaP was crystallized by a chemical transport reaction (CTR) in a temperature gradient from 900 C (source) to 1000 C (sink), and a transport agent concentration of 13 mg/cm3 iodine (Alfa Aesar 99.998%). Crystals obtained by the CTR method were characterized by electron-probe-microanalysis and powder X-ray diffraction.
The NQR experiments were carried out with either a high quality single crystal or powder prepared from single crystals. The NQR spectra and 1/ were measured using standard pulsed NMR (nuclear magnetic resonance) apparatus. The spectra were taken using the frequency sweep method under zero applied magnetic field. In order to avoid any artificial broadening, fast Fourier transformed (FFT) signals were summed across the spectrum (FFT-summation) or the real part was integrated after proper phase adjustment. Since is extremely long in TaP (typically several hundred seconds at low temperatures), we employed the progressive saturation method to measure the temperature dependence of 1/.Mitrović et al. (2001) The recovery of nuclear magnetization was fitted to the theoretical functionChepin and Ross (1991) for the magnetic relaxation in NQR lines,
| (1) | |||||
where, and are constants depending on which NQR transition is excited and the asymmetry parameter of the electric field gradient (EFG). Using a set of principal axes, the quadrupole Hamiltonian can be written as,Abragam (1961); *Slichter_1989
| (2) |
where, is the largest component of the EFG tensor, , and is the nuclear quadrupole moment. The EFG tensor is generally defined as || || ||, with the asymmetry parameter = ()/. The quadrupole-split nuclear energy levels , and the resultant transition frequencies can be readily calculated numerically by diagonalizing Eq. (2). For = 0, the energy levels can simply be expressed as,
| (3) |
where is the quadrupole coupling constant. The NQR occurs for the transition between two levels and +1 and the resonance condition can be written as = (2||+1)/2. Therefore, for = 0, three NQR lines for =7/2 are expected at , 2 and 3 with equal spacing.
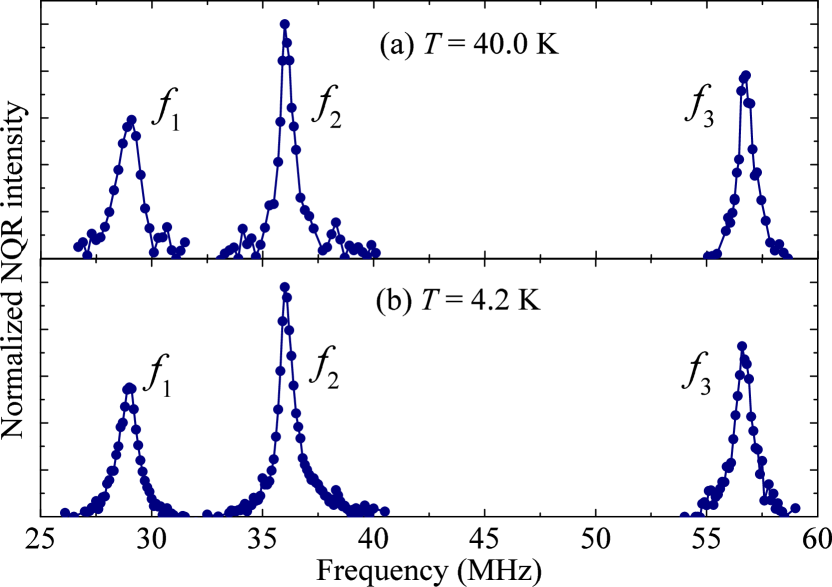
We searched for the NQR signal in TaP powder in a frequency range from 20 MHz to 80 MHz at 4.2 K and found three resonance lines. The observed 181Ta NQR spectra at 4.2 K and 40 K are shown in Fig.1 (a) and (b). One can immediately observe that the three lines are not equally spaced, meaning that the value of is sizable. By fitting each line at 4.2 K to a Lorentzian, we obtained the peak frequencies = 28.95 MHz, = 36.08 MHz and = 56.67 MHz. Although the full width at half maximum (FWHM) of the spectra is about 800 KHz, the line profiles are Lorentzian with long spectral tails. This implies that the EFG has a rather broad distribution. Since the Ta nuclear quadrupole moment is quite large (besides rare-earth and actinide elements, the 181Ta nucleus has the second largest -value), the NQR spectrum can be broadened easily by merely a slight local inhomogeneity or nonstoichiometry in the composition. A least squares fit of the observed peak frequency to the theoretical quadrupole interaction obtained from exact diagonalization gives us = 19.250 MHz and = 0.423. The same results were also obtained for a small single crystal at 4.2 K. We also measured the spectra up to 80 K and found that there is no appreciable temperature dependence of the value but has a gradual decrease with increasing temperature (see Supplement for more details).
| = 3.01028, = 8.7084, = 17.42483 | |||
|---|---|---|---|
| -line | = 0.05073 | = 0.45677 | = 0.49250 |
| -line | = 0.07624 | = 0.02126 | = 0.90250 |
| -line | = 0.19320 | = 0.51185 | = 0.29495 |
In order to extract the quadrupole interaction in TaP theoretically, we performed band structure calculations using the density functional theory (DFT) code FPLO.Koepernik and Eschrig (1999) We used the Perdew-Wang parametrization of the local density approximation (LDA) for the exchange-correlation functional.Perdew and Wang (1992) The strong SOC in TaP is taken into account by performing full-relativistic calculations, wherein the Dirac Hamiltonian with a general potential is solved. The treatment of a finite nucleus is implemented in the code, necessary for accurate estimation of NQR parameters.Koch et al. (2010) As a basis set, we chose Ta (4/55678567675) and P (22345345344) semi-core/valence states. The higher lying states of the basis set are essentially important for the calculation of the EFG tensor with components = . The low lying states were treated fully relativistically as core states. A well-converged mesh in 1210 -points was used in the irreducible part of the Brillouin zone. Theoretically, the quadrupole coupling, can be obtained by calculating the electric field gradient (EFG) at the Ta nuclear site which is defined as the second partial derivative of the electrostatic potential v(r) at the position of the nucleus = (v(0) - v(0)/3). Our calculations result in = -1.1861021 V/m2, = -2.3541021 V/m2 and = 3.5401021 V/m2, where the principal axis of the EFG is [100] for one Ta atom and [010] for the second Ta atom in the unit cell. Using these values and Eq. (2) we obtained = 20.057 MHz and = 0.33. These theoretical values are in good agreement with the experimental values, assuring that our line assignment to the quadrupole transitions is correct.
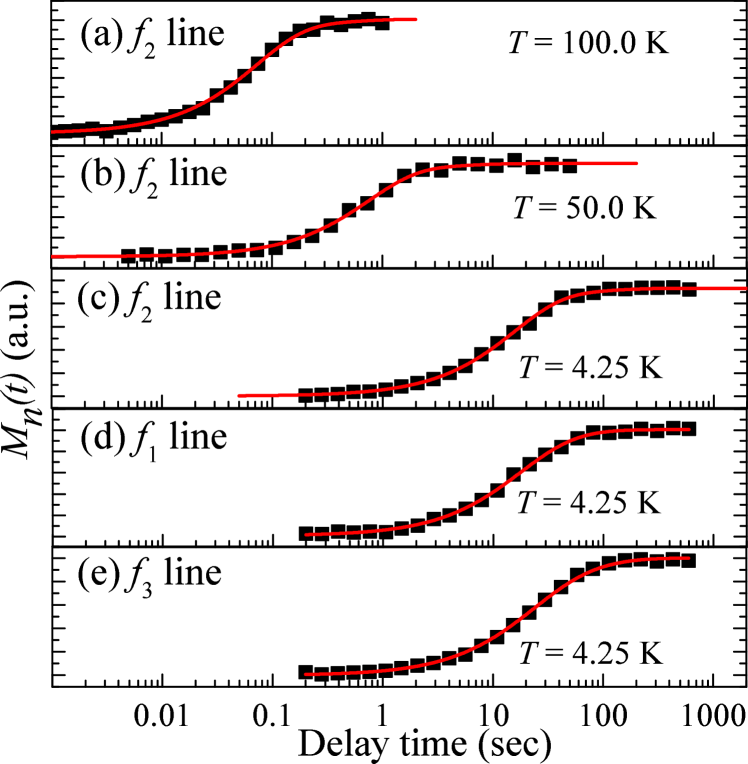
Before discussing the temperature dependence of 1/, we have to make sure that the relaxation is governed by the magnetic fluctuations associated with the conduction electrons, although the density is quite small in semi-metals. To answer this, we have made careful measurements of the time dependence of the recovery of nuclear magnetization from saturation to thermal equilibrium for all temperatures and NQR lines. Then, assuming that magnetic fluctuations are responsible for the nuclear relaxation process, the relaxation curves were fitted to Eq. (1) using calculated prefactors and exponents (Table. I) for the observed value of = 0.423. The experimental results and fitted curves are shown in Fig. 2. Here, we have a perfect match between the two for all temperatures and NQR lines, providing very strong evidence that the relaxation process is totally governed by magnetic fluctuations and yielding assurance to the accuracy of the values that were extracted.
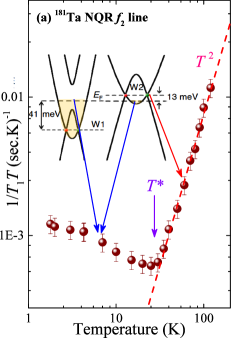
The temperature dependence of 1/ has been measured mainly for the -line and the obtained result is shown in Fig. 3(a). One can immediately observe that there exists a characteristic temperature 30 K, where the relaxation process has a crossover from a high temperature behavior (which is presumably associated with the excitations in the nodal structure of Weyl points) to the low temperature Korringa excitationsKorringa (1950) for parabolic bands ( and ) with a weak temperature dependence.
Quite generally, 1/ can be expressed using the wave vector () and frequency () dependent magnetic susceptibility , characterizing the magnetic excitations in a system as,Katayama et al. (2007)
| (4) |
where () is the transverse component of imaginary part of (), is the nuclear gyromagnetic ratio and is the -dependent hyperfine coupling constant. Presently, a proper microscopic theory to accurately calculate () for multi-band systems is lacking. Consequently, we have evaluated a theoretical estimate for 1/ based on non-interacting itinerant electrons approximation, using standard DFT. In the band structure of TaP, besides the normal bands, two types of Weyl points appear. The first set of Weyl points, termed W1 and located in the = 0 plane, and lie 40 meV below . The second set of Weyl points, W2, which lie nearly in the = / plane ( is the lattice parameter along ) are 13 meV above .Arnold et al. (2016) This feature is shown schematically in the insert of Fig. 3(a) (see details in Supplement). Based on this band structure, one can easily imagine that the conventional Korringa process is valid for very low temperatures, with the upper bound limited by the energy of W2. Upon further increasing the temperature, excitations at the Weyl node W2 should become progressively dominant. Then, 1/ may be phenomenologically expressed in a two-channel relaxation model by
| (5) | |||||
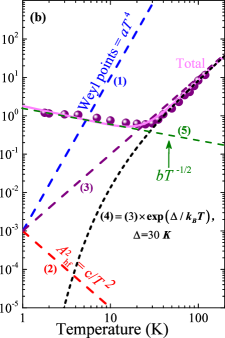
where, the first term corresponds to excitations associated with parabolic bands () via the conventional Korringa processKorringa (1950) with the hyperfine coupling constant . The second term is characteristic to the excitations of the Weyl nodes and linear bands () with . Herein, we have ignored the dependence. is the scaling factor. The term = ]1/2 depends on the nodal structure and is the Fermi distribution function. Because of the gap () between W2 and , we include an activation term, in the second process. In general, for the point nodal case, we know , and ; accordingly 1/ , which was observed experimentally for a point node superconductor.Katayama et al. (2007) Recently, anomalous hyperfine coupling due to orbital magnetism in the Weyl node has been predicted theoretically,Okvátovity et al. (2016) where the orbital contribution to has a 1/ dependence. Then, the second term of Eq. (5) becomes . For the first term ( < 30 K), experimental data shows a temperature dependence, despite the temperature independence of the Korringa process. The origin of this is not clear but we may speculate that correlation among excited quasiparticles may affect it. Setting (30 K), the expected temperature dependence is obtained by summing up the above contributions. As schematically shown in Fig 3. (b), choosing = 10-3, Eq. (5) is in fairly good agreement with the experiment. In particular, we clearly see a dependence for which we believe to be the manifestation of Weyl fermion excitations near the Weyl points in TaP.
In conclusion, we have reported the observation of a complete set of 181Ta NQR lines in Weyl semimetal TaP. All observed NQR lines are consistently assigned to the transitions between - and (+1)- states ( = 5/2, 3/2 and 1/2). From our measurements, we obtain an asymmetry parameter = 0.423 and a quadrupole coupling constant of = 19.250 MHz. These findings are in good agreement with DFT calculations which provide = 0.33 and = 20.057 MHz. The low energy excitations as a function of temperature were probed through the Ta spin lattice relaxation rate (1/) which shows a pronounced behavior above = 30 K and a behavior below . The relaxation process below is mostly related to the conventional density of states () which yields an almost constant density of states at (Korringa process). However, we have to postulate correlation effects as an origin for the behavior below . For > , by taking into account temperature dependent orbital hyperfine coupling and activation-type relaxation processes to the W2 points, we were able to explain the behavior in a convincing way. For the unique case of the Ta-based WSM, we have shown that the NQR method is a direct local probe for low energy Weyl fermion excitations in the bulk. This is rather important because such excitations are one of the main ingredients for the unconventional electrons transport found in these new materials. It would be interesting to take a deeper look into other conventional bulk probes such as thermo-power to explore signatures of Weyl fermions, and to extend the NQR study to other Ta-based Weyl- and Dirac- semi metals.
We thank B. Dóra for discussions and critical reading of the manuscript. Discussions with H. Harima, K. Kanoda, M. Majumder and E. Hassinger are also appreciated. T. K., Y. K. and H.T. appreciate the financial support from JSPS KAKENHI Grants (Nos.15K21732 and 15H05885).
References
- Castro Neto et al. (2009) A. H. Castro Neto, F. Guinea, N. M. R. Peres, K. Novoselov, and A. Geim, Rev. Mod. Phys. 81, 109 (2009).
- Kane and Mele (2005) C. L. Kane and E. J. Mele, Phys. Rev. Lett. 95, 146802 (2005).
- Bernevig et al. (2006) B. A. Bernevig, T. L. Hughes, and S. C. Zhang, Science 314, 1757 (2006).
- Hasan and Kane (2010) M. Z. Hasan and C. L. Kane, Rev. Mod. Phys. 82, 3405 (2010).
- Wehling et al. (2014) T. O. Wehling, A. M. Black-Schaffer, and A. V. Balatsky, Advances in Phys. 63, 1 (2014).
- Young et al. (2012) S. M. Young, S. Zaheer, J. C. Y. Teo, C. L. Kane, E. J. Mele, and A. M. Rappe, Phys. Rev. Lett. 108, 140405 (2012).
- Wang et al. (2013) Z. Wang, H. Weng, Q. Wu, X. Dai, and Z. Fang, Phys. Rev. B 88, 125427 (2013).
- Weng et al. (2015) H. Weng, C. Fang, Z. Fang, B. A. Bernevig, and X. Dai, Phys. Rev. X 5, 011029 (2015).
- Shekhar et al. (2015) C. Shekhar, A. K. Nayak, Y. Sun, M. Schmidt, M. Nicklas, I. Leermakers, U. Zeitler, Y. Skourski, J. Wosnitza, Z. Liu, Y. Chen, W. Schnelle, H. Borrmann, Y. Grin, C. Felser, and B. Yan, Nature Physics 11, 645+ (2015).
- Sun et al. (2015) Y. Sun, S.-C. Wu, and B. Yan, Phys. Rev. B 92, 115428 (2015).
- Xu et al. (2015) S.-Y. Xu, I. Belopolski, D. S. Sanchez, C. Zhang, G. Chang, C. Guo, G. Bian, Z. Yuan, H. Lu, T.-R. Chang, P. P. Shibayev, M. L. Prokopovych, N. Alidoust, H. Zheng, C.-C. Lee, S.-M. Huang, R. Sankar, F. Chou, C.-H. Hsu, H.-T. Jeng, A. Bansil, T. Neupert, V. N. Strocov, H. Lin, S. Jia, and M. Z. Hasan, Science Advances 1 (2015), 10.1126/sciadv.1501092.
- Arnold et al. (2016) F. Arnold, C. Shekhar, S.-C. Wu, Y. Sun, R. D. dos Reis, N. Kumar, M. Naumann, M. O. Ajeesh, M. Schmidt, A. G. Grushin, J. H. Bardarson, M. Baenitz, D. Sokolov, H. Borrmann, M. Nicklas, C. Felser, E. Hassinger, and B. Yan, Nature Comm. 7 (2016), 10.1038/ncomms11615.
- Curro (2011) N. Curro, "Quadruplole NMR of superconductors" in Encyclopedia of Magnetic Resonance (John Wiley & Sons, Ltd., 2011).
- Curro (2009) N. J. Curro, Reports on Progress in Physics 72, 026502 (2009).
- Walstedt (2008) R. E. Walstedt, The NMR Probe of High-Tc Materials, Springer Tracts in Modern Physics, Vol. 228 (Springer-Verlag Berlin Heidelberg, 2008).
- Kuramoto and Kitaoka (2000) Y. Kuramoto and Y. Kitaoka, Dynamics of heavy electrons (Oxford University Press INC. New York, 2000).
- Aeppli and Fisk (1992) G. Aeppli and Z. Fisk, Comments Condens. Matter Phys. 16, 155 (1992).
- Riseborough (2000) P. Riseborough, Adv. Phys. 49, 257 (2000).
- Caldwell et al. (2007) T. Caldwell, A. P. Reyes, W. G. Moulton, P. L. Kuhns, M. J. R. Hoch, P. Schlottmann, and Z. Fisk, Phys. Rev. B 75, 075106 (2007).
- Brüning et al. (2010) E. M. Brüning, M. Brando, M. Baenitz, A. Bentien, A. M. Strydom, R. E. Walstedt, and F. Steglich, Phys. Rev. B 82, 125115 (2010).
- Okvátovity et al. (2016) Z. Okvátovity, F. Simon, and B. Dóra, ArXiv e-prints (2016), arXiv:1609.03370 [cond-mat.mes-hall] .
- Mitrović et al. (2001) V. F. Mitrović, E. E. Sigmund, and W. P. Halperin, Phys. Rev. B 64, 024520 (2001).
- Chepin and Ross (1991) J. Chepin and J. H. Ross, J. Phys.: Condens. Matter 3, 8103 (1991).
- Abragam (1961) A. Abragam, The Principle of Nuclear Magnetism (Cladendon, Oxford, 1961).
- Slichter (1989) C. P. Slichter, Principles of Magnetic Resonance (Springer, New York, 1989).
- Koepernik and Eschrig (1999) K. Koepernik and H. Eschrig, Phys. Rev. B 59, 1743 (1999).
- Perdew and Wang (1992) J. P. Perdew and Y. Wang, Phys. Rev. B 45, 13244 (1992).
- Koch et al. (2010) K. Koch, K. Koepernik, D. V. Neck, H. Rosner, and S. Cottenier, Phys. Rev. A 81, 032507 (2010).
- Korringa (1950) J. Korringa, Physica 16, 601 (1950).
- Katayama et al. (2007) K. Katayama, S. Kawasaki, M. Nishiyama, H. Sugawara, D. Kikuchi, H. Sato, and G. qing Zheng, Journal of the Physical Society of Japan 76, 023701 (2007).
Supplemental Material
S1 Temperature dependence of and
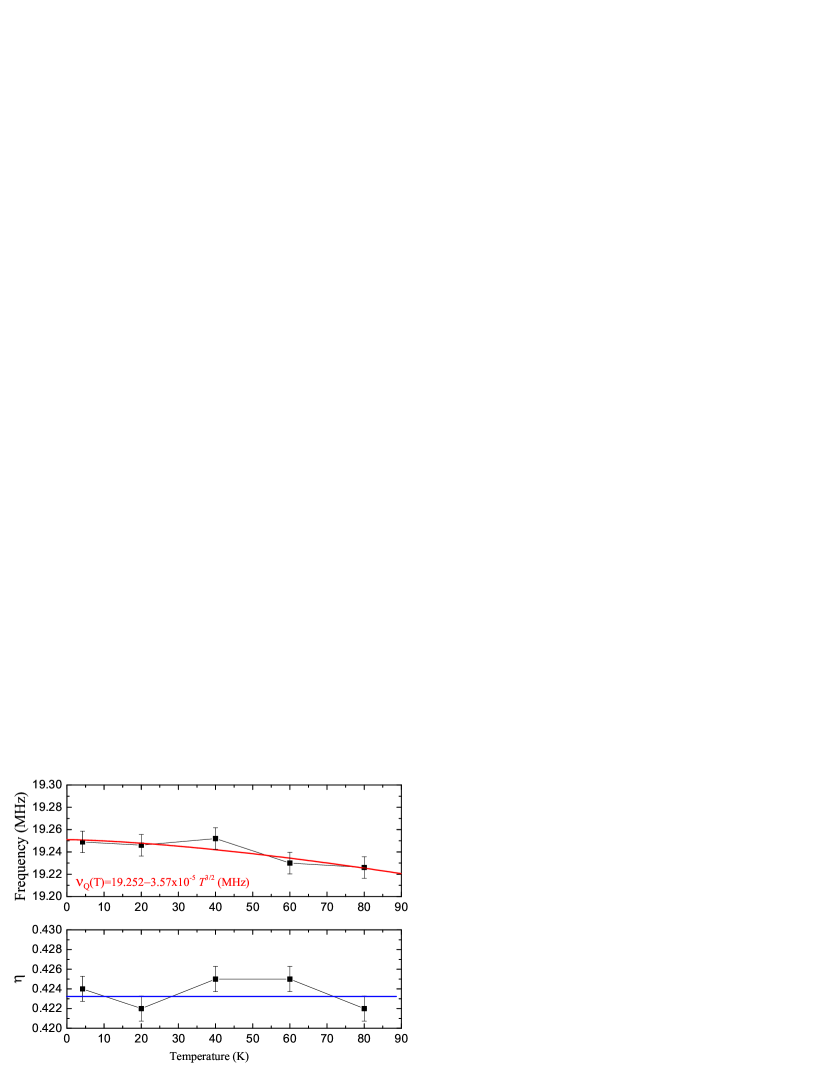
The temperature dependence of the quadrupole frequency generally decreases with increasing temperature (Fig. S1) which is correlated to the lattice expansion. Owing to the fact that the origin of the EFG is the non-spherical distribution of surrounding point charges it may be easy to understand the thermally activated anharmonic phonon vibrations. This mechanism may be applicable to the case where onsite electric contribution to the EFG is negligibly small, and using the characteristic phonon frequency , is expressed as
| (S1) |
where, is the temperature dependent phonon distribution function given by = coth()/2 and is a lattice structure dependent parameter. Although Eq. (S1) has been applied successfully to insulating Cu2O, the origin of the EFG in the present case is due to the onsite electric contribution related directly to the symmetry of the electronic wave function of the bands at the nucler site. In such a case, there is no analytical expression for . Therefore, we adopt an empirical form for conventional non-cubic metals,1976
| (S2) |
where there exists a correlation between the magnitude of (0) and the strength of the EFG’s temperature variation, quantified by the coefficient . A least-squares fit of the data above 60K to Eq. (S2) yields the following values: = 19.252 MHz, = 3.5710-5 K-3/2.
S2 Calculation of 1/ from non-interacting band structure in TaP
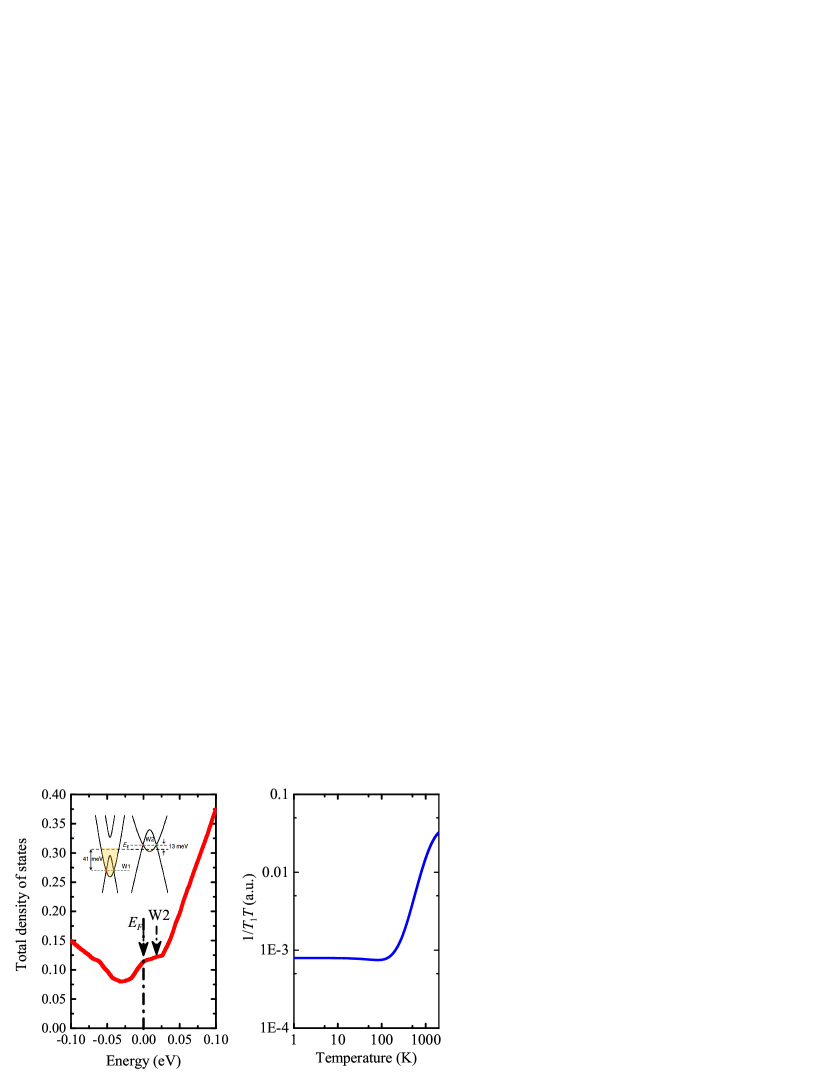
We have performed density functional theory calculations for the band structure of the TaP using the Vienna ab-initio simulation package (VASP)1991 employing the modified Becke-Johnson (MBJ) potential1996 for the exchange-correlation functions. Then we projected the DFT Bloch wave functions into the maximum localized Wannier functions by the Wannier90 package.2008 Based on the tight-binding Wannier Hamiltonian, we interpolate the density of states by a dense -grid of 400 400 400 in the first Brillouin zone. Calculated are shown in Fig. S2 (left). The nuclear spin-lattice relaxation rate for non-interacting electrons are calculated by the following formula2008 ; 2016 :
| (S3) | |||||
where, is the hyperfine coupling constant; , are the electronic and nuclear gyromagnetic ratios, respectively. The electronic density of states for spin up and spin down electrons is simply evaluated via Zeeman splitting = (we take = 0 here to estimate the zero field case). is the Fermi-Dirac distribution to include temperature dependent behavior and is the delta function. As we are mainly interested in the temperature-dependence of , the prefactors before the integral make no difference in the general trend. Thus, we normalized arbitrarily the calculated values to the experimental value at 2K, which is shown in Fig. S2 (right). Although the general feature is similar to the experiment, it should be noted that the energy scale of the point where 1/ starts increase is roughly one order of magnitude larger than the experimental value and the W2 energy. So, we can conclude that the increase of 1/ here is just due to the influence of other bands and not related to the excitations around Weyl points. One of the possible origins of this discrepancy is the lack of an adequate account of electron-electron interactions in theory.
References
- (1) J. Christiansen, P. Heubes, R. Keitel, W. Klinger, W. Loeffler,W. Sandner, and W. Witthuhn, Z. Phys. B: Condens. Matter 24,177 (1976).
- (2) J. Chepin and J. H. Ross, J. Phys.: Condens. Matter 3, 8103 (1991).
- (3) J. P. Perdew, K. Burke, and M. Ernzerhof, Phys.Rev.Lett. 77, 3865 (1996).
- (4) A. A. Mosto, J. R. Yates, Y. S. Lee, I. Souza, D. Vanderbilt, and N. Marzari, Comput. Phys. Commun. 178, 685 (2008).
- (5) Hirata Michihiro, Kyohei Ishikawa, Kazuya Miyagawa, Masafumi Tamura, Claude Berthier, Denis Basko, Akito Kobayashi, Genki Matsuno, and Kazushi Kanoda, Nature Communications 7 (2016).