Discovery of a soft X-ray 8 mHz QPO from the accreting millisecond pulsar IGR J00291+5934
Abstract
In this paper, we report on the analysis of the peculiar X-ray variability displayed by the accreting millisecond X-ray pulsar IGR J00291+5934 in a 80 ks-long joint NuSTAR and XMM-Newton observation performed during the source outburst in 2015. The light curve of the source was characterized by a flaring-like behavior, with typical rise and decay time scales of 120 s. The flares are accompanied by a remarkable spectral variability, with the X-ray emission being generally softer at the peak of the flares. A strong quasi periodic oscillation (QPO) is detected at 8 mHz in the power spectrum of the source and clearly associated with the flaring-like behavior. This feature has the strongest power at soft X-rays (3 keV). We carried out a dedicated hardness-ratio resolved spectral analysis and a QPO phase-resolved spectral analysis, together with an in-depth study of the source timing properties, to investigate the origin of this behavior. We suggest that the unusual variability of IGR J00291+5934 observed by XMM-Newton and NuSTAR could be produced by an heartbeat-like mechanism, similar to that operating in black-hole X-ray binaries. The possibility that this variability, and the associated QPO, are triggered by phases of quasi-stable nuclear burning, as suggested in the literature for a number of other neutron star binaries displaying a similar behavior, cannot be solidly tested in the case of IGR J00291+5934 due to the paucity of type-I X-ray bursts observed from this source.
keywords:
X-rays: binaries, stars: neutron, stars: pulsars, stars:pulsars: individual: IGR J00291+59341 Introduction
IGR J00291+5934 is one of the known accreting millisecond X-ray pulsars (AMXPs), i.e. low mass X-ray binaries (LMXBs) hosting a rapidly spinning neutron star and an evolved low mass companion. These systems are characterized by orbital periods ranging from 40 minutes to a few hours and spend most of their lifetime in a quiescent state, with a typical X-ray luminosity of 1031-1032 erg s-1. They undergo sporadic X-ray outbursts lasting from a few weeks to months, during which the accretion onto the compact object is largely increased and the resulting X-ray luminosity can be as high as 1036-1038 erg s-1 (see, e.g. Patruno & Watts, 2012, for a recent review).
IGR J00291+5934 is known to host the fastest rotating neutron star among the AMXPs, with a spin period of 1.67 ms. The source was discovered for the first time during an outburst in 2004 (Markwardt et al., 2004; Falanga et al., 2005) and displayed a double-peaked outburst in 2008 (Lewis et al., 2010; Patruno, 2010; Hartman et al., 2011). Archival RXTE data revealed that two other outbursts from IGR J00291+5934 might have occurred in 1998 and 2001 (Remillard, 2004).


The latest outburst from IGR J00291+5934 was detected in 2015 (Sanna et al., 2015) and closely monitored with Swift and INTEGRAL (De Falco et al., 2016, , hereafter DF16). A simultaneous XMM-Newton and NuSTAR observation of the source was also carried out during this event in order to study its broad-band spectral properties. The results obtained from the complete analysis of the XMM-Newton and NuSTAR data has been reported in a complementary publication from our group (Sanna et al. 2016, submitted; hereafter S16). In the present paper, we focus on the peculiar variability that characterizes the soft X-ray emission of the source during the 2015 outburst. We investigate the aperiodic variability in the XMM-Newton data and discuss mechanisms that could give rise to the observed phenomenology. We complement our report with some results obtained from a simultaneous NuSTAR observation.
2 Observations and data analysis
During the XMM-Newton observation of IGR J00291+5934, carried out on 2015 July 28 (OBSID 0790181401, see also S16), the EPIC-pn and the EPIC-MOS2 were operated in TIMING mode, while the EPIC-MOS1 was operated in small window. To analyze these data, we followed the standard data reduction procedures using the epchain and emchain tasks included in SAS v.15.0. No episodes of enhanced solar activity were revealed in the data, and thus the full exposure time available for all EPIC cameras was retained for scientific analysis. The count rate of the source was low enough not to cause any significant pile-up in the EPIC-pn and the EPIC-MOS2. However, the EPIC-MOS1 was largely affected by pile-up issues and thus discarded for further analysis. We extracted the EPIC-pn spectra and light curves of the source (background) from the CCD columns RAWX=[34–43] ([3–5]). For the extraction of the MOS2 products, we used all events detected from the source within the RAWX columns 293–320 of the chip operated in TIMING mode. The background products were obtained from the chips operating in imaging mode selecting a source-free region. We verified a posteriori that different reasonable choices of the background extraction region did not affect significantly the obtained results. We restricted our analysis of the full resolution EPIC spectra to the energy interval 2.3–11 keV for the EPIC-pn and 0.5–10.0 keV for the EPIC-MOS2 in order to limit the impact of any instrumental energy calibration uncertainty (see also Ferrigno et al., 2014, and references therein). This restriction was not necessary for the coarsely rebinned spectra used for the analysis presented at the end of Sect. 4. For completeness, we also report in the sections below some results obtained from the NuSTAR observation carried out simultaneously with XMM-Newton (OBSID. 90101010002). We extracted for both instruments on-board NuSTAR (FPMA and FPMB) cleaned event files for the source by performing the same standard screening and filtering discussed by S16. We refer the reader to this paper for additional NuSTAR data analysis details that are omitted here for brevity.
3 The X-ray variability and spectral changes
The light curve of the source as observed by the EPIC-pn is reported in Fig. 1 with a bin time of 10 s. It can be easily noticed that the source displayed a peculiar variability in the X-ray domain, with quasi-periodic flares raising and fainting down on a time scale of roughly 100 s.
To investigate the origin of this variability, we first computed the ratio between the light curves in the 1.5–11 keV and 0.5–1.5 keV energy ranges. We used an adaptive rebinning in order to achieve a signal-to-noise ratio (S/N) of at least 15 in each time bin and maintain a minimum bin duration of 10 s. The result is shown in Fig. 2. It is evident from this figure that the emission of the source becomes generally (but not always) harder between one flare and the other, with the hardness ratio (HR) inversely changing with respect to the trend of the source intensity. This is also visible in the plot of the source HR versus the intensity reported in Fig. 3.


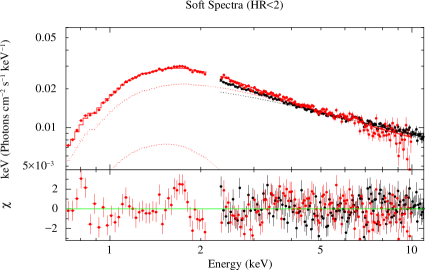
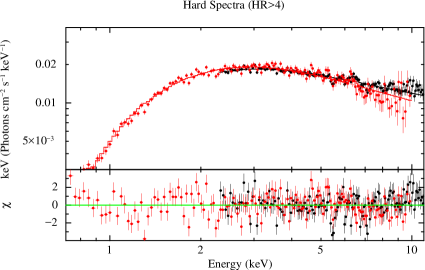
As the HR variations are most likely produced by changes in the spectral parameters of the source, we extracted two sets of EPIC spectra by stacking together the time intervals corresponding to HR2 and HR4. These two HR values were chosen by visually inspecting the light curves in Fig. 2 and to maximize the variability between the two sets of spectra. The result is shown in Fig. 4. The softer spectra are characterized by a significantly enhanced emission below 2 keV. An acceptable fit to the soft spectra is obtained by using the same model adopted by S16 to describe the broad-band spectrum111We did not report here the analysis of the source average XMM-Newton spectrum as this has been exhaustively discussed by S16. of IGR J00291+5934, i.e. an absorbed black-body plus an nthcomp Comptonized component and a Gaussian to take into account the iron K line emission (the complete model in Xspec is Constant*TBabs*(BBodyrad+nthcomp+Gauss)). No absorption column density variations can be evidenced between the two spectra. In the hard spectrum, we did not find evidence for a significant BBodyrad component and thus we did not include it in the fit. We found that, if such component is included in the fit, with a temperature fixed at that determined from the soft spectra, then the upper limit on the normalization would be a factor of 15 lower than that in the soft spectra. As reported by S16, we found a discrepancy between the spectral slope of the EPIC-pn and the MOS2 data of about 6% that we attribute to remaining calibration uncertainties of the EPIC instruments in timing mode. Following their approach, we did not tie together in the fit the value of the photon index of the nthcomp component between the EPIC-pn and the EPIC-MOS2 spectra. The results obtained by fitting the HR resolved spectra are summarized in Table 1. Note that we did not make use of the RGS data because the read-out time of this instrument is too large to be able to follow the fast HR variations displayed by the source (typically from less than a second to a few seconds at the most). We verified that there are no significant changes in the pulse profile of the source and in the measured pulsed fraction during the time intervals corresponding to different HR with respect to the values reported in S16 for the full observation.
| Parameter | HR | HR2 | |
|---|---|---|---|
| (1022 cm-2) | 0.350.02 | 0.31 | |
| (keV) | — | 0.42 | |
| a (km) | — | 3.8 | |
| (pn) | 1.550.02 | 1.610.01 | |
| (MOS2) | 1.680.05 | 1.690.02 | |
| b (keV) | 29 | 29 | |
| 0.630.02 | 0.29 | ||
| 6.380.08 | 6.520.07 | ||
| 0.13c | 0.130.06 | ||
| 0.0320.12 | 0.024 | ||
| d (10-11 erg cm2 s-1) | 2.0 | 5.0 | |
| d (10-10 erg cm2 s-1) | 1.900.03 | 1.730.02 | |
| /d.o.f. | 1.40/294 | 1.48/298 | |
| e | 1.0 | 1.0 | |
| e | 1.080.02 | 1.150.02 | |
| Exp. Time (ks) | 6.0 | 23.6 |
-
a:
This is evaluated for a distance of 4 kpc.
-
b:
This value could not be well determined in the fit and thus we fixed to the value measured from the source average spectrum reported by S16.
-
c:
This parameter could not be reliably measured from the fit and was thus fixed to the value determined from the fit to the HR4 spectra.
-
d:
This is the observed flux, i.e. not corrected for absorption.
-
e:
We fixed to 1 the normalization constant of the EPIC-pn spectrum.
4 The timing analysis
In order to pursue the investigation on the mechanism triggering the atypical variability of IGR J00291+5934, we performed a dedicated timing analysis of the EPIC-pn and NuSTAR data focusing on the aperiodic noise rather than on the coherent pulsation, investigated by S16. We first converted the arrival time of each photon detected to the solar system barycenter using the known optical position of the source (Torres et al., 2008).
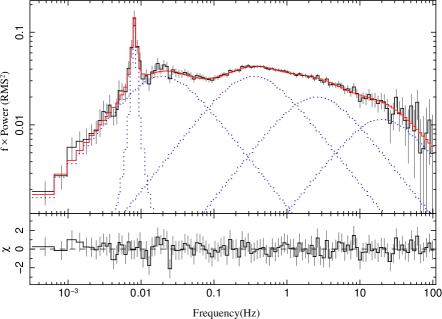
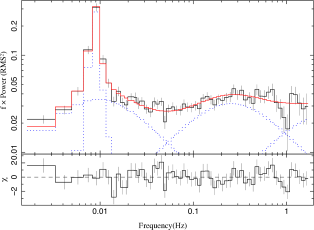
We extracted a power spectrum of the source in the entire energy range available (0.5–11 keV) from the EPIC-pn light curve binned at 2.952 ms. The power spectrum was averaged over 23 intervals covering each bins (i.e., about 3095 s) and then logarithmically rebinned with a factor of 0.1. From the fit to the power spectrum in the Lehay normalization, we measured a white noise of and subtracted the latter from the data before performing any other investigation. The source power spectrum in the rms2 normalization (see Uttley et al., 2014, for a comprehensive review on timing techniques) is shown in Fig. 5.
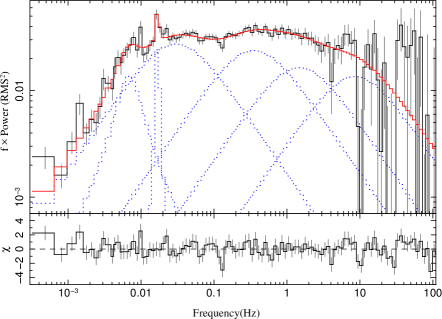
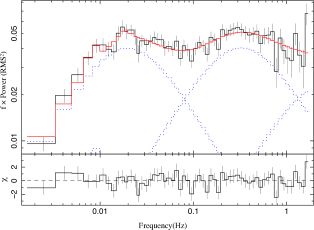
For NuSTAR, we extracted the source light curves in the 3–60 keV energy band for both the FPMA and FPMB detectors with bins of 2.952 ms and computed the cospectrum, i.e. the real part of the cross power density spectrum, as a best estimate of the white-noise subtracted power density spectra. This procedure is necessary to take into account the effect of dead time in the FPMA and FPMB as detailed in Bachetti et al. (2015). We computed the cospectrum in stretches of bins, discarding intervals with gaps due to the satellite orbit around the Earth and other screening criteria. This procedure ensures a sample of 11 cospectra, whose average is then logarithmically rebinned with a step of 0.1. The result is plotted in Fig 6.
As commonly done for other AMXPs, we used a set of zero-centered Lorentzians to fit the broad-noise component of the power (cross) spectrum and included additional Lorentzian components to take into account the presence of frequency-confined features. For the zero-centered Lorentzians, we used the expression:
| (1) |
where is the frequency and is the half width of the Lorentizian. For the two Lorentzians describing the features at 8 mHz and 16 mHz, we used the expression:
| (2) |
where “QPO” stands for Quasi Periodic Oscillation, is the quality factor defined as the centroid frequency () of the feature divided by its full width at half maximum (FWHM). This function can be used to describe broader noise components with characteristic frequency , when the quality factor is of order unity or lower. All timing analysis and fits were performed using ISIS (Houck & Denicola, 2000) expanded by SITAR222http://space.mit.edu/cxc/analysis/SITAR/. The results of model fitting are computed in the frequency range –165 Hz and summarized in Table 2.
| Parameter | EPIC-pn | NuSTAR | ||
|---|---|---|---|---|
| L1 rms | 0.206 | 0.187 | ||
| L1 W [Hz] | 0.0198 | 0.030 | ||
| L2 rms | 0.205 | 0.174 | ||
| L2 W [Hz] | 0.35 | 0.35 | ||
| L3 rms | 0.160 | 0.14 | ||
| L3 W [Hz] | 2.5 | 1.5 | ||
| L4 rms | 0.120 | 0.131 | ||
| L4 W [Hz] | 20 | 9 | ||
| QPO1 rms | 0.15 | 0.12 | ||
| QPO1 Q | 9 | 1.2 | ||
| QPO1 [Hz] | 0.00807 | 0.0063 | ||
| QPO2 rms | – | – | 0.066 | |
| QPO2 Q | – | – | 6 | |
| QPO2 [Hz] | – | – | 0.0168 | |
| /d.o.f | 0.45 | /107 | 1.29 | /99 |
In the EPIC-pn data, we find a prominent narrow feature at 8 mHz, resembling a QPO (see, e.g., Wang, 2016, for a recent review), while the broad-band noise is characterized by four zero-centered Lorentzians (L1–L4). In the harder NuSTAR band, the broad-band noise has a similar shape, while the narrow 8 mHz feature disappears, substituted by a narrow weak feature at roughly double its frequency (QPO2 in Table 2 with rms 7%) and by a broader component at a slightly lower frequency (6 mHz).
In order to investigate further the strong QPO at 8 mHz, visible only in the XMM-Newton data, we divided the EPIC-pn energy range in 12 intervals characterized by the same number of detected X-ray photons. For each interval, we extracted a light curve binned at 0.2952 s. We computed the power density spectra averaging over intervals of time bins (i.e., about 604 s resulting in 119 samples). This choice ensures that the QPO remains coherent in each time interval (based on the lower boundary of the uncertainty we determined on the QPO quality factor in Table 2) and all its power is confined in a single Fourier bin. Then, we rebinned them geometrically with a factor of 0.1, and normalized them to the usual rms convention. All rebinned and normalized power spectra are modeled by three zero-centered Lorentzians with width 0.02, 0.4 Hz, and 2.5 Hz (the latter fixed at the value of Table 2), plus two narrower Lorentzians to take into account the QPO at 8 mHz and a second feature around 16 mHz.
Two examples of XMM-Newton power spectra are shown in Fig. 7, together with the corresponding best-fit models and the residuals from the fits.
In Fig. 8, we show the energy dependency of the best-fit parameters measured from the EPIC-pn data for the two features at 8 mHz and 16 mHz, together with those of the broad-noise Lorentzians. The frequency of the QPO at 8 mHz remains constant at all energies, while its rms dramatically decreases above 1.5–2 keV. The quality factor Q, is poorly determined owing to our choice of frequency binning. We have verified that the trend on rms would be maintained with other reasonable choices of binning. The feature at 16 mHz disappears at those energies at which the QPO at 8 mHz is more prominent and seems to be significantly broader than this other feature. To check whether the higher frequency feature is the harmonic of the QPO at 8 mHz, we applied the method outlined in Ingram & van der Klis (2015). For each light curve in one of the defined energy band for XMM-Newton that was Fourier transformed, we computed the ratio between the modules of the Fourier transform and the phase difference at the respective frequencies. We found that the computed values of the ratios and phase differences do not cluster around any preferred values, at odds with what is expected if the two features at 8 mHz and 16 mHz are linked. We thus suggest that these feature are not correlated and could be possibly produced by different mechanisms.


The prominent QPO at 8 mHz detected in both the averaged and energy-resolved XMM-Newton power spectra of IGR J00291+5934 is clearly associated with the X-ray variability of the source that, as shown in Sect. 3, undergoes continuous flares. The typical time scale of the rise and decay of these flares is comparable with the QPO frequency. By inspecting the source dynamical power spectra, we also verified that the 8 mHz QPO does not drift in frequency and it is present throughout the entire observation. As the intensity variations of the source during the flares are also accompanied by significant spectral changes (see Sect. 3), we investigated the dependence of the energy distribution of the source X-ray emission as a function of the QPO phase. We follow the procedure outlined by Ingram & van der Klis (2015) and Ingram et al. (2016). A key ingredient in this method is the average phase lag of the source signal at the QPO frequency, compared to a reference band. This can be obtained in each energy band by averaging the complex argument of the cross spectra over the 119 intervals of 211 bins defined before. The cross spectrum is computed assuming as band of interest the energy intervals used above and as reference band the full EPIC-pn energy band minus the energy band of interest. To obtain the uncertainty on the phase lag (Eq. 12 in Uttley et al. 2014), we computed the average coherence and its uncertainty using Eq. (2) and (8) in Vaughan & Nowak (1997). In Fig. 9, we show the resulting correlation and the time lags at the frequency of the QPO. It can be noticed that as long as the QPO is characterized by a fractional rms larger than 0.1 at energy 3.5 keV, the light curve at the QPO frequency is linearly correlated to the average EPIC-pn signal, whereas the linear correlation is reduced at higher energies. This analysis reveals that the modulation of the X-ray flux at the frequency of the QPO has a delay of few seconds on the soft X-ray photons compared to those at the higher energies (1.5-2 keV).

The energy-dependent wave front of the QPO in our 12 energy bands can be described in the Fourier space by:
| (3) |
where is the mean count-rate of the source, while and are the fractional rms and the phase shift of the -th harmonic, respectively. In the case of IGR J00291+5934, only the fundamental of the QPO was detected and thus . The parameter can be obtained from the fit of the real part of the average cross spectrum (the values are reported in Fig. 8), while the phase shift computation is described in the previous paragraph. A set of source spectra accumulated at different QPO phases () can be extracted by transforming the QPO wave front in the time domain using the following expression:
| (4) |
Here can be obtained by appropriately rebinning the average EPIC-pn and EPIC-MOS 2 spectra. Owing to the lower effective area of the EPIC-MOS 2, we use the timing results from the EPIC-pn for both instruments. To derive the uncertainties on , we adopted a bootstrapping technique: 10 000 wave fronts were computed for each energy bin by varying their rms and phase shift within the corresponding confidence intervals assuming a Gaussian distribution. The resulting mean value of the distribution was then assumed as the best estimate of , while the standard deviation of the distribution is considered as the associated 1 uncertainty. The obtained spectra were then fit with the same model333We did not include the iron line due to the reduced energy resolution of these spectra compared to those discussed in Sect. 3. used for the HR resolved spectra: Constant*TBabs*(BBodyrad+nthcomp). As for the spectral analysis of Sect. 3, we used different slopes for the power-law for the two instruments and an inter-calibration constant. We fixed in the fit the value of =29 keV as done in Sect. 3 and =0.9 keV, according to the results found by S16 (none of these two parameters could be reliably constrained). Despite the limited energy resolution and the uncertainty in the QPO front reconstruction, it was possible to extract up to 10 spectra at different QPO phases, still detecting significant variations on the corresponding spectral parameters. The results of this analysis are summarized in Fig. 10, where the black-body radius is calculated by assuming a distance of 4 kpc (DF16) and the parameter is the one determined for the EPIC-pn. The EPIC-MOS 2 parameters follow a similar trend with slightly different absolute values and larger uncertainties, while the cross-calibration term was verified to be constant and then fixed to its average value. The plot suggests a moderate variability of spectral slope and absorption column density over the QPO phases. The radius and temperature of the black-body, and the nthcomp normalization display the most noticeable variations. We also derived the flux of the black-body, which shows how the variations of temperature and radius compensate each other at a certain extent, showing that the thermal emission is responsible for only a part of the flux variability.

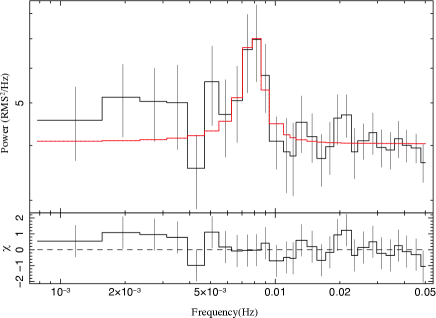
We also investigated if and how the QPO affects the pulsed emission recorded from IGR J00291+5934. Using the ephemeris of S16, we extracted, every ten seconds during the XMM-Newton observation, a pulse profile of the source with 16 phase bins in the energy range 0.5–3 keV, where the QPO is more prominent. Then, we derived the value of the fractional amplitude in each case by measuring the amplitude of the fundamental mode of the pulsed emission and dividing it by the source average intensity during the considered time interval. The power density spectrum of the time series of the fractional amplitudes could then be obtained with a reasonably good resolution in frequency by using stretches of 64 bins (we also applied a logarithmic rebinning of 1.1). The resulting 54 independent power spectra were then averaged assuming in each case a 100% uncertainty to obtain the results shown in Fig. 11. This averaged PSD was normalised in accordance to the rms2 convention and then fit with a constant plus a QPO function. We measured a normalization constant of 4.00.2 and obtained for the QPO parameters: mHz, , and norm= at 90% c.l. As the averaged PSD was not obtained from a Poissonian signal the parameters derived from the fit loose their usual meaning, but the detection of the QPO unambiguously indicates that the mechanism giving rise to the aperiodic variability in IGR J00291+5934 is also affecting the amplitude of the source pulsed emission.
5 Discussion and conclusions
In this paper we investigated the origin of the peculiar flaring-like X-ray variability showed by IGR J00291+5934 during its latest outburst in 2015 and giving rise to a prominent 8 mHz QPO in the source power spectra extracted at energies 2 keV. This behavior is not common among AMXPs in outburst, but there are a few examples of both neutron stars and black-hole binaries in which an X-ray variability on a similar time scale was detected.
A flaring like-behavior in the mHz band, which vaguely resemble what we observed from IGR J00291+5934, was recorded in 2010 from the transient neutron star LMXB IGR J174802446 during its first detectable outburst (Bordas et al., 2010). In this occasion, the thermonuclear X-ray bursts from the source were observed to increase in frequency and decrease in intensity while the source was approaching the peak of the outburst. When the persistent luminosity of the sources reached 10-50% of the Eddington value, the bursts were so regularly spaced one from the other to produce a prominent QPO in the power spectrum of the source at about 2-5 mHz. The main difference with the case of IGR J00291+5934 is that the “flares” observed around the peak of the outburst from IGR J174802446 were clearly of thermonuclear origin and the corresponding spectral energy distribution could be very well described by assuming a single black-body component (see, e.g. Linares et al., 2012, and references therein).
Our HR-resolved spectral analysis carried out in Sect. 3 reveal that the flares observed from IGR J00291+5934 are typically (but not always) characterized by a softer emission close to the peak and a much harder emission during the decay. However, in none of these cases, the spectral energy distribution could be successfully described with a simple thermal component, being the nthcomp component the dominant contribution in all observable energy range. The softer spectra are characterized by a prominent thermal component that is not present in the harder spectra (or at least largely suppressed). The Comptonization component does not display comparable large changes, as confirmed by the lack of any major variation in the 2-10 keV X-ray flux compared to the factor 4 recorded in the 0.5-2 keV energy band. According to the usual scenario of mass accreting onto a NS in a LMXB, it seems reasonable to assume that the thermal component is most likely generated onto the surface of the compact object, as the temperature is around 0.3-0.6 keV and the radius is of only a few km. The Comptonization processes giving rise to the harder spectral component can occur in the accretion column of the NS or closer to the surface of the disk or in both locations (Falanga & Titarchuk, 2007). Thus, the spectral variability accompanying the flares of IGR J00291+5934 is more complex than that expected during thermonuclear bursts. This disfavors the possibility that the flares from IGR J00291+5934 have a thermonuclear origin.
The AMXP SAX J1808.43658 is known to display a flaring-like behavior both close to the peak of the outburst (the so-called “high luminosity flaring”) and late in the outburst decay (“low luminosity flaring”). During these periods, the source shows flares with typical rise and decay times of 0.2–1 s, giving rise to prominent QPOs at frequencies of 1–5 Hz (see Patruno et al., 2009; Bult & van der Klis, 2014, and references therein). These features have been interpreted in terms of the so-called “dead-disk instability”, according to which accretion can proceed in an unstable way when the inner disk boundary is located close to the co-rotation radius where the propeller mechanism is supposed to set-in (see, e.g., Romanova et al., 2004, and references therein). In this scenario, modest variations of the instantaneous accretion rate can move the inner disk radius inside and outside co-rotation, alternating between short periods of enhanced and inhibited accretion (see, e.g., D’Angelo, 2014). The precise time scale on which the inner boundary of the disk is moved inward or away from the compact object (and thus the correspondingly generated QPO frequency) depends mainly on the physical conditions in the accretion disks and on the properties of the NS (spin period and magnetic field strength). As SAX J1808.43658 and IGR J00291+5934 are located at a similar distance and both achieve a typical peak X-ray flux during outbursts of few10-9 erg cm-2 s-1 (see Fig. 1 in DF16), we should expect to observe in both systems a QPO produced by this mechanism at roughly the same frequency (note that the spin period of IGR J00291+5934 is shorter than that of SAX J1808.43658, but the co-rotation radius is only 30% larger). This conclusion challenges the applicability of the dead disk model to the case of IGR J00291+5934, as the frequency of the QPO reported in Sect. 4 is 100 times smaller than that of the QPOs detected from SAX J1808.43658. Furthermore, the dependence of the QPO rms on energy is opposite in the two sources: the rms of the QPOs observed from SAX J1808.43658 dramatically increases with energy while the QPO reported in IGR J00291+5934 is only detectable below 2 keV. This suggests that the two phenomena are most likely triggered by different mechanisms. A similar conclusion applies to the case of the AMXP NGC 6440 X-2. This source also showed during its outburst in 2010 a flaring-like behavior and a prominent QPO at 1 Hz with an rms increasing strongly with energy (Patruno et al., 2010; Patruno & D’Angelo, 2013).
Some dipping sources also displayed a strong quasi periodic variability with a typical frequency of 1 Hz and an high rms amplitude over a band-limited noise (Homan, 2012). These QPOs have been interpreted as being due to self-obscuration of the precessing accreting material, which is misaligned from the rotational axis of the pulsar. At odds with these sources, however, IGR J00291+5934 is not characterized by a high inclination (X-ray eclipses are not detected) and its QPO has a completely different frequency and energy dependence (disappearing above 2 keV instead of being virtually achromatic as in dipping sources).
Two more striking cases are those of 4U 1636536 and 4U 160852, two X-ray bursters and Atoll sources which displayed in a few occasions soft X-ray QPOs (5 keV) with frequencies of about 8 mHz and rms of a few percents (Revnivtsev et al., 2001; Altamirano et al., 2008). These oscillations were detected just before the occurrence of a type-I burst in a specific limited range of the source X-ray flux and observed to disappear immediately afterwards. In a few observations, the QPO also reappeared several kiloseconds after the burst (Lyu et al., 2015, 2016). A similar phenomenon was also reported in the case of the intermittent AMXP Aql X-1. The disappearance of the QPO immediately after the onset of a thermonuclear explosion led to the suggestion that this feature could be related to episodes of marginally stable nuclear burning. As explained theoretically by Heger et al. (2007), in this situation the X-ray luminosity of the source can display oscillations on the time scale of roughly two minutes but the expected range of mass accretion rates for which such a phenomenon could manifest is a factor of 10 higher than that measured from 4U 1636536 and 4U 160852 when the QPOs were observed. A possible way out could be to assume that the nuclear burning only occurs on a small fraction of the NS surface, even though this would require magnetic field intensities for the compact object much larger ( G) than those expected in these systems (108-9 G).
In the case of IGR J00291+5934, the possibility that the QPO is associated with the marginally stable nuclear burning is very hard to investigate as the sole and only type-I X-ray burst ever detected from the source occurred roughly three days before the XMM-Newton and NuSTAR observations (see DF16). As we cannot firmly conclude about any association between the QPO and the nuclear burning, we investigate below the alternative possibility (mentioned also by Revnivtsev et al., 2001) that the variability observed from IGR J00291+5934 is driven by a mechanism more similar to that operating in black-hole binaries (BHBs) and giving rise to the so-called “heartbeats” (see, e.g., Belloni et al., 2000; Altamirano et al., 2011). This phenomenon produces a flare-like variability on times scales similar to those observed from IGR J00291+5934 and the spectral changes measured during the peaks and valleys of these flares have been associated with the movement of the inner disk boundary closer or further away from the event horizon. Even though the variability shown by the BHBs during the heartbeats is rather complicated, it is generally found that at the peak of the flares the temperature (radius) of the thermal component increases (decreases) and the opposite occurs during minima (Neilsen et al., 2011; Capitanio et al., 2012; Mineo et al., 2012). The origin of this behavior is not fully understood but it could be related to the Lightman-Eardley instability of the accretion disk that appears when the central source approaches the Eddington luminosity (Done et al., 2004). While this interpretation would work well in the case of the bright BHB GRS 1915+105, its application to the case of the sole other BHB displaying heartbeats, IGR J170913624, is more challenging (but see also the cases of H1743322 and IC 10 X-1 Altamirano & Strohmayer, 2012; Pasham et al., 2013). The distance to the latter system and the mass of the BH hosted in it are not known, but the luminosity observed from this source during the heartbeat state is believed to be orders of magnitude lower than that of GRS 1915+105, unless the system is located beyond 20 kpc or the central BH is endowed with the lowest mass ever measured for such an object (Altamirano et al., 2011). Therefore, it cannot be excluded that heartbeats can also appear in low luminosity systems as IGR J00291+5934.
The luminosity achieved by IGR J00291+5934 during the XMM-Newton observation is of the order of 1036 erg s-1 (assuming a distance of 4 kpc), and thus far from the Eddington limit. The spectral changes measured during the flares is also dissimilar to what is observed from the BHBs displaying heartbeat variability, but we should remember that in the case of the present source there is a NS at the center of the accretion disk and thus it would be reasonable to expect different properties for the X-ray emission. According to the interpretation of a heartbeat variability, we can speculate that the suppression of the thermal component during the states of high HR (occurring most of the times close to the minima of the flares - that should correspond also to phase 0.5 of the QPO) is due to the fact that when the disk is further away from the compact object the size of the hot spot on the neutron star surface decreases (see, e.g., Frank et al., 2002). If the displacement of the disk leads to a lower mass accretion rate, in the most simplistic accretion scenario we would expect the temperature of the thermal emission to decrease as well. Our findings in Fig. 10 suggest that the temperature has an opposite trend as function of the QPO phase, compared to what expected (i.e., an increase rather than a decrease around the QPO phase 0.5). However, we cannot exclude that in a more realistic accretion scenario the temperature responds in a less trivial way to changes in the inner boundary of the disk. If the thermal emission undergoes a strong Comptonization close to the NS surface, the plasma could be cooled less effectively above a smaller hotspot, thus inverting the trend of the temperature as a function of the QPO phase. Investigating this point in more details would require theoretical improvements to the spectral models, which are beyond the scope of this paper. Apart from the black-body temperature, the remaining results obtained from the QPO phase resolved spectral analysis match well with the overall heartbeat interpretation. We found a larger radius for the thermal component at the maximum of the QPO, accompanied by a significant change in the normalization (but not in the slope) of the Comptonization component.
The results obtained from the timing analysis presented in Sect. 4 are also compatible with the heartbeat interpretation. The analysis of the fractional pulsed amplitude time series confirmed that the intensity of the pulsed emission, related to the extension of the hot spot(s) on the NS surface, is also modulated at the same QPO frequency. This supports the idea that the hot spot changes shape on a compatible time scale. The measured time lags at the QPO frequency (Fig. 9) are nearly constant below 2 keV, where the QPO coherence and rms are high, and show a large negative shift above this energy. As these time lags are of the order of a few seconds and cannot be associated to any reasonable light travel time within a system as compact as a LMXB, it is likely that they are associated to geometrical effects due to changes in the region(s) where different emission components are produced.
We note that the outburst of 2015 is not the first one in which quasi-periodic timing variability of IGR J00291+5934 was pointed out. As discussed by Linares et al. (2007), the source displayed already during the outburst in 2004 a particularly rich variety of timing features in the 3–25 keV energy range (as observed by the RXTE/PCA). The properties of the source broad-band noise between the 2015 and 2004 outburst are qualitatively similar, although the component at 2.5 Hz was characterized by a significantly higher rms amplitude and the narrow component at 0.16 Hz was not detected. A number of QPO discovered in the RXTE data with frequencies comprised in the 10–100 mHz range led Linares et al. (2007) to conclude that IGR J00291+5934 was showing an X-ray variability much more reminiscent of that of a BHB rather than of a NS LMXB. Even though the frequencies of the previously reported QPOs are not too dissimilar from the feature at 8 mHz reported in the present paper, they could be very well detected in the higher energy bound covered by the PCA. This is at odds with our findings in Sect. 4, which proved that the QPO at 8 mHz reported here for the first time is a purely soft phenomenon and becomes undetectable at energies 2 keV. It seems thus correct to consider different origins for all these QPOs. Note that the RXTE/PCA does not cover the energy range where the XMM-Newton QPO was detected, and thus we cannot rule out that this feature was also present during the 2004 outburst. The much less significant feature we found at 16 mHz in the XMM-Newton power spectra extracted at energies above 2 keV and in the NuSTAR cross-spectrum could more closely resemble one of the features reported before by Linares et al. (2007). However, it is much less pronounced and in our case the statistics available in the hard spectral band is far too low to carry out a more complete comparison with the previous RXTE results.
In conclusion, we suggest that the X-ray variability and the associated mHz QPO discovered for the first time during the outburst of IGR J00291+5934 in 2015 are likely produced by an heartbeat-like mechanism. The possibility that this variability is associated with phases of quais-stable nuclear burning cannot either be excluded or more solidly tested, due to the paucity of type-I X-ray bursts observed from the source since its earliest detection in 1998.
Acknowledgements
We thank the anonymous referee and Phil Uttley for their precious suggestions. This work is based on observations obtained with XMM-Newton (OBSID 0744840201) and NuSTAR (OBSID 90101010002); the former is an ESA science mission with instruments and contributions directly funded by ESA Member States and the USA (NASA); the latter is a project led by the California Institute of Technology, managed by the Jet Propulsion Laboratory, and funded by the National Aeronautics and Space Administration. This research has made use of the NuSTAR Data Analysis Software (NuSTARDAS) jointly developed by the ASI Science Data Center (ASDC, Italy) and the California Institute of Technology (USA). We also exploited the ISIS functions provided by ECAP/Remeis observatory and MIT (http://www.sternwarte.uni-erlangen.de/isis/).
References
- Altamirano & Strohmayer (2012) Altamirano D., Strohmayer T., 2012, ApJ, 754, L23
- Altamirano et al. (2008) Altamirano D., van der Klis M., Wijnands R., Cumming A., 2008, ApJ, 673, L35
- Altamirano et al. (2011) Altamirano D., et al., 2011, ApJ, 742, L17
- Bachetti et al. (2015) Bachetti M., et al., 2015, ApJ, 800, 109
- Belloni et al. (2000) Belloni T., Klein-Wolt M., Méndez M., van der Klis M., van Paradijs J., 2000, A&A, 355, 271
- Bordas et al. (2010) Bordas P., et al., 2010, The Astronomer’s Telegram, 2919
- Bult & van der Klis (2014) Bult P., van der Klis M., 2014, ApJ, 789, 99
- Capitanio et al. (2012) Capitanio F., Del Santo M., Bozzo E., Ferrigno C., De Cesare G., Paizis A., 2012, MNRAS, 422, 3130
- D’Angelo (2014) D’Angelo C., 2014, in European Physical Journal Web of Conferences. p. 01003, doi:10.1051/epjconf/20136401003
- De Falco et al. (2016) De Falco V., Kuiper L., Bozzo E., Galloway D. K., Poutanen J., Ferrigno C., Stella L., Falanga M., 2016, preprint, (arXiv:1611.08218)
- Done et al. (2004) Done C., Wardziński G., Gierliński M., 2004, MNRAS, 349, 393
- Falanga & Titarchuk (2007) Falanga M., Titarchuk L., 2007, ApJ, 661, 1084
- Falanga et al. (2005) Falanga M., et al., 2005, A&A, 444, 15
- Ferrigno et al. (2014) Ferrigno C., et al., 2014, A&A, 567, A77
- Frank et al. (2002) Frank J., King A., Raine D. J., 2002, Accretion Power in Astrophysics: Third Edition
- Hartman et al. (2011) Hartman J. M., Galloway D. K., Chakrabarty D., 2011, ApJ, 726, 26
- Heger et al. (2007) Heger A., Cumming A., Woosley S. E., 2007, ApJ, 665, 1311
- Homan (2012) Homan J., 2012, ApJ, 760, L30
- Houck & Denicola (2000) Houck J. C., Denicola L. A., 2000, in Manset N., Veillet C., Crabtree D., eds, Astronomical Society of the Pacific Conference Series Vol. 216, Astronomical Data Analysis Software and Systems IX. p. 591
- Ingram & van der Klis (2015) Ingram A., van der Klis M., 2015, MNRAS, 446, 3516
- Ingram et al. (2016) Ingram A., van der Klis M., Middleton M., Done C., Altamirano D., Heil L., Uttley P., Axelsson M., 2016, MNRAS, 461, 1967
- Lewis et al. (2010) Lewis F., et al., 2010, A&A, 517, A72
- Linares et al. (2007) Linares M., van der Klis M., Wijnands R., 2007, ApJ, 660, 595
- Linares et al. (2012) Linares M., Altamirano D., Chakrabarty D., Cumming A., Keek L., 2012, ApJ, 748, 82
- Lyu et al. (2015) Lyu M., Méndez M., Zhang G., Keek L., 2015, MNRAS, 454, 541
- Lyu et al. (2016) Lyu M., Méndez M., Altamirano D., Zhang G., 2016, MNRAS, 463, 2358
- Markwardt et al. (2004) Markwardt C. B., Swank J. H., Strohmayer T. E., 2004, The Astronomer’s Telegram, 353
- Mineo et al. (2012) Mineo T., et al., 2012, A&A, 537, A18
- Neilsen et al. (2011) Neilsen J., Remillard R. A., Lee J. C., 2011, ApJ, 737, 69
- Pasham et al. (2013) Pasham D. R., Strohmayer T. E., Mushotzky R. F., 2013, ApJ, 771, L44
- Patruno (2010) Patruno A., 2010, ApJ, 722, 909
- Patruno & D’Angelo (2013) Patruno A., D’Angelo C., 2013, ApJ, 771, 94
- Patruno & Watts (2012) Patruno A., Watts A. L., 2012, preprint, (arXiv:1206.2727)
- Patruno et al. (2009) Patruno A., Watts A., Klein Wolt M., Wijnands R., van der Klis M., 2009, ApJ, 707, 1296
- Patruno et al. (2010) Patruno A., et al., 2010, The Astronomer’s Telegram, 2672
- Remillard (2004) Remillard R., 2004, The Astronomer’s Telegram, 357
- Revnivtsev et al. (2001) Revnivtsev M., Churazov E., Gilfanov M., Sunyaev R., 2001, A&A, 372, 138
- Romanova et al. (2004) Romanova M. M., Ustyugova G. V., Koldoba A. V., Lovelace R. V. E., 2004. pp L151–L154 (arXiv:astro-ph/0502266), doi:10.1086/426586
- Sanna et al. (2015) Sanna A., et al., 2015, The Astronomer’s Telegram, 7836
- Torres et al. (2008) Torres M. A. P., Jonker P. G., Bassa C., Nelemans G., Steeghs D., 2008, The Astronomer’s Telegram, 1665
- Uttley et al. (2014) Uttley P., Cackett E. M., Fabian A. C., Kara E., Wilkins D. R., 2014, The Astronomy and Astrophysics Review, 22, 72
- Vaughan & Nowak (1997) Vaughan B. A., Nowak M. A., 1997, ApJ, 474, L43
- Wang (2016) Wang J., 2016, International Journal of Astronomy and Astrophysics, 6, 82