Rapid Radio Flaring during an Anomalous Outburst of SS Cyg
Abstract
The connection between accretion and jet production in accreting white dwarf binary systems, especially dwarf novae, is not well understood. Radio wavelengths provide key insights into the mechanisms responsible for accelerating electrons, including jets and outflows. Here we present densely-sampled radio coverage, obtained with the Arcminute MicroKelvin Imager Large Array, of the dwarf nova SS Cyg during its February 2016 anomalous outburst. The outburst displayed a slower rise (3 days mag-1) in the optical than typical ones, and lasted for more than 3 weeks. Rapid radio flaring on timescales 1 hour was seen throughout the outburst. The most intriguing behavior in the radio was towards the end of the outburst where a fast, luminous (“giant”), flare peaking at 20 mJy and lasting for 15 minutes was observed. This is the first time that such a flare has been observed in SS Cyg, and insufficient coverage could explain its non-detection in previous outbursts. These data, together with past radio observations, are consistent with synchrotron emission from plasma ejection events as being the origin of the radio flares. However, the production of the giant flare during the declining accretion rate phase remains unexplained within the standard accretion-jet framework and appears to be markedly different to similar patterns of behavior in X-ray binaries.
keywords:
radio continuum: stars — X-rays: stars — stars: dwarf novae1 Introduction
Dwarf novae (DNe) are binary systems containing a non-magnetic ( G) white dwarf actively accreting from a Roche lobe-filling main-sequence companion via an accretion disk (Warner, 1995). All known DNe undergo episodic outbursts, which last between a few days and a few years, recur between 10 days and several decades, and result in brightening by 2–8 magnitudes in the optical (e.g. Coppejans et al., 2016a). The disk instability model, in which the accretion disk cycles between cool quiescent states and hot outburst states, provides a consistent framework for explaining these outbursts (e.g. Osaki, 1974; Meyer & Meyer-Hofmeister, 1981; Lasota, 2001). DN outbursts seem to be analogous to X-ray binary (XRB) outbursts (e.g. Kuulkers, Howell & van Paradijs, 1996), and the similarities between their hardness-intensity diagrams (disk-fraction luminosity diagram, or DFLD, in the case of DNe) together with the presence of transient radio emission suggests that the connection between the outburst phase and the radio (jet) emission could be similar as well (Körding et al., 2008).
While some classes of accreting white dwarf systems, such as symbiotic stars, and magnetic cataclysmic variables, were detected in the radio111Radio emission is also expected from supersoft X-ray sources, which show evidence for jets through pairs of Doppler shifted emission lines., DNe were, until recently, thought to be weak radio emitters (e.g. Soker & Lasota, 2004). Even for the few DNe that were detected in the radio during outbursts, the detection was not reproducible (e.g. Benz, Fuerst & Kiplinger, 1983; Benz, Güdel & Mattei, 1996). Coppejans et al. (2015) and Coppejans et al. (2016b) showed that many of the non-magnetic accreting white dwarf systems are faint (0.1 mJy) and variable on hours timescales in the radio, and that the sensitivities, time-resolutions or timing of previous observations were insufficient to detect these fainter systems. DNe have now been shown to be repeating radio emitters during outbursts (Coppejans et al., 2016b; Russell et al., 2016). The brightness temperature from VLBI imaging, the outburst track in the DFLD, the radio spectral indices, and the shape of the radio light curves have been used to argue in support of synchrotron emission from a transient jet as the cause of the radio emission during DNe outbursts (Körding et al., 2008; Russell et al., 2016; Coppejans et al., 2016b).
The quintessential DN, SS Cyg, is one of the best studied systems of its class across the electromagnetic spectrum. This system consists of a 1 M⊙white dwarf with a K5V companion, with the inclination of the binary being close to 45o(North et al., 2002; Körding et al., 2008). The precise VLBI parallax distance measurement222The Gaia distance is pc (Gaia Collaboration, 2016). of pc (Miller-Jones et al., 2013) allows the study of the energetics of this system at a level of precision impossible to achieve for most accreting systems. Long-term optical monitoring of SS Cyg has revealed regular outbursts lasting 5–20 days and recurring on timescales between 20–60 days (Cannizzo & Mattei, 1992). The majority of the outbursts have rise and decay rates (in the optical) that are remarkably similar from one outburst to another, and scattered around 0.5 days mag-1 and 2.5 days mag-1 respectively. About 10% of the outbursts, referred to as “anomalous”, exhibit a slow rise of 1.5 days mag-1 in the optical (Cannizzo & Mattei, 1998). X-ray and ultraviolet observations suggest that accretion in SS Cyg (and similarly in other dwarf novae) occurs via a “boundary region” between the inner accretion disk and the surface of the white dwarf. The boundary region becomes optically thick at X-ray frequencies at the onset of an outburst and may play a role in jet production in SS Cyg (Wheatley et al., 2003; Russell et al., 2016). Analogous to XRBs, SS Cyg is expected to have a steady jet during the rise phase of an outburst and discrete plasma ejection after the subsequent spectral softening (Körding et al., 2008; Miller-Jones et al., 2011).
In February 2016, SS Cyg underwent an anomalous outburst, which lasted for about 3 weeks (at V11 mag). The outburst showed a slow rise of about 3 days mag-1 in the optical for one week and then transformed into a standard broad outburst before reaching the peak. Here, we report on high-cadence radio observations of this anomalous outburst of SS Cyg. In §2 we describe the optical, radio and X-ray observations, and present our analysis and discussion in §3.
2 Observations and Data Processing
2.1 Optical
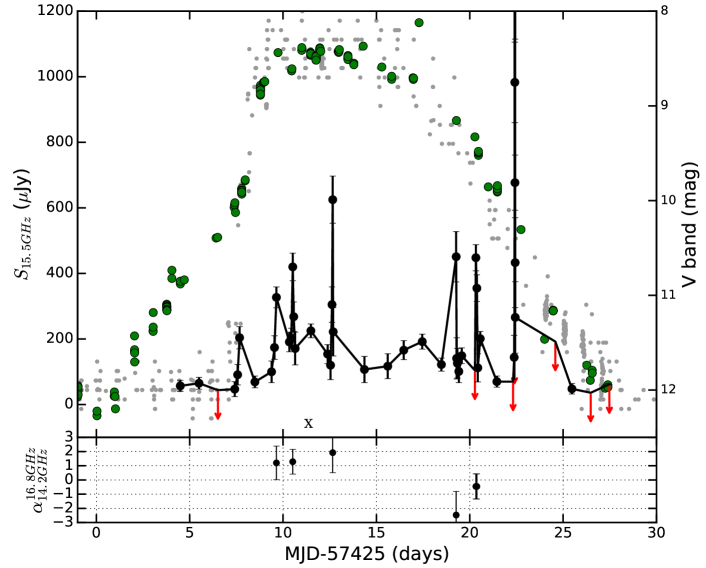
We requested close monitoring of SS Cyg and immediate submission of observations to the American Association of Variable Star Observers (AAVSO; Special Notice #412, Alert Notice 536) in order to catch the rise phase of the outburst and obtain a well-sampled optical light curve. Good sampling at the beginning of the outburst was necessary for triggering the radio observations (see below). The data were downloaded from the AAVSO website333https://www.aavso.org/data-download. We used the V band magnitudes for our analysis. The optical light curve is shown in Figure 1.
2.2 Radio
We monitored the AAVSO light curve, and once the optical light curve reached 11.5 mag in the pre-validated V band (on 2016 Feb 11), we triggered the Arcminute MicroKelvin Imager Large Array (AMI-LA; Zwart et al., 2008) radio telescope. Observations were made with the new digital correlator having 4096 channels across a 5 GHz bandwidth between 13–18 GHz. SS Cyg was monitored for about 10 hours every day throughout the 3 weeks of outburst. The phase calibrator, J2153+4322, was observed every 12 minutes for about 1.5 minutes. The log of AMI-LA observations is given in Table 1.
The AMI-LA data were binned to 80.625 GHz channels and processed (RFI excision and calibration) with a fully-automated pipeline, AMI-REDUCE (e.g. Davies et al., 2009; Perrott et al., 2013). Daily measurements of 3C48 and 3C286 were used for the absolute flux calibration, which is good to about 10%. The calibrated amplitudes for J2153+4322 showed variability of 20% (peak-to-peak) around the mean of 250 mJy at 15.5 GHz within each 10-hour observing block. This variability in the complex gain calibrator is likely a combination of unmodeled gain variations and pointing errors444We note, however, that significant work has gone into improving the AMI-LA amplitude gain calibration and empirical pointing model.. Hence we recalibrated the data using fixed values for the flux density ( mJy) and spectral index (; ) of J2153+4322, which are our best estimates based on our knowledge of the instrument and the data. Conservative uncertainties in these estimates are 5% (flux density) and 0.1 (spectral index), and hence we conclude that the error in flux density is dominated by the absolute flux scale uncertainty. While there are no published 15 GHz flux density measurements for J2153+4322, the flux density and the spectral index that we have used are consistent with its 8.4 GHz flux densities measured in 2011555280 mJy from http://astrogeo.org/v2m/maps/bc196zc/ and Russell et al. (2016), for example.
The calibrated and RFI-flagged data were then imported into CASA. Since the AMI-LA synthesized beam is approximately 30″, the 1 mJy radio source 22.3″ to the North-West of SS Cyg causes confusion and had to be subtracted from the UV plane. We used the interactive mode of CASA clean to define a restricted clean box at the coordinates of the confusing source (the clean box does not overlap with the location of SS Cyg) and derived a model for each AMI-LA observation. We then loaded and subtracted the model from the CASA measurement sets using the tasks ft and uvsub. We then split each 10-hour observation into shorter intervals as needed, according to the variability seen in the source, and imaged each interval using CASA clean. The flux density of SS Cyg was measured in the resulting 512512 pix2 (4″pix-1) images using the pyfits module.
2.3 X-ray
A 1 ks Swift XRT observation666Some of the requested XRT observations were interrupted by GRB observations. was carried out on 2016 Feb 18.136 (start time; MJD 57436.136). In 971.7 s of data, we detect a count rate of 1.8870.049 per second in the 0.3–10 keV band. The X-ray observation was not strictly simultaneous with any optical or radio observations.
A multi-temperature plasma emission model is often used to describe the X-ray spectra of dwarf novae, in which the boundary layer is heated to 108 K during outburst (e.g. Wheatley et al., 2003; Pandel et al., 2005). Accordingly, we fit a cemekl model (the emission measures in this model follow a power law in temperature up to a certain maximum; Done & Osborne, 1997) to the binned XRT spectrum using XSpec and obtained a maximum temperature of keV. In the 0.5–10 keV, 1–10 keV, and 2–10 keV bands, this model has a flux of 6.5, 5.5, and 4.3 () erg s-1 cm-2 respectively. At a distance of 114 pc, we get a luminosity of erg s-1 in the 1–10 keV band.
3 Results & Discussion
Our AMI-LA observations of SS Cyg during the February 2016 anomalous outburst represent the most densely-sampled radio coverage of any dwarf nova thus far. The radio light curve at 15.5 GHz is shown in Figure 1 along with the optical light curve. Our radio coverage began as soon as the optical light curve reached mag. (on 11 February 2016), and we find evidence for radio emission from SS Cyg right from our first observation, at a 15.5 GHz flux density of 5717 Jy. Our previous AMI-LA observation from 02 February gave a non-detection, with a 2 upper limit777Although the convention is to quote 3 upper limits, the known coordinates of SS Cyg together with our knowledge of the noise properties and the manual inspection of radio images allow us to confidently place the detection threshold at 2. 1 spurious detection is expected at this level. of 86 Jy. We do not detect any significant intra-day and inter-day variability in the observations carried out between 11–13 February (MJD 57429–57431).
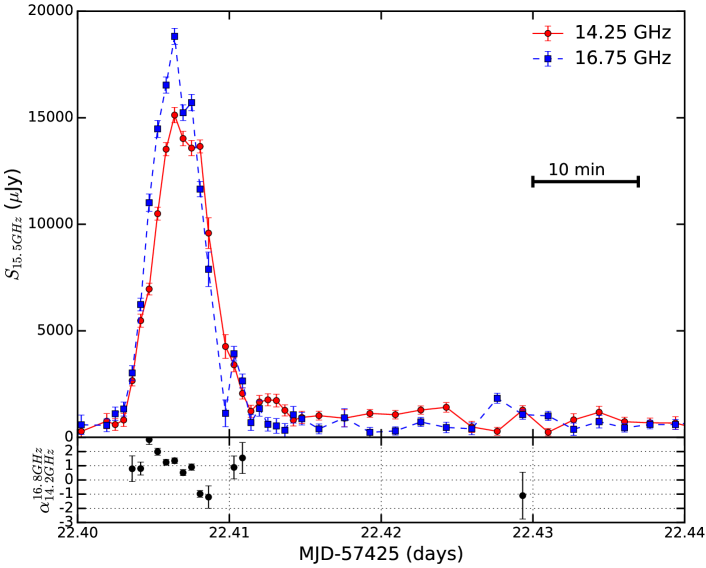
We detected significant variability on hour timescales starting on 14 February. A comparison with a “normal” optical outburst (grey points in Figure 1) suggests that the flaring started when the normal optical outburst would have been expected to begin. Further observations are necessary to verify whether this is indeed the case during a normal optical outburst. The first flare occurred towards the end of our AMI-LA observation carried out on 14 February (MJD 57432.6726), at a peak flux density of Jy at 15.5 GHz. Subsequently, a series of rapid flares, with rise times between 5–30 minutes were seen throughout the outburst. While the majority of the radio flares peaked at sub-mJy flux densities, we detected a very luminous flare towards the end of the outburst, peaking at mJy at 15.5 GHz and lasting for only 15 minutes. The radio light curves at 14.25 GHz and 16.75 GHz888Our flux density values at 15.5 GHz are the mean over the whole 13–18 GHz band, while the 14.25 GHz and 16.75 GHz measurements are means over the 13–15.5 GHz and 15.5–18 GHz bands. for this fast luminous flare (“giant” flare) are shown in Figure 2. There is some evidence of radio brightening of SS Cyg towards the end of the April 2007 and April 2016 outbursts as well (Körding et al. in prep, Miller-Jones et al. in prep), which may suggest the presence of such a giant flare is a common feature of outbursts in SS Cyg. If so, then such a flare could have been missed in the majority of the past radio observations (those reported by Russell et al., 2016) due to their much sparser time coverage. Overall, during the outburst, the radio emission lasted for 3 weeks (11 February to 02 March 2016, i.e. MJD 57432–57449; above our 2 detection threshold of 40 Jy).
The initial radio flares, seen over a span of 1 week (between MJD 57432 and 57439), had rise times of tens of minutes and at peak they had an optically thick spectrum at 15.5 GHz. Each successive flare was seen to have a peak flux density higher than the previous one. If this flaring activity is related to plasma ejection events, then the optically thick spectrum (with ) suggests that the particle acceleration time is shorter than the expansion timescale of the ejected blobs. This initial set of flares, which continued into the peak/flattening of the optical light curve, was followed by a few days where the radio emission was fairly steady or rising gradually. The 15.5 GHz flux density was between 100–200 Jy during this phase. This steady period may be related to the “plateau” phase seen during past radio observations of SS Cyg (e.g. Körding et al., 2008; Russell et al., 2016), although the coverage of these previous observations was very sparse. Between MJD 57443 and 57446, the flaring activity resumed and during this period the overall spectrum at the flare peak was optically thinner than the earlier flares. In general, the flare peaks are short lived and hard to define, but probably represent optically thick to thin transition999Our default assumption, based on previous work (e.g. Russell et al., 2016), is that this is synchrotron emission, but we discuss the possibility of coherent emission in the context of the giant flare below.. The multiple radio flares seen throughout the outburst are unlikely to be caused by the source crossing the “jet line” multiple times, given the evolution in the DFLD (Körding et al., 2008), and may be either due to internal shocks, external shocks, or multiple discrete ejections not tied to any specific jet line.
In the first two hours of the AMI-LA observation on 29 February (MJD 57447.31), SS Cyg was at or below 150 Jy. On MJD 57447.4 we detected the onset of the giant flare (Figure 2). After a gradual increase in flux density to 1.5 mJy, the giant flare reached its peak in 5 minutes (e-folding timescale of 1.5 minutes). The implied variability brightness temperature is K, which is comparable to or even greater than that seen in flares from magnetic CVs. This value can also be compared with the lower limits to the brightness temperature placed from VLBA observations, K, and previously observed radio variability, K (Russell et al., 2016). The of the giant flare and other radio flares detected during the outburst is consistent either with a synchrotron origin of the flares, as noted by previous works (Körding et al., 2008; Russell et al., 2016), or with a coherent source of emission. Recently, 100% circularly polarized radio flares were detected in nova-like cataclysmic variables (Coppejans et al., 2015), indicating coherent emission. We can neither confirm nor rule out the coherent mechanism hypothesis through our radio observations since the AMI-LA does not provide any polarization information. The time resolution and sensitivity of the AMI-LA data are sufficient to (temporally) resolve the giant flare and get reliable spectral indices. During the rise phase of the giant flare, the spectral index () is (MJD 57447.4042; mJy), which increases to (MJD 57447.4047; mJy), consistent with a fully self-absorbed synchrotron source. Beyond this maximum in the spectral index, the spectrum between 13–18 GHz evolves towards becoming optically thin. At the peak of the giant flare (MJD 57447.4064, mJy), the spectral index is , and then decreases to a minimum of (MJD 57447.4081; mJy) during the decay of the flare. At MJD 57447.4103, another mJy-level flare, optically thin and peaking at mJy at 16.75 GHz, is detected and may have a delayed, less-luminous, counterpart at 14.25 GHz at 57447.4125 (see Figure 2). Overall, the behavior of the radio emission at frequencies between 14.25 GHz and 16.75 GHz is consistent with the adiabatic expansion of a synchrotron-emitting plasma blob (van der Laan, 1966).
The question of why there was a giant radio flare towards the end of the outburst warrants some consideration. According to the disk instability model101010Although the DIM cannot explain anomalous outbursts very well (Schreiber et al., 2003), the large flares occurs well after the slow-rise phase, once the outburst has apparently transitioned into a normal outburst., the material accreted from the companion star gradually builds up in the accretion disk until the temperature increases to the critical point to drive the hydrogen ionization instability, thereby transporting the accretion disk material rapidly onto the surface of the white dwarf. During outburst, the X-ray emission rises at a similar time as the optical, and this is attributed to the material reaching the boundary layer. The boundary layer becomes optically thick and quenches the X-ray radiation while the extreme UV radiation rises rapidly (Wheatley et al., 2003). Residual X-ray emission persists through the outburst phase. Our X-ray observation was carried out soon after the optical light curve reached peak (MJD 57436.14). The 1–10 keV luminosity, erg s-1, is in agreement with past observations during this phase of the outburst. At the end of the optical and ultraviolet decay phases, the X-ray emission rises gradually, and later fades back to quiescent levels (Wheatley et al., 2003; Russell et al., 2016). During the phase when the optical and UV emission are declining, the accretion rate is expected to drop substantially. Hence the “giant” flare, seen towards the end of the outburst, is intriguing. If the giant flare is due to the ejection of plasma blob(s), then the large amplitude of the radio flare during this decay phase remains unexplained. A comparison between our observations and a normal optical outburst suggests that the giant flare occurs either slightly before or right at the start of the X-ray increase at the end of the outburst (see, e.g. Wheatley et al., 2003; Russell et al., 2016), 2–3 days before the peak of the X-ray emission. This suggests that the giant flare is not driven by the large change in the optical depth of the boundary layer. Although the magnetic field of the white dwarf in SS Cyg is not high, it is possible that something like the propeller effect or magnetic reconnection takes over as the accretion rate is falling and generates an outflow of gas (e.g. in cases of AE Aqr and VW Hyi; Wynn, King & Horne, 1997; Warner & Woudt, 2002; Meintjes & de Jager, 2000), and hence a luminous flare in the radio. Since the isotropic 15.5 GHz luminosity at the peak of the giant flare (and ) is erg s-1, this flare may be consistent with the LR to LX relationship (using an estimate of the X-ray luminosity from Wheatley et al., 2003) seen for black hole systems (see figure 9 of Russell et al., 2016), albeit for a very short period of time.
Lastly, we would like to highlight the importance of densely-sampled radio coverage, without which the rapid flares and the giant radio flare (which had a duration of 15 minutes) towards the end of SS Cyg’s outburst would have remained unknown. The 200 hours of observing presented here may not be feasible with telescopes like the SKA or its pathfinders, and this underscores the need for interferometers like the AMI-LA to be operational in the era of large telescopes. Niche areas of astronomy will continue to be accessible only with such small radio interferometers.
Acknowledgements: KPM’s research is supported by the Oxford Centre for Astrophysical Surveys which is funded through the Hintze Family Charitable Foundation. JCAMJ is the recipient of an Australian Research Council Future Fellowship (FT140101082). RPF acknowledges support from the European Research Council Advanced Grant 267697 ”4 Pi Sky: Extreme Astrophysics with Revolutionary Radio Telescopes”. TDR acknowledges support from the Netherlands Organisation for Scientific Research (NWO) Veni Fellowship, grant number 639.041.646. AMS gratefully acknowledges support from the European Research Council under grant ERC-2012- StG-307215 LODESTONE. The AMI telescope is supported by the European Research Council under grant ERC-2012- StG-307215 LODESTONE, the UK Science and Technology Facilities Council (STFC) and the University of Cambridge. We extend special thanks to Stella Kafka for coordinating the optical observations on behalf of AAVSO, and to all the diligent AAVSO observers who contributed to the optical light curve. We thank the AMI and Swift staff for scheduling the radio and X-ray observations. We also thank the anonymous referee for provinding useful comments.
References
- Benz, Fuerst & Kiplinger (1983) Benz A. O., Fuerst E., Kiplinger A. L., 1983, Nature, 302, 45
- Benz, Güdel & Mattei (1996) Benz, A. O., Güdel, M. & Mattei, J. A. 1996, ASP Conference Series, 93, 188
- Cannizzo & Mattei (1992) Cannizzo, J. K. & Mattei, J. A. 1992, ApJ, 401, 642
- Cannizzo & Mattei (1998) Cannizzo, J. K. & Mattei, J. A. 1998, ApJ, 505, 344
- Coppejans et al. (2015) Coppejans, D. L., Körding, E. G., Miller-Jones, J. C. A., Rupen, M. P., Knigge, C., et al. 2015, MNRAS, 451, 3801
- Coppejans et al. (2016a) Coppejans, D. L., Körding, E. G., Knigge, C., Pretorius, M. L., Woudt, P. A., Groot, P. J., Van Eck, C. L. & Drake, A. J., 2016, MNRAS, 456, 4441
- Coppejans et al. (2016b) Coppejans, D. L., Körding, E. G., Miller-Jones, J. C. A., Rupen, M. P., Sivakoff, G. R., Knigge, C., Groot, P. J., Woudt, P. A., Waagen, E. O. & Templeton, M. 2016, MNRAS, 463, 2229
- Davies et al. (2009) Davies, M. L. et al. 2009, MNRAS 400, 984
- Done & Osborne (1997) Done, C. & Osborne, J. P., 1997, MNRAS, 288, 649
- Gaia Collaboration (2016) Gaia Collaboration, A. G. A. Brown, A. Vallenari, T. Prusti, J. H. J. de Bruijne, F. Mignard et al. 2016, A&A, in press
- Körding et al. (2008) Körding, E., Rupen, M., Knigge, C., Fender, R., Dhawan, V., Templeton, M., & Muxlow, T. 2008, Science, 320, 1318
- Kuulkers, Howell & van Paradijs (1996) Kuulkers, E., Howell, S. B., van Paradijs, J. 1996, ApJ, 462, 87
- Lasota (2001) Lasota, J.-P. 2001, NAR, 45, 449
- Meintjes & de Jager (2000) Meintjes, P. J. & de Jager, O. C. 2000, MNRAS, 311, 611
- Meyer & Meyer-Hofmeister (1981) Meyer, F. & Meyer-Hofmeister, E. 1981, A&A, 104, 10
- Miller-Jones et al. (2011) Miller-Jones, J. C. A., et al. 2011, in IAU Symposium, Vol. 275, ed. G. E. Romero, R. A. Sunyaev, & T. Belloni, 224
- Miller-Jones et al. (2013) Miller-Jones, J. C. A., Sivakoff, G. R., Knigge, C., Körding, E. G., Templeton, M. & Waagen, E. O. 2013, Science, 340, 950
- North et al. (2002) North, R. C., Marsh, T. R., Kolb, U., Dhillon, V. S., Moran, C. K. J. 2002, MNRAS, 337, 1215
- Osaki (1974) Osaki, Y. 1974, PASJ, 26, 429
- Pandel et al. (2005) Pandel, D., Cordova, F. A., Mason, K. O. & Priedhorsky, W. C. 2005, ApJ, 626, 396
- Perrott et al. (2013) Perrott, Y. C., Scaife, A. M. M., Green, D. A., Davies, M. L., Franzen, T. M. O. et al. 2013, MNRAS, 429, 3330
- Russell et al. (2016) Russell, T. D., Miller-Jones, J. C. A., Sivakoff, G. R., Altamirano, D., O’Brien, T. J., et al. 2016, MNRAS, 460, 3720
- Schreiber et al. (2003) Schreiber, M. R., Hameury, J. M., & Lasota, J. P. 2003, A&A, 410, 239
- Soker & Lasota (2004) Soker, N., & Lasota, J. P. 2004, A&A, 422, 1039
- van der Laan (1966) van der Laan, H. 1966, Nature, 211, 1131
- Wheatley et al. (2003) Wheatley, P. J., Mauche, C. W., & Mattei, J. A. 2003, MNRAS, 345, 49
- Warner (1995) Warner, B. 1995, Cambridge Astrophysics Series, 28
- Warner & Woudt (2002) Warner, B. & Woudt, P. 2002, MNRAS, 335, 84
- Wynn, King & Horne (1997) Wynn, G., King, A. & Horne, K. 1997, MNRAS, 286, 436
- Zwart et al. (2008) Zwart, J. T. L., Barker, R. W., Biddulph, P., Bly, D., Boysen, R. C. et al. 2008, MNRAS, 391, 1545
| MJD | Dur. | ||||
| (min) | (Jy) | (Jy) | |||
| 57420.5991 | 117 | 81 | 43 | … | … |
| 57429.4993 | 598 | 57 | 17 | … | … |
| 57430.5007 | 598 | 65 | 18 | … | … |
| 57431.5124 | 596 | 41 | 22 | … | … |
| 57432.4136 | 298 | 47 | 23 | … | … |
| 57432.5690 | 149 | 90 | 31 | … | … |
| 57432.6726 | 149 | 204 | 34 | … | … |
| 57433.4925 | 598 | 69 | 18 | … | … |
| 57434.3865 | 299 | 100 | 33 | … | … |
| 57434.5423 | 149 | 174 | 36 | … | … |
| 57434.6462 | 149 | 327 | 32 | 1.2 | 1.2 |
| 57435.3398 | 149 | 191 | 30 | … | … |
| 57435.4434 | 149 | 203 | 30 | … | … |
| 57435.5210 | 74 | 420 | 42 | 1.3 | 0.9 |
| 57435.5728 | 74 | 268 | 45 | … | … |
| 57435.6505 | 149 | 171 | 50 | … | … |
| 57436.4919 | 596 | 225 | 21 | … | … |
| 57437.3896 | 298 | 154 | 29 | … | … |
| 57437.5449 | 149 | 120 | 44 | … | … |
| 57437.6226 | 74 | 305 | 54 | … | … |
| 57437.6615 | 37 | 625 | 72 | 1.9 | 1.4 |
| 57437.6874 | 37 | 222 | 74 | … | … |
| 57439.3601 | 239 | 107 | 40 | … | … |
| 57440.6077 | 317 | 117 | 38 | … | … |
| 57441.4665 | 598 | 166 | 29 | … | … |
| 57442.4577 | 580 | 192 | 23 | … | … |
| 57443.4824 | 596 | 122 | 20 | … | … |
| 57444.2729 | 37 | 451 | 77 | -2.5 | 1.7 |
| 57444.2988 | 37 | 141 | 63 | … | … |
| 57444.3376 | 74 | 126 | 45 | … | … |
| 57444.4153 | 149 | 101 | 34 | … | … |
| 57444.5707 | 298 | 149 | 24 | … | … |
| 57445.2764 | 74 | 89 | 52 | … | … |
| 57445.3284 | 74 | 448 | 40 | -0.5 | 0.9 |
| 57445.3803 | 74 | 355 | 41 | -0.5 | 0.9 |
| 57445.4323 | 74 | 112 | 43 | … | … |
| 57445.5621 | 299 | 201 | 22 | … | … |
| 57446.4529 | 598 | 70 | 17 | … | … |
| 57447.3196 | 137 | 47 | 35 | … | … |
| 57447.3793 | 34 | 147 | 67 | … | … |
| 57447.3972 | 17 | 88 | 76 | … | … |
| 57447.4046 | 4 | 9254 | 175 | … | … |
| 57447.4076 | 4 | 15845 | 184 | … | … |
| 57447.4106 | 4 | 2843 | 149 | … | … |
| 57447.4136 | 4 | 983 | 123 | … | … |
| 57447.4210 | 17 | 677 | 84 | … | … |
| 57447.4285 | 4 | 1239 | 124 | … | … |
| 57447.4315 | 4 | 433 | 137 | … | … |
| 57447.4359 | 8 | 249 | 109 | … | … |
| 57449.5854 | 266 | 91 | 96 | … | … |
| 57450.4727 | 595 | 52 | 16 | … | … |
| 57451.4792 | 536 | 2 | 18 | … | … |
| 57452.4772 | 596 | 10 | 31 | … | |
| Notes: a) is the peak pixel values at the location of SS Cyg. Flux density values that are 2 are to be considered as non-detections. b) is the RMS noise. c) The spectral index values have large uncertainties except in the cases of flare peaks, and only those values are noted here. | |||||
| MJD | Dur. | ||||
| (min) | (Jy) | (Jy) | |||
| 57447.39745 | 0.8 | 547 | 290 | … | … |
| 57447.39800 | 0.8 | 312 | 291 | … | … |
| 57447.39856 | 0.8 | 252 | 281 | … | … |
| 57447.39912 | 0.8 | 531 | 295 | … | … |
| 57447.39968 | 0.8 | 285 | 280 | … | … |
| 57447.40024 | 0.8 | 450 | 392 | … | … |
| 57447.40192 | 0.8 | 703 | 361 | … | … |
| 57447.40248 | 0.8 | 1792 | 315 | … | … |
| 57447.40304 | 0.8 | 2010 | 346 | … | … |
| 57447.40359 | 0.8 | 4090 | 335 | 0.8 | 0.9 |
| 57447.40415 | 0.8 | 6860 | 326 | 0.8 | 0.5 |
| 57447.40471 | 0.8 | 10533 | 393 | 2.8 | 0.3 |
| 57447.40527 | 0.8 | 13288 | 368 | 2.0 | 0.2 |
| 57447.40583 | 0.8 | 15963 | 397 | 1.2 | 0.2 |
| 57447.40639 | 0.8 | 18081 | 419 | 1.4 | 0.2 |
| 57447.40695 | 0.8 | 16563 | 378 | 0.5 | 0.2 |
| 57447.40751 | 0.8 | 16816 | 404 | 0.9 | 0.2 |
| 57447.40807 | 0.8 | 13745 | 355 | -1.0 | 0.2 |
| 57447.40862 | 0.8 | 12180 | 869 | -1.2 | 0.8 |
| 57447.40974 | 0.8 | 3272 | 581 | … | … |
| 57447.41030 | 0.8 | 4674 | 327 | 0.9 | 0.8 |
| 57447.41086 | 0.8 | 3462 | 300 | 1.5 | 1.1 |
| 57447.41142 | 0.8 | 1859 | 335 | … | … |
| 57447.41198 | 0.8 | 2085 | 344 | … | … |
| 57447.41254 | 0.8 | 1719 | 306 | … | … |
| 57447.41310 | 0.8 | 1699 | 326 | … | … |
| 57447.41366 | 0.8 | 1220 | 279 | … | … |
| 57447.41421 | 0.8 | 1355 | 327 | … | … |
| 57447.41477 | 0.8 | 1337 | 292 | … | … |
| 57447.41590 | 2.4 | 1117 | 199 | … | … |
| 57447.41758 | 2.4 | 1399 | 347 | … | … |
| 57447.41926 | 2.4 | 677 | 176 | … | … |
| 57447.42094 | 2.4 | 806 | 167 | … | … |
| 57447.42261 | 2.4 | 1225 | 180 | … | … |
| 57447.42429 | 2.4 | 1170 | 205 | … | … |
| 57447.42597 | 2.4 | 544 | 252 | … | … |
| 57447.42765 | 2.4 | 1409 | 187 | … | … |
| 57447.42932 | 2.4 | 1155 | 197 | -0.9 | 1.7 |
| 57447.43100 | 2.4 | 1079 | 188 | … | … |
| 57447.43268 | 2.4 | 763 | 258 | … | … |
| 57447.43436 | 2.4 | 1201 | 253 | … | … |
| 57447.43604 | 2.4 | 645 | 188 | … | … |
| 57447.43772 | 2.4 | 614 | 202 | … | … |
| 57447.43939 | 2.4 | 1154 | 229 | … | … |
| 57447.44107 | 2.4 | 275 | 373 | … | … |
| 57447.44275 | 2.4 | 558 | 260 | … | … |
| 57447.44443 | 2.4 | 457 | 214 | … | … |
| 57447.44611 | 2.4 | 400 | 195 | … | … |
| 57447.44778 | 2.4 | 352 | 212 | … | … |
| 57447.44946 | 2.4 | 195 | 468 | … | … |
| 57447.45114 | 2.4 | 425 | 175 | … | … |
| 57447.45282 | 2.4 | 384 | 192 | … | … |
| 57447.45450 | 2.4 | 757 | 201 | … | … |
| 57447.45617 | 2.4 | 333 | 178 | … | … |
| 57447.45785 | 2.4 | 770 | 520 | … | … |
| 57447.45953 | 2.4 | 142 | 184 | … | … |
| 57447.46121 | 2.4 | 420 | 210 | … | … |
| 57447.46289 | 2.4 | 25 | 173 | … | … |
| 57447.46456 | 2.4 | 420 | 192 | … | … |
| 57447.46624 | 2.4 | 241 | 279 | … | … |
| 57447.46792 | 2.4 | 89 | 148 | … | … |
| Notes: a) is the peak pixel values at the location of SS Cyg. b) is the RMS noise. c) Only the spectral index values having uncertainties less than two are noted here. | |||||