An HST/COS legacy survey of high-velocity UV absorption in the Milky Way’s circumgalactic medium and the Local Group
Abstract
Context. The Milky Way is surrounded by large amounts of diffuse gaseous matter that connects the stellar body of our Galaxy with its large-scale Local Group (LG) environment.
Aims. To characterize the absorption properties of this circumgalactic medium (CGM) and its relation to the LG we present the so-far largest survey of metal absorption in Galactic high-velocity clouds (HVCs) using archival ultraviolet (UV) spectra of extragalactic background sources. The UV data are obtained with the Cosmic Origins Spectrograph (COS) onboard the Hubble Space Telescope (HST) and are supplemented by 21 cm radio observations of neutral hydrogen.
Methods. Along 270 sightlines we measure metal absorption in the lines of Si ii, Si iii, C ii, and C iv and associated H i 21 cm emission in HVCs in the velocity range km s-1. With this unprecedented large HVC sample we were able to improve the statistics on HVC covering fractions, ionization conditions, small-scale structure, CGM mass, and inflow rate. For the first time, we determine robustly the angular two point correlation function of the high-velocity absorbers, systematically analyze antipodal sightlines on the celestial sphere, and compare the HVC absorption characteristics with that of Damped Lyman absorbers (DLAs) and constrained cosmological simulations of the LG (CLUES project).
Results. The overall sky-covering fraction of high-velocity absorption is percent for the most sensitive ion in our survey, Si iii, and for column densities log (Si iii. This value is times higher than the covering fraction of 21 cm neutral hydrogen emission at log (H i along the same lines of sight, demonstrating that the Milky Way’s CGM is multi-phase and predominantly ionized. The measured equivalent-width ratios of Si ii, Si iii, C ii, and C iv are inhomogeneously distributed on large and small angular scales, suggesting a complex spatial distribution of multi-phase gas that surrounds the neutral 21 cm HVCs. We estimate that the total mass and accretion rate of the neutral and ionized CGM traced by HVCs is and dd yr-1, where the Magellanic Stream (MS) contributes with more than percent to this mass/mass-flow. If seen from an external vantage point, the Milky Way disk plus CGM would appear as a DLA that would exhibit for most viewing angles an extraordinary large velocity spread of km s-1, a result of the complex kinematics of the Milky Way CGM that is dominated by the presence of the MS. We detect a velocity dipole of high-velocity absorption at low/high galactic latitudes that we associate with LG gas that streams to the LG barycenter. This scenario is supported by the gas kinematics predicted from the LG simulations.
Conclusions. Our study confirms previous results, indicating that the Milky Way CGM contains sufficient gaseous material to feed the Milky Way disk over the next Gyr at a rate of a few solar masses per year, if the CGM gas can actually reach the MW disk. We demonstrate that the CGM is composed of discrete gaseous structures that exhibit a large-scale kinematics together with small-scale variations in physical conditions. The MS clearly dominates both the cross section and mass flow of high-velocity gas in the Milky Way’s CGM. The possible presence of high-velocity LG gas underlines the important role of the local cosmological environment in the large-scale gas-circulation processes in and around the Milky Way.
1 Introduction
Observational and theoretical studies indicate that a substantial (if not dominant) fraction of the diffuse gaseous material in spiral galaxies is situated outside the disk in an extended halo that reaches out to the virial radius (). This extraplanar diffuse gas component is commonly referred to as the circumgalactic medium (CGM). Beyond the virial radius there also exists a large amount of diffuse gas that is gravitationally bound to the large-scale cosmological environment in which the galaxies reside (Wakker et al. 2015). Depending on the nature of this cosmological environment, the diffuse gas beyond is called the intergalactic medium, IGM, or the intragroup/intracluster medium in case of an IGM bound in galaxy groups and clusters. The life cycle of such gas is determined by cosmological structure formation, infall and outflow from galaxies, and galaxy merging. As a result, gas far beyond the stellar bodies of galaxies spans large ranges in physical conditions and chemical abundances, but also represents a major baryon reservoir (e.g., Fox et al. 2014; Tumlinson et al. 2013; Werk et al. 2013; Liang & Chen 2014; Nuza et al. 2014; Richter et al. 2016).
The Milky Way is known to also be surrounded by diffuse gas that originates in the Galaxy’s CGM and in the LG (see Wakker & van Woerden 1997; Richter 2006; Putman et al. 2012; Richter 2017 for reviews). Recent studies further indicate that M31 also has an extended gaseous halo (Lehner et al. 2015). In contrast to more distant galaxies, the gaseous outskirts of the Milky Way and M31 can be studied in great detail owing to the large amounts of emission and absorption-line data that are available from various instruments, as well as from simulations (e.g., Fox et al. 2014; Nuza et al. 2014, hereafter refered to as N14). Studies that focus on characterizing the nature of the Milky Way’s CGM and its connection to LG gas and M31 thus are crucial for our general understanding of circumgalactic gas in the local Universe.
As a result of our position within the disk of the Milky Way, the local CGM/IGM can be identified most efficiently from its kinematics, as the bulk of the gas does not participate in the rotational motion of the Galaxy’s thin and thick disk (e.g., Wakker & van Woerden 1997). The characteristic Local Standard of Rest (LSR) velocity range of gas in the Milky Way’s CGM and in the LG thus lies between and km s-1 (Wakker & van Woerden 1997), although CGM gas at lower velocities might exist (Peek et al. 2009; Zheng et al. 2015). The Doppler-shifted CGM therefore can be observed either through emission or absorption lines of hydrogen and heavy elements with spectrographs that exhibit sufficient spectral resolution. In addition to radio observations that can be used to pinpoint the amount of predominantly neutral gas in the local CGM using the 21 cm hyperfine structure transition of H i, ultraviolet (UV) and optical absorption spectra of extragalactic background sources are extremely useful to study metal-ion absorption in both neutral and ionized gas down to very low gas column densities. UV satellites such as the Far Ultraviolet Spectroscopic Explorer (FUSE) and the various UV spectrographs installed on HST (e.g., the Space Telescope Imaging Spectrograph, STIS, and COS) have been very successful in providing large amounts of UV absorption-line data to study the CGM of the Milky Way in great detail (e.g., Wakker et al. 2003; Sembach et al. 2003; Lehner et al. 2012; Herenz et al. 2013; Fox et al. 2014).
In the canonical classification scheme of the Milky Way’s circumgalactic gas components one defines the so-called “high-velocity clouds” (HVCs) as gaseous structures that are observed in H i 21 cm radio emission or in line-absorption against extragalactic background sources at LSR velocities km s-1. The “intermediate-velocity clouds” (IVCs) represent extra-planar gaseous features at lower radial velocities ( km s-1). IVCs are often related to gas in the disk-halo interface at low vertical distances from the disk ( kpc; Wakker 2001).
Over the last decades there has been substantial progress in characterizing the role of the Galactic CGM in the on-going evolution of the Milky Way. The combination of 21 cm and UV spectral data allowed researchers to pinpoint the chemical composition of the gas and its physical conditions (Wakker et al. 1999, 2003; Sembach et al. 2003; Richter et al. 1999, 2001a, 2001b, 2009, 2012, 2013; Tripp et al. 2012; Fox et al. 2005, 2010, 2013, 2014; Fox, Savage & Wakker 2006; Ben Bekhti et al. 2008, 2012; Lehner et al. 2010, 2011, 2012; Collins et al. 2009; Shull et al. 2009). In general, the Milky Way’s CGM is metal-enriched with abundances in the range solar (e.g., Wakker et al. 1999; Richter et al. 2001b; Fox et al. 2013). The presence of low and high ions in the gas reflects its extreme multi-phase nature with temperatures ranging from to K. Recent studies imply that the bulk of the Milky Way CGM baryons reside in a diffuse (at gas densities cm-3), predominantly ionized gas phase that can be detected in UV and X-ray absorption lines of intermediate and high ions against extragalactic background point sources (e.g., Sembach et al. 2003; Wakker et al. 2003; Shull et al. 2009; Richter et al. 2008, 2009; Lehner et al. 2012; Miller et al. 2016). Another important finding from absorption spectroscopy is that most of the spatially extended neutral gas features that are seen in H i 21 cm emission are relatively nearby at distances kpc (Ryans et al. 1997a, 1997b; Wakker et al. 2007, 2008; Thom et al. 2006, 2008; Lehner et al. 2012; Richter et al. 2015), ruling that that these objects represent pristine, extragalactic gas clouds (see discussion in Blitz et al. 1999). Many of the ionized HVCs are located at similarly small distances deep within the potential well of the Milky Way (Lehner & Howk 2011; Lehner et al. 2012), but some of observed high-ion absorbers possibly are related to LG gas (Sembach et al. 2003; Nicastro et al. 2003).
The only neutral high-velocity structure in the Galactic CGM that clearly reaches beyond 30 kpc distance is the MS, a massive stream ( ) of neutral and ionized gas that originates from the interaction of the two Magellanic Clouds as they approach the Milky Way (Dieter 1971; Wannier & Wrixon 1972; Mathewson et al. 1974; D’Onghia & Fox 2016). Our recent studies of the MS based on UV data from FUSE, HST/STIS and HST/COS (Fox et al. 2010, 2013, 2014; Richter et al. 2013) indicate that the MS contains more gas than the Small and Large Magellanic Clouds, feeding the Milky Way over the next Gyr with large amounts of mostly metal-poor gas.
In this paper, we present the so-far largest survey of UV absorption features in the Milky Way’s CGM and in the LG using archival HST/COS data of 270 extragalactic background sources. The aim of this paper is to pinpoint the absorption characteristics of the Milky Way’s CGM and gas in the LG based on proper statistics, to explore the overall physical conditions and the distribution of different gas phases in the gaseous outskirts of our Galaxy, to estimate the total gas mass in HVCs and the Milky Way’s gas accretion rate, and to compare the absorption properties of the Milky Way disk+CGM with that of other galaxies. The HVC absorption catalog presented here provides an excellent data base for the comparison between the Milky Way CGM and circumgalactic gas around other low- galaxies, as traced by intervening absorption-line systems (e.g., Prochaska 2017). Since massive gas streams from merger events like the MS are rare in low redshift galaxies, we provide statistical results on the absorption properties of the Milky Way CGM including and excluding the MS contribution. Note that in this paper we do not investigate the chemical composition of the Galactic CGM, dust depletion patterns in the CGM, the role of outflows, or detailed ionization conditions in individual HVCs; these aspects will be presented in forthcoming studies.
This paper is organized as follows: in Sect. 2 we describe the observations, the data reduction and the analysis method. In Sect. 3 we characterize the global absorption properties of the Milky Way CGM and LG gas. The distribution of equivalent widths and column densities of different metal ions is presented in Sect. 4. In Sect. 5 we discuss structural properties of the CGM (HVC complexes, relation to LG galaxies and LG gas, small-scale structure). An estimate of the HVC ionized gas content, total mass, and accretion rate is presented in Sect. 6. In Sect. 7 we relate the absorption characteristics of the Milky Way disk+halo to that of DLAs and compare the observations with predictions from constrained cosmological simulations of the LG. Finally, we conclude our study in Sect. 8.
2 Observations, data handling, and analysis method
2.1 COS spectra selection and data reduction
In this study we use archival HST/COS data that were retrieved from the HST Science Archive at the Canadian Astronomy Data Centre (CADC). For our analysis we concentrate on absorption lines of low, intermediate, and high ions from silicon and carbon (Si ii, Si iii, C ii, and C iv). Si ii, Si iii, and C ii have strong transitions in the wavelength range between and Å, as listed in Table 1. This wavelength range is covered by the COS G130M grating that operates from Å at a spectral resolution of ( km s-1 FWHM at a native pixel size of km s-1; Green et al. 2012; Debes et al. 2016). For the study of the C iv doublet at Å we require data obtained with the COS G160M grating that covers the range Å (at a spectral resolution similar to that of the G130M grating). In Table 1 we summarize atomic data for the UV transitions of the metal ions that we consider for our analysis (from Morton 2003).
In this paper, we do not analyze UV absorption of other available ions, such as O i and Si iv. Neutral oxygen is an important ion to determine the abundance in Galactic HVCs (Wakker et al. 1999; Richter et al. 2001; Sembach et al. 2004) and to study the distribution of metal-enriched, neutral gas, as O i and H i have identical ionization potentials. In our COS data, the only available O i line at Å is contaminated by airglow lines, however. They can be avoided only by using night-only data, which will usually reduce the S/N. In addition, O i is often saturated, so that for most cases where this line is detected only lower limits on the O i column density can be derived. The large range in S/N in our data set together with the above listed restrictions limits the diagnostic power of the O i line to a relatively small sub-sample of our sightlines and thus we refrain from considering O i in this study. A detailed analysis of O i absorption in HVCs based on HST/COS data instead will be presented in a forthcoming study.
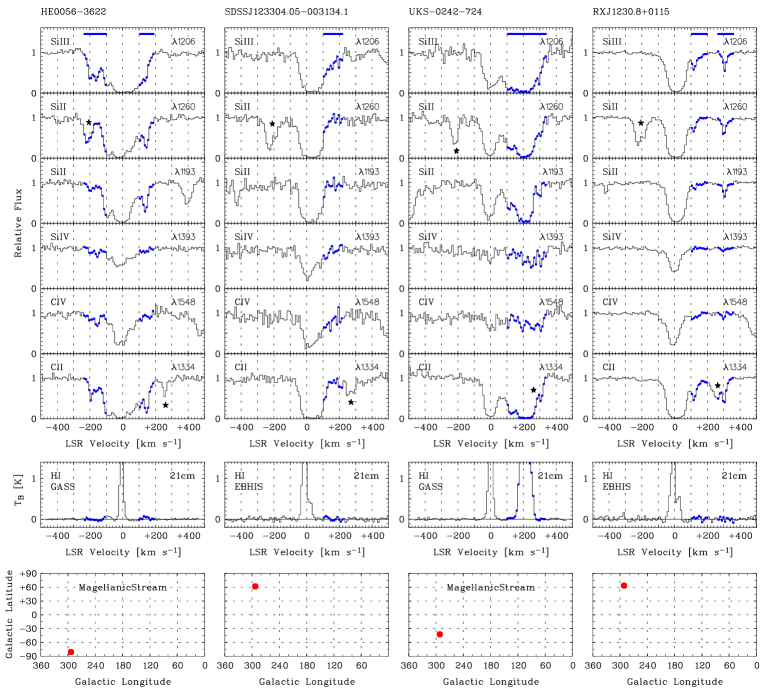
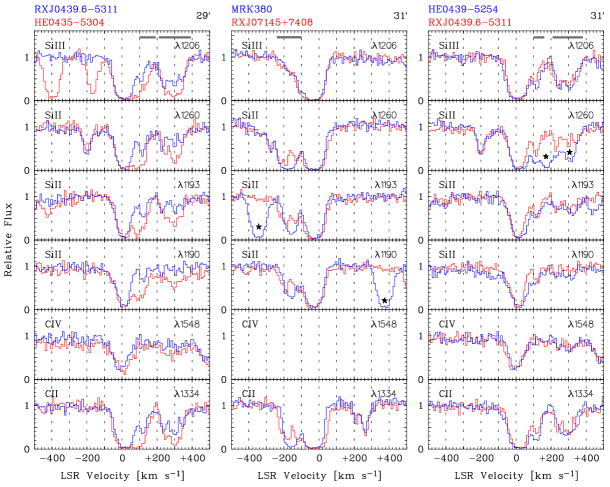
Like C iv, Si iv is a useful tracer of highly ionized gas in and around neutral HVCs, but because of the lower abundance of Si compared to C (Asplund et al. 2009) the detection rate of Si iv at high velocities is relatively small ( percent in our data; see also Herenz et al. 2013). Therefore, not much additional information is gained from this ion and therefore we also exclude Si iv from our analysis (but show the Si iv absorption in our finding charts; see Fig. 1).
To study high-velocity UV absorption in Si ii, Si iii, C ii, and C iv we searched for all publicly available COS spectra from all types of extragalactic point sources using the CADC web interface. Suitable background sources include various types of AGN and galaxies. G130M/G160M data sets for 552 targets were identified and downloaded by the end of February 2014. The original (raw) data of the individual science exposures were processed by the CALCOS pipeline (v2.17.3) and transformed into standard x1d fits files. In a second step, the individual exposures then were coadded using a custom-written code that aligns individual exposures based on a pixel/wavelength calibration. The code considers the relative position of line flanks (for spectra with a S/N per resolution element of ) or line centers (for spectra with lower S/N) of various interstellar anchor lines that are distributed over the wavelength range of the G130M and G160M gratings. The heliocentric velocity positions of the anchor lines were determined from supplementary H i 21 cm data from the EBHIS and GASS surveys (see next section). The individual spectra were rebinned and then coadded pixel-by-pixel using the count rate in each pixel; pixels with known artifacts were flagged accordingly and the errors were calculated in the coadded spectra. Finally, we performed a careful visual inspection of the final coadded G130M and G160M spectra to check the quality of the data reduction process.
For the analysis of high-velocity absorption we selected only those spectra that have a minimum S/N of per resolution element in the wavelength range between and Å. This selection criterion reduces the total sample to lines of sight. QSO names and Galactic coordinates for these sightlines are listed in Table A.1 in the Appendix.
2.2 CGM identification and absorption-line analysis
| Ion | [Å] | |
|---|---|---|
| Si iii | 1206.50 | 1.6690 |
| Si ii | 1190.42 | 0.2502 |
| 1193.29 | 0.4991 | |
| 1260.42 | 1.0070 | |
| 1304.37 | 0.1473 | |
| 1526.71 | 0.2303 | |
| C ii | 1334.53 | 0.1278 |
| C iv | 1548.19 | 0.1908 |
| 1550.77 | 0.0952 |
a Taken from Morton (2003).
For the identification of high-velocity absorption along the 270 COS sightlines we transformed the spectra into a LSR velocity frame. For all sightlines we determined (in an automated fashion) a global continuum level by normalizing the velocity profiles to the highest flux level in the velocity range km s-1. In this way, we created HVC finding charts that were visually inspected to identify high-velocity absorption in the range km s-1. In Fig. 1, we show four examples of such finding charts. The full set of velocity profiles for all 270 sightlines is shown in the Appendix in Fig. B.2. Note that absorption at lower (absolute) velocities is not considered here (although such gas may belong to the halo), as it would require a careful velocity modeling for each sightline to disentangle disk and halo components, which is clearly beyond the scope of this paper.
We regard a high-velocity absorption feature as a definitive detection if it is convincingly ( evidence) detected in at least two of the above given metal transitions at km s-1, where we use the formalism to define a local detection limit described in Sect. 3.1. This strategy is similar to our previous surveys (Richter et al. 2009, 2016; Lehner et al. 2012; Herenz et al. 2013), but is more restrictive than other studies where also single-line detections are considered (e.g., Collins et al. 2009; Shull et al. 2009). If a high-velocity feature is seen only in one transition (e.g., as a result of low S/N, lack of data, or due to blending with IGM lines) we label it as HVC/CGM candidate absorber, but do not further consider it in the statistical analysis unless stated otherwise.
The spectral features then were analyzed using the custom-written line analysis tool span. For each high-velocity absorber the exact shape of the local continuum was determined by a low-order polynomial fit of the global continuum (see above; Fig. 1; Fig. B.2) within km s-1. Equivalent widths (and their errors) were determined by a direct pixel integration over the absorption profiles. In a similar fashion, ion column densities (or lower limits) then were derived by integrating over the velocity profiles using the apparent optical depth (AOD) method, as originally described in Savage & Sembach (1991). For possibly saturated absorption features (i.e., features with absorption depths ) the column density obtained from the AOD method is regarded as lower limit. To minimize the influence of saturation effects we adopted as final column density the value obtained for the weakest available line for each ion that shows well-defined high-velocity absorption features. Note that, because of the extended wings of the COS line-spread function, the equivalent widths and column densities derived in this way could be underestimated by a few percent (see Wakker et al. 2015; Richter et al. 2013).
Since we here consider only absorption in the velocity range km s-1, we cut away the low-velocity extensions of HVC features near km s-1. While this partial velocity integration is unsatisfying, we decided to stick to a strict velocity cut-off at km s-1 to avoid introducing a bias in our absorber statistics. Yet, the listed equivalent widths, column densities (and the ratios of these quantities) for absorbers near km s-1 need to be interpreted with some caution due to this velocity cut-off.
In view of the limited spectral resolution of the COS instrument we do not further investigate in this survey the velocity-component structure of the detected HVC absorbers. All measured equivalent widths and column densities for the high-velocity absorbers in our sample are summarized in Table A.2 in the Appendix. For those high-velocity features that have been studied previously with HST/STIS and HST/COS data (e.g., Richter et al. 2009; Herenz et al. 2013; Fox et al. 2013, 2014) the values derived by us generally are in very good agreement with the previous results.
2.3 Complementary H i 21 cm data
We complement our HST/COS absorption-line data with 21 cm data from different instruments and observing campaigns to investigate the relation between UV absorption and 21 cm emission along each sightline and to infer the ionization state of the Milky Way CGM.
First, we use 21 cm data from the Galactic-All Sky Survey (GASS; McClure-Griffiths et al. 2009; Kalberla et al. 2010), which was carried out with the 64 m radio telescope at Parkes. The angular resolution of the GASS data is with an rms of mK per spectral channel ( km s-1). Secondly, we make use of 21 cm data obtained as part of the new Effelsberg H i Survey (EBHIS), which was carried out on the Effelsberg 100 m radio telescope (Kerp et al. 2011; Winkel et al. 2010). Compared to GASS, EBHIS data has a slightly higher noise level ( mK) and a somewhat lower velocity resolution (channel separation: km s-1), but the angular resolution is higher (). The typical H i column density limit in the 21 cm data used here is a few times cm-2. In general, our 21 cm data is complete for H i column densities cm-2 ( level). Note that there are other, more sensitive 21cm surveys for individual regions (e.g., Lockman et al. 2002). For each sightline we included the 21 cm velocity profile in the HVC finding charts (Fig. 1; Fig. B.2).
H i column densities (and their limits) were determined by integrating the 21 cm emission profile over the appropriate velocity range (defined by the UV absorption) using the relation
| (1) |
where denotes the brightness temperature (in [K]) and the gas is assumed to be optically thin in 21 cm (Dickey & Lockman 1990).
3 Characterization of HVC absorption
| Ion | log | all sky | all sky | |||||||
|---|---|---|---|---|---|---|---|---|---|---|
| without MSc | ||||||||||
| Si iii | ||||||||||
| Si ii | ||||||||||
| C ii | ||||||||||
| C iv |
a Note that only those HVC absorbers are considered that are detected in at
least two transitions.
b Completeness level at ; see Sect. 3.1.
c See Table 3 for adopted ranges.
3.1 Sky distribution
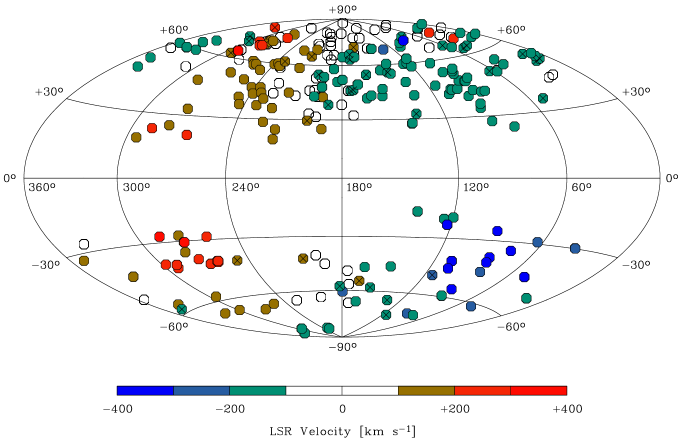
In Fig. 2 we show the sky distribution of the 270 sightlines in Galactic coordinates () using a Hammer-Aitoff sky projection centered on . Filled circles indicate directions along which high-velocity absorption ( km s-1) is convincingly detected in at least two different UV lines, while crossed filled circles label the tenative detections and open circles the non-detections. The mean radial velocity of the absorption is indicated with the color scheme shown at the bottom of the plot. There is a clear asymmetry in the sky distribution of the LOS: three quarters of the sightlines are located in the northern sky. About percent of the detected HVC absorption features have negative velocities. They are found at and with only a few exceptions. Positive-velocity HVC absorption concentrates in a strip in galactic longitude in the range . There is a striking lack of HVC absorption near the northern galactic pole at . The low detection rate of low and intermediate ions in this region has been noted previously (Lehner et al. 2012), but this trend now becomes more significant due to the improved statistics. In the southern part of the sky, gas from the MS dominates the absorption characteristics of high-velocity gas (Fox et al. 2013, 2014). However, some of the negative velocity gas at possibly belongs to the CGM of M31 (Lehner et al. 2015) and to intragroup gas in the Local Group filament, as will be discussed later.
Note that the observed velocity dipole of the high-velocity absorption at high galactic latitudes cannot be explained alone by galactic rotation, because along many sightlines cos () is smaller than the observed absorption velocities, even if a high circular orbit speed of the Sun of km s-1 is assumed (Reid et al. 2014). For MS absorption in the south, in particular, the velocity dipole instead suggests a non-circular orbit of the Stream around the Milky Way (Putman et al. 2003).
We securely detect HVC absorbers along the sightlines, translating to a detection rate of high-velocity absorption of percent. If we add the HVC candidates (tentative detections, see above), the detection rate increases to percent. There are, however, a large number of low-S/N spectra in our sample that are not particular sensitive to detect weak HVC features.
To take into account the differen S/N ratios in our spectra and to compare our results with previous measurements we need to consider the detection threshold of our COS data in more detail. For each of the four ions considered in this study (C ii, C iv, Si ii, and Si iii) we transformed the individual detection rates, , into covering fractions, , where represents a specific (lower) column-density threshold. As covering fraction we define the number of sightlines that exhibit securely detected high-velocity absorption with a column density , devided by the total number of sightlines that are sensitive to detect HVC absorption at . For a spectrum with a given S/N ratio per resolution element, a spectral resolution , the limiting column density threshold, , for an unresolved line with oscillator stength at laboratory wavelength (Table 1) is given by the expression
| (2) |
Because our COS spectra span a large range in S/N, they are unequally sensitive to show high-velocity absorption features and thus is expected to decrease with decreasing S/N (and increasing ).
Having defined , we can study the completeness, , of our QSO sample. For this we relate for each ion the number of sightlines with a given column density threshold, , to the total number of sightlines, , along which high-velocity absorption in that ion can be detected:
| (3) |
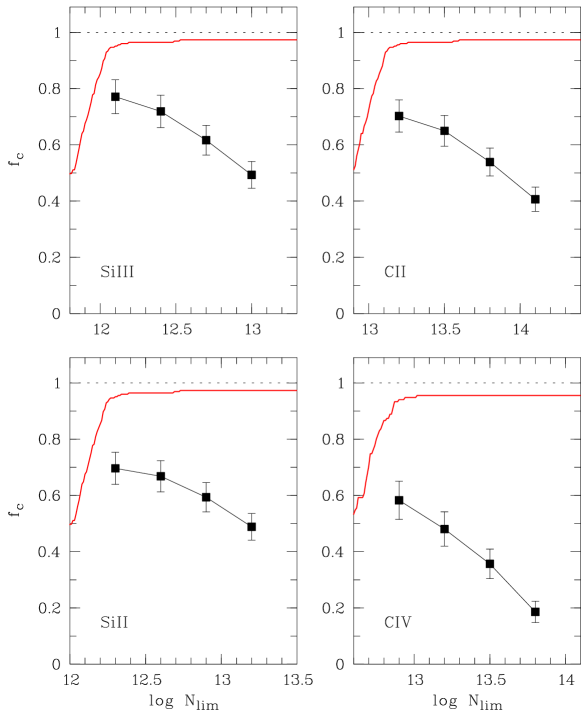
The most sensitive tracer for absorption in our survey is Si iii , which has a very large oscillator strength (see Table 1; Morton 2003). Si iii resides in diffuse ionized gas and traces the CGM around galaxies for a broad range of physical conditions (see Collins et al. 2009; Shull et al. 2009; Richter et al. 2016). In our sample, the Si iii all-sky covering fraction in HVCs is percent for , where the completeness is at that column-density level. This value is very similar to the covering fraction of highly-ionized gas traced by O vi ( percent; Sembach et al. 2003). The all-sky covering fractions for the other ions in our survey are lower than for Si iii; they are listed in the fourth row of Table 2 together with log (second row) and (third row). Interestingly, the detection rate for C iv is lower than for the singly- and doubly-ionized species. Note that for C ii blending effects with C ii slightly reduce the sensitivity to detect high-velocity C ii in the range km s-1 (see Fig. 1).
The values for derived in our survey are very similar to those presented in earlier studies using smaller data samples (Lehner et al. 2012; Herenz et al. 2013). The expected decline of with increasing is shown for all four ions in Fig. 3 (filled boxes) together with the completeness function (red solid line). For Si iii, for instance, declines from to percent if log is increased from to . Fig. 3 underlines the importance of high S/N data for our understanding of the spatial distribution of low-column density gas in the Milky Way’s CGM.
In Table 2 we provide additional information on how varies for different latitude bins. In general, the covering fraction of high-velocity gas is slightly smaller in north than in the south ( vs. for Si iii), reflecting the fact that the MS covers a significant portion of the southern sky (Fox et al. 2014; Lehner et al. 2012). The absorption fraction reaches 100 percent near the southern galactic pole at (Table 2, last column). Near the northern galactic pole for (thus far away from the MS) the covering fraction is instead only percent, marking the most striking difference between the northern and southern high-velocity sky. If we exclude the region covered by the MS (see Table 3 for adopted ranges), then the covering fractions are slightly (but not substantially) smaller than the all-sky values (Table 2, last column).
Our study demonstrates that more than three quarters of the sky is covered by diffuse high-velocity gas. Additional absorption-line data for would be desirable to fill the various gaps in the LOS distribution in the southern sky (Fig. 2). Yet, the observed large-scale trends for are statistically robust, indicating an inhomogeneous distribution and a north/south disparity of high-velocity gas on the Galactic sphere.
3.2 Velocity distribution
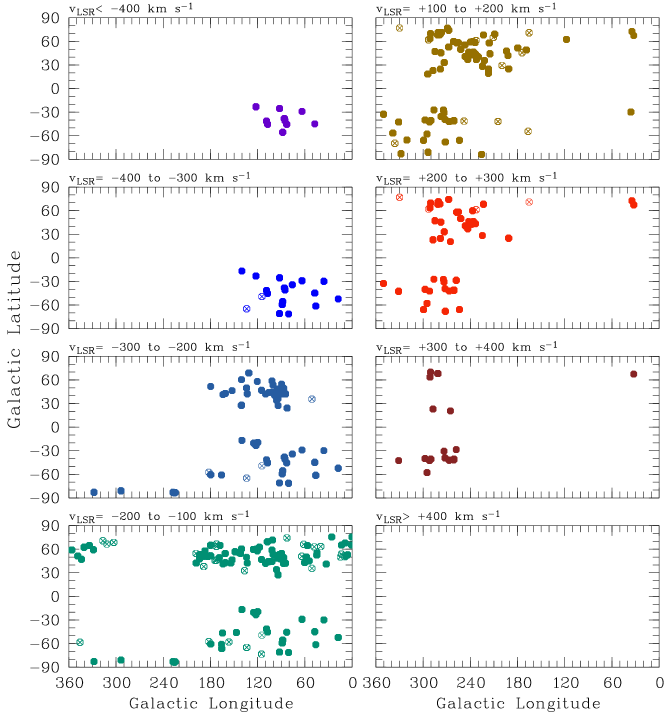
While Fig. 2 gives a general overview of the distribution of high-velocity absorption on the sky at positive and negative radial velocities, it is useful to explore in more detail the distribution of the absorption within different velocity bins. In Fig. 4 we therefore show velocity channel maps of high-velocity absorption in bins of km s-1.
The main difference compared to Fig. 2 is that here the entire velocity range of the detected high-velocity absorption is taken into account, while in Fig. 2 only the mean absorption velocity is considered. High-velocity absorption at very high velocities km s-1 is seen only at negative velocities, predominantly at and . High-velocity absorption at negative velocities in the northern sky, in contrast, is limited to km s-1. In Sect. 5 we will further discuss the origin of these velocity signatures with respect to the different HVC complexes and gas in the LG.
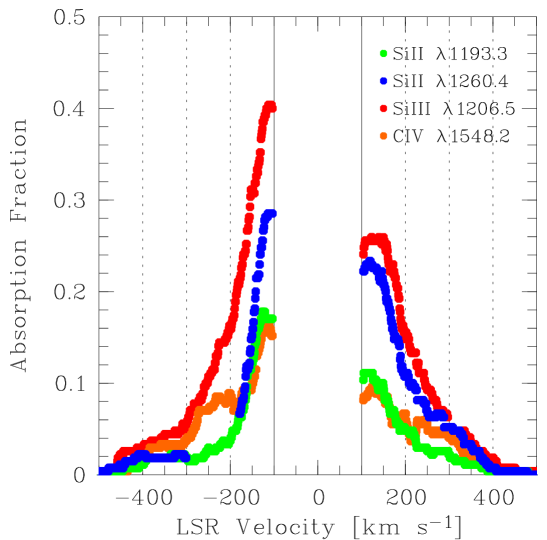
3.3 Absorption fraction vs. radial velocity
An important task is to investigate a possible radial change in the physical conditions of the Milky Way CGM. Ideally, one would study systematically diagnostic metal-ion ratios (such as Si ii/Si iii and C ii/C iv) as a function of distance to the absorbers. Measuring HVC distances is very difficult, however, and reliable distance estimates have been determined only for a very limited number of halo clouds (Ryans et al. 1997a, 1997b; van Woerden et al. 1998; Wakker et al. 2007, 2008; Thom et al. 2006, 2008; Lehner & Howk 2011; Lehner et al. 2012; Richter et al. 2015). An alternative approach in this context is to investigate the detection rates (absorption fractions) of the various ions as a function of radial velocity, which provides at least some indirect information on the gas properties of nearby and more distant gas and its radial direction of motion.
In Fig. 5 we have plotted vs. for our HVC absorber sample. It is evident that there are substantial differences between the trends at positive and negative radial velocities. First, the absorption fractions are higher for gas at negative velocities than for positive velocities (at similar sensitivity), a trend that is valid for all of the four considered transitions. This implies that there is more absorbing CGM material that moves towards the Sun than gas that is moving away from it. Secondly, at negative velocities, the absorption fraction of Si iii (red line) is always significantly higher than that of Si ii (blue line), while at positive velocities the absorption fractions in both lines are very similar. Thirdly, there is a mild enhancement of (C iv) in the range to km s-1 compared to positive velocities.
In section A.1 in the Appendix we discuss the relation between absorption fraction and LSR velocity excluding the contribution from the MS.
3.4 Interpretation of observed trends
The covering fractions for the individual ions, as discussed in the previous subsections, reflect a complex (projected) spatial distribution of the different gas phases in the Galactic halo that are traced by the various low, intermediate, and high ions in our survey. These phases range from from cold/neutral gas at relatively high densities ( cm-3) to warm/hot ionized gas at low densities ( cm-3) where the gas cannot recombine efficiently (see review by Richter 2017).
The sky covering fractions indicate that diffuse, predominantly ionized gas, as traced by Si iii, as well as Si ii, and C ii, represents the most widespread gas phase in the Milky Way’s population of HVCs (see also Shull et al. 2009), which move as coherent circumgalactic structures through the ambient hot coronal gas. The high detection rate of Si iii in circumgalactic absorption-line systems at low redshift (Richter et al. 2016) suggests that streams of predominantly ionized gas represent typical features of low-redshift galaxy halos. To reach the observed ion column densities at low gas densities, the absorption path lengths, , in the diffuse ionized gas layers must be large (a few up to a few dozen kpc, typically, as .) This, together with the large cross section, implies that the diffuse ionized gas phase occupies most of the volume in circumgalactic gas streams, whereas the bulk of the neutral gas (traced by H i 21 cm emission) is confined to specific regions that exhibit the largest gas densities (e.g., Lehner et al. 2012; Joung et al. 2012; Richter 2012). The somewhat lower detection rate of C iv compared to Si iii (Table 2) and O vi (Sembach et al. 2003; Wakker et al. 2003) indicates that C iv traces a gas phase in the Milky Way CGM that is not as widespread as the phase traced by the other two ions, even if one takes into account the only moderate oscillator strengths of the C iv doublet lines (Table 1).
The apparent lack of HVC absorption near the northern galactic pole in our survey and in the study by Lehner et al. (2012) suggests that this regions is devoid of neutral and diffuse ionized gas. In contrast, Fox, Savage & Wakker (2006) report the detection of O vi absorption at high positive velocities along several sightlines near the northern galactic pole (their Fig. 1). Together, both results imply that the halo gas near the northern galactic pole is predominantly highly ionized and thus in a phase, that is not traced by the low and intermediate ions considered in this survey.
In general, the physical conditions in the CGM around galaxies are known to be diverse, with temperatures and densities spanning a large range (e.g., Joung et al. 2012; Nuza et al. 2014). On the one hand, they are governed by kinematically complex (and highly dynamic) gas circulation processes (infall, outflow, tidal interactions) that create an inhomogeneous, irregular distribution of gaseous matter around Milky-Way type galaxies (see review by Richter 2017). On the other hand, the physical conditions in the CGM are also expected to change gradually from the inside-out owing to declining depth of the gravitational potential at larger distances and the resulting decreasing (equilibrium) gas pressure (see, e.g., Miller & Bregman 2015). For isothermal gas one would expect to see a declining (mean) gas density at larger distances, which - depending on the radial decline of the ionizing radiation field - possibly results in a higher degree of ionization in the outer halo. Indeed, such a gradual increase in the degree of ionization with increasing galactocentric distance is possibly visible in the CGM of M31 (Lehner et al. 2015) and other low-redshift galaxies (e.g., Werk et al. 2013).
For the Milky Way halo, Lehner & Howk (2011) demonstrated that the covering fraction of low and high ions in HVCs with km s-1 towards halo stars with kpc are similar to those derived against QSOs, implying that a large fraction of the CGM gas at low velocities resides relatively nearby in the lower Milky Way halo, while most of gas at very high velocities resides in the outer halo. In view of this trend, Fig. 5 suggests that the observed absorption fraction of ionized gas at high velocities in our survey is due to gas located at large distances from the Galactic plane. Moreover, the observed excess of Si iii and C iv compared to Si ii at km s-1 suggests that there is more diffuse ionized gas in the CGM at negative velocities compared to positive velocities. As we show in the Appendix (Sect. A.1), much of this negative-velocity gas is related to the MS, which has a very large cross section on the sky (see Sect. 5.1; Fox et al. 2014). In addition, some of this ionized material at high negative velocities possibly is related to UV-absorbing LG gas in the general direction of the LG barycenter (see Sembach et al. 2003). This scenario will be further discussed in Sect. 5.4.
4 Distribution of equivalent widths and column densities
4.1 Equivalent widths and column densities of low and high ions
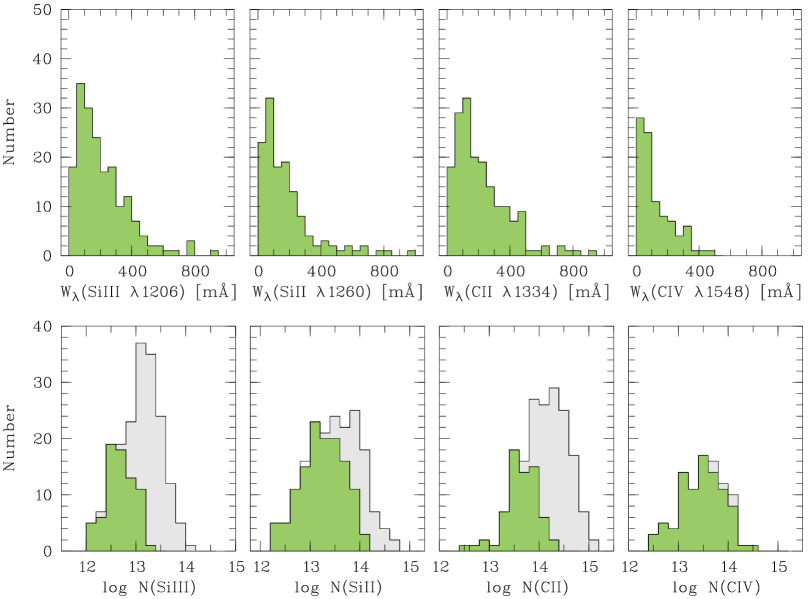
In the upper panels of Fig. 6 we show the equivalent width distribution of Si iii , Si ii , C ii , and C iv for the 187 securely detected high-velocity absorption components in our survey. Note that these equivalent widths are derived from integrating over the entire velocity range without taking any component structure into account. The equivalent-width distributions for these four ions are very similar to each other, with a peak at low equivalent widths between and mÅ and a rapid decline towards larger equivalent widths. The majority ( percent) of the absorbers have equivalent widths mÅ in the Si iii line ( percent for Si ii , percent for C ii , and percent for C iv ). The equivalent-width distribution of Si iii in Galactic high-velocity absorbers mimics that of intervening Si iii absorbers at , which are believed to trace the CGM of low-redshift galaxies (Richter et al. 2016; their Fig. 2).
In the lower panels of Fig. 6 we show histograms of the derived ion column densities (green) and their lower limits (gray) based on the AOD analysis (see Sect. 2). Only for Si ii and C iv is there more than one transition available (and C iv absorption is generally weak in HVC absorbers), so that only for these two ions can saturation effects be minimized by using for each absorber the weakest detected line for the determination of log . As a result, the gray-shaded area for these ions in Fig. 6 is smaller than for Si iii and C ii.
4.2 Equivalent-width ratios and column-density ratios
As discussed above, the absorption fractions for the different ions in high-velocity absorbers at different radial velocities (Fig. 5) indirectly indicate a non-uniform radial distribution of different gas phases in Milky Way’s circumgalactic environment. Another strategy to explore the large-scale ionization structure of the absorbing gas in our sample is to investigate equivalent-width ratios of low/intermediate/high ions in different regions of the sky and/or in different velocity bins along sightlines, where these different ions are detected simultaneously.
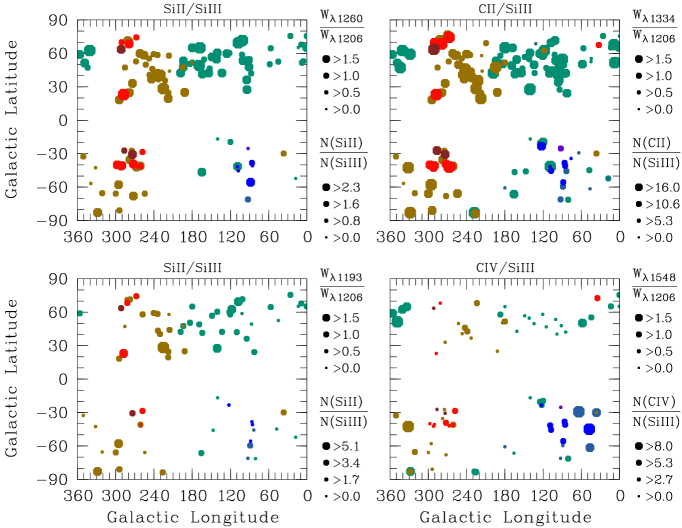
In Fig. 7 we show the spatial distribution of the equivalent-width ratios (Si ii /Si iii ), (Si ii /Si iii ), (C ii /Si iii ), and (C iv /Si iii ). We use Si iii as reference ion as it arises in gas spanning a wide range in physical conditions. Si iii thus represents a robust tracer for the ionized gas column of metal-enriched circumgalactic gas at K (see Richter et al. 2016). For comparison, we also show the respective column-density ratios for these ions in Fig. 7 assuming optically thin absorption (i.e., saturation effects are ignored).
The sky distribution of the equivalent-width ratios shows some interesting trends. In the northern hemisphere, there are many sightlines that exhibit high Si ii/Si iii and C ii/Si iii ratios . As will be discussed in Sect. 5.1 (Fig. 8) many of these sightlines coincide spatially with prominent northern 21 cm HVCs, such as Complex C and Complex A. High Si ii/Si iii and C ii/Si iii ratios are observed, however, also in the many positive-velocity absorbers at that have little or no associated 21 cm emission (see Fig. 8). Also high-velocity absorbers with substantially smaller Si ii/Si iii and C ii/Si iii ratios are present at . C iv absorption is predominantly weak in the northern hemisphere when compared to Si iii; only along a handful of sightlines (in directions away from the 21 cm HVCs) are the C iv/Si iii equivalent ratios high.
The situation is quite different in the southern hemisphere. Despite the fact that there are significantly fewer sightlines to be analyzed at , it is possible to discern two distinct regions in Fig. 7 with opposite trends. For the sightlines at , the observed Si ii /Si iii equivalent ratios are predominantly , tracing gas that is associated with the 21cm emission from the MS (see Sect. 5). For , in contrast, the same ratio is predominantly small, while the C iv/Si iii ratio is coherently larger than in any other region in the northern or southern sky. In Sect. 4.4 we will further discuss the physical origin of these large variations in the observed equivant-width ratios.
| HVC complex | Det. rate | c | ddc | |||||||||
| [] | [] | [] | [] | [km s-1] | [km s-1] | [kpc] | [kpc] | [] | [ yr-1] | |||
| Complex GCN | 0 | 60 | -60 | -30 | -350 | -100 | … | 5 | 0.028 | 2/2 | ||
| Complex GCP (Smith Cloud) | 0 | 60 | -30 | 0 | 80 | 200 | 12 | 12 | 0.028 | 1/1 | ||
| Magellanic Stream (MS) | 0 | 180 | -90 | -60 | -500 | -80 | 20-100 | 55 | 0.333 | 41/46 | ||
| 60 | 120 | -60 | 0 | -500 | -80 | |||||||
| 180 | 360 | -90 | -60 | 80 | 500 | |||||||
| 210 | 360 | -60 | -30 | 150 | 500 | |||||||
| 210 | 300 | -30 | 0 | 150 | 500 | |||||||
| Leading Arm (LA) of MS | 300 | 360 | -30 | 0 | 150 | 500 | 20-100 | 55 | 0.139 | 8/10 | (see MS) | (see MS) |
| 240 | 360 | 0 | 60 | 150 | 500 | |||||||
| Complex C | 40 | 90 | 15 | 45 | -250 | -80 | 10 | 10 | 0.062 | 31/32 | ||
| 60 | 110 | 25 | 65 | -250 | -80 | |||||||
| 110 | 150 | 35 | 65 | -250 | -80 | |||||||
| Outer Arm (OA) | 45 | 90 | 0 | 15 | -150 | -80 | 5 | 5 | 0.013 | … | … | |
| 90 | 160 | 0 | 20 | -150 | -80 | |||||||
| Complex G | 60 | 105 | -20 | 0 | -150 | -80 | … | 5 | 0.014 | … | … | |
| Complex H | 105 | 150 | -20 | 20 | -250 | -80 | 5 | 0.028 | 2/2 | |||
| Complex M | 120 | 200 | 45 | 75 | -150 | -80 | 3 | 3 | 0.037 | 12/24 | ||
| Complex A | 145 | 175 | 30 | 45 | -250 | -140 | 8-10 | 9 | 0.010 | 5/6 | ||
| 130 | 145 | 20 | 35 | -250 | -140 | |||||||
| Anti-Center (AC) | 130 | 200 | 0 | -60 | -500 | -80 | 3-8 | 5 | 0.065 | 2/6 | ||
| AC Shell + ACO | 160 | 210 | -20 | 20 | -130 | -80 | 1 | 1 | 0.031 | … | … | |
| Complex WE | 290 | 340 | -30 | 0 | 80 | 150 | 5 | 0.023 | 0/1 | … | ||
| Complex WA + WB | 210 | 260 | 0 | 60 | 80 | 200 | 10 | 0.046 | 21/25 | |||
| HVC toward LMC | 275 | 285 | -38 | -28 | 80 | 150 | 9 | 0.002 | … | … | ||
| Complex L | 300 | 360 | 20 | 60 | -200 | -80 | 0.5-1.5 | 1 | 0.037 | 5/7 |
a Note: HVC information compiled from various sources including Wakker (2001,2003); Wakker et al. (2007,2008);
Thom et al. (2006,2008); Richter (2006); Richter et al. (2015); Wakker et al. (2017, in prep.).
b Distance assumed in our model to calculate the total HVC mass and accretion rate (Sect. 6).
c See Sect. 6.2.
4.3 Relation between UV absorption and 21 cm emission
In Fig. 8 we again show the sky distribution of high-velocity absorbers and their mean LSR velocities (as in Fig. 2), but now overlaid on the H i 21 cm emission map from the LAB survey using the same color coding for the LSR velocities (except for the range km s-1, which is indicated in green for the 21 cm data and ignored in our absorption-line analysis). As expected, emission and absorption features coincide in velocity, demonstrating that they trace the same overall gas distribution. In all regions of the sky, UV absorption is observed beyond the outer boundaries of 21 cm HVCs, indicating that the neutral HVCs are surrounded by extended gaseous envelopes (traced only in absorption) that have low neutral gas column densities.
There are regions that are almost devoid of high-velocity H i, but show strong absorption in the UV. The most prominent of such regions is, again, the region , , which appears to contain mostly ionized gas at extreme negative velocities (see above). Another prominent region in this context is at , , which shows UV absorption at high positive velocities, but almost no high-velocity 21 cm emission. Most of the absorbers in this area have (mean) radial velocities km s-1 and belong to HVC Complex WA (see Sect. 5.1). However, there is also a group of absorbers in this region with km s-1 that possibly trace LG gas (Sect. 7).
There are also a few absorbers above the Galactic center at that have no H i 21 cm counterpart. These absorbers might be related to a large-scale outflow from the Galactic center region (see Keeney et al. 2006; Zech et al. 2008; Lehner et al. 2012; Fox et al. 2015).
To statistically compare the 21 cm properties of HVC-features with our UV absorption-line data we have determined the detection rate of 21 cm emission along the 270 COS sightlines. Out of the 187 high-velocity absorption components detected in Si iii absorption, only 46 show associated H i emission in the 21 cm data with (H i cm-2 (see Fig. 1, middle column, for an example where high-velocity H i is detected and aligned with the UV absorption). This translates into an H i covering fraction of percent for log (H i, which is a factor of lower than the covering fraction for Si iii at log (Si iii. These numbers further demonstrate that the neutral HVCs, as seen in 21 cm emission, just display the tips of the icebergs of the Milky Way CGM, namely the regions with the highest gas densities, while the bulk of the CGM structures has H i column densities below cm-2 and thus remains invisible in our 21 cm data (see also Lehner et al. 2012; Richter et al. 2005, 2009; Fox et al. 2006, 2014). Note that the high-velocity H i covering fraction increases to percent for log (H i, if more sensitive 21 cm data is considered (see Wakker 2004; Lockman et al. 2002).
4.4 Interpretation of observed trends
It has been demonstrated in many previous studies that the equivalent-width/column-density ratios of low, intermediate, and high ions represent powerful diagnostic tools to study the ionization conditions in the CGM (e.g., Fox et al. 2014; Werk et al. 2013; Richter et al. 2016). At higher gas densities, recombination is more efficient, and therefore a high Si ii/Si iii ratio indicates halo gas at relatively high gas densities (same for C ii/Si iii). Smaller Si ii/Si iii and C ii/Si iii ratios, in contrast, indicate regions with high ionization fractions at lower gas densities.
In the northern sky, the observed equivalent widths ratios (Fig. 7) indicate a spatially complex, multi-phase structure of the absorbing gas with many regions that appear to have relatively high densities (with low ions dominating the absorption). Some (but not all) of the northern sightlines with high Si ii/Si iii ratios are associated with prominent 21cm HVC complexes. In the southern sky, the Si ii /Si iii equivalent ratios are predominantly related with relatively dense gas from the neutral gas body of the MS. In the Appendix (Sect. A.2; Fig. A.2) we further discuss the equivalent ratios shown in Fig. 7 as a function of radial velocity.
The fact that UV absorption is observed beyond the outer boundaries of the 21cm HVCs at similar radial velocities than the 21cm emission (Fig. 8) underlines that the neutral gas bodies are surrounded by extended ionized gas layers that build an interface between the neutral HVCs and the ambient hot coronal gas (e.g., Sembach et al. 2003; Miller & Bregman 2015). Previous studies have demonstrated that the ionized envelopes of neutral HVCs contain substantially more mass than their neutral cores (Lehner et al. 2012; Shull et al. 2009; Richter et al. 2009; Sect. 6). A detailed analysis of UV absorption lines that trace the extended ionized gaseous envelopes of 21 cm features from the MS recently has been presented by Fox et al. (2014) using a subset of the COS data sample considered here.
As discussed in Sect. 4.3, not all high-velocity UV absorbers are related to known 21cm HVCs and the trends presented in Sect. 4.2 indicate the presence of ionized gas streams in the halo with low neutral gas columns. With its low Si ii/Si iii and high C iv/Si iii ratios, the region (, ) is distinct in its ionization properties from any other large-scale structure in the high-velocity sky (Fig. 7). It apparently contains mostly moderately to highly ionized gas at low gas densities (resulting in low recombination rates). A high degree of ionization is also indicated by the presence of strong high-velocity O vi absorption in this direction (Sembach et al. 2003). Sembach et al. (1999) modeled the ionization conditions of the high-velocity gas towards PKS 2155304 and Mrk 509 (see Tables A.1 and A.2) and derived very low thermal gas pressures of K cm-3. Gas at such low pressures would not survive long in the inner halo regions of Milky-Way size galaxies at kpc, where the gas pressures are expected to be at least one order of magnitude higher (Wolfire et al. 1995). From the density and temperature constraints of the Milky Way’s hot coronal gas follows that the thermal gas pressure is expected to decline with radius as (Miller & Bregman 2015), indicating that K cm-3 at kpc and K cm-3 at kpc, the latter being the Milky Way’s assumed virial radius (Dehnen et al. 2006; McMillan 2011). Similar pressure gradients are also found in numerical simulations of hot gas around Milky Way-type galaxies (N14). The pressure limit of K cm-3 for the high-velocity gas towards PKS 2155304 and Mrk 509 therefore implies that this absorber is located at very large distances to the disk ( kpc) and possibly traces diffuse gaseous material outside the MW virial radius in the LG in the general direction of the LG barycenter at (see Sembach et al. 1999; 2003).
Further support for this scenario comes from the fact that the HVC absorbers in this region exhibit the highest radial velocities in our survey (extreme negative velocities; see Fig. 4, upper left panel and Sect. 3.4). Hydrodynamical simulations and observations indicate that the infall velocities of gas at large radii are higher than those close to the disk (at kpc), where the kinematics is predominantly determined by the hydrodynamical interaction and the reprocessing of infalling gas by the surrounding hot corona (see Richter 2017 and references therein). We will further explore a LG origin of these HVC absorbers in Sect. 7, where we study the gas flow in the LG using constrained cosmological simulations.
5 Structural properties of the Milky Way CGM
5.1 Identification of HVC complexes
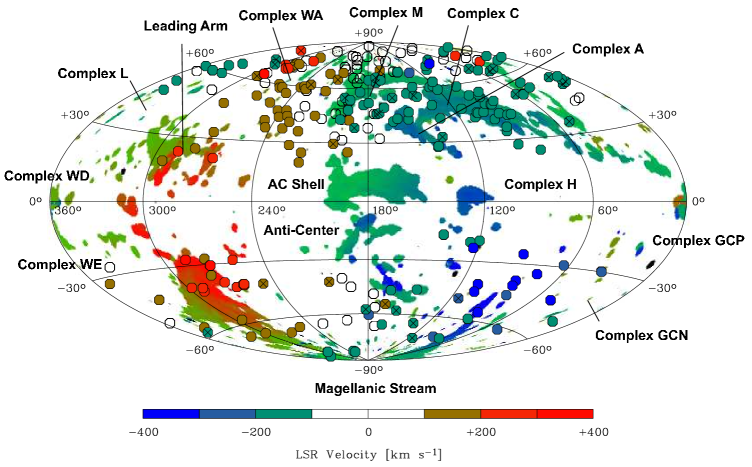
The HVC 21 cm sky historically has been divided into a large number of apparently coherent structures, the so-called HVC ”complexes”, primarily to distinguish between gas clouds in the Milky Way halo that are spatially unrelated and may have different origins (Wakker & van Woerden 1997; Richter 2005, 2017; Putman et al. 2012). The definition of these HVC complexes is based on the position in and of the detected 21 cm features and the radial velocity range in which they are observed (see, e.g., Wakker & van Woerden 1997; Wakker 2001).
In Table 3 we summarize the definition of the most prominent Galactic HVCs, based on the HVC compilation paper of Wakker (2001). For each HVC we list the relevant ranges in Galactic longitude, Galactic latitude, and LSR velocity range in the first seven columns. We also list available distance information for each HVC, the sky covering fraction, (based on the angular definition in and ), and the detection rate of absorption within the limits in , , and from our survey. In the last two rows of Table 2 we further give for each HVC complex the estimated total gas mass and contribution to the CGM gas-accretion rate, as calculated in Sect. 6.
Assuming the () ranges listed in Table 3, the MS together with the Leading Arm, LA, and its extended gaseous environment, spans over a total solid angle of deg2. This gigantic stream of gas therefore represents the by far largest HVC complex, covering almost a quarter of the entire sky. Note that our definition of the angular extent of the MS+LA is different from that used in our previous surveys. This is because we use an angular grid together with an absorption-selected (in ) sightline selection to define the HVC boundaries in our sample, while other studies define the area of the MS+LA based on the 21cm contours (e.g., Fox et al. 2014). This aspect needs to be taken into account when comparing the HVC mass- and accretion-rate estimates from different surveys (see review by Richter 2017).
For the MS+LA there are 56 sightlines available in our sample. For a detailed analysis of MS absorption see Fox et al. (2013, 2014). Other HVC complexes with more than 15 spectra are Complex C (32 sightlines), Complex M (24 sightlines) and Complex WA+WB (25 sightlines).
In this study, we do not further investigate the chemical composition of the individual HVC complexes or their internal kinematics. These aspects will be presented in a forthcoming paper. Some interesting information on the multi-phase nature of the various HVCs can be obtained, however, by systematically studying the equivalent-widths/column-density ratios for those HVC complexes, for which good spatial coverage in our COS data set is available.
5.2 Ion ratios in HVC complexes
In Sect. 4.4 we have discussed the equivalent-width/column-density ratios in our high-velocity absorbers in the context of the ionization structure in the clouds. Fig. 7 indicates that our large data sample allows us to further investigate this aspect for a limited number of individual HVC complexes, for which sufficient spatial coverage is available.
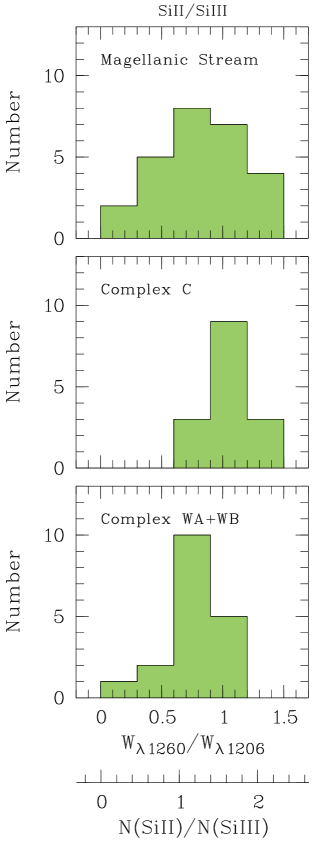
In Fig. 9 we show the distribution of measured equivalent-width/column-density ratios of Si ii /Si iii in the MS, Complex C, and Complex WA+WB. Lower values for Si ii/Si iii indicate lower-density gas with a high degree of ionization (see Sect. 4.4). For Complex C (100 percent) and Complex WA+WB (85 percent) the majority of the column-density ratios are . In contrast, the MS exhibits quite a number of absorbers (30 percent) with Si ii/Si iii column-density ratios . This trend indicates that the fraction of diffuse ionized gas is larger in the MS than in the Complexes C and WA+WB. One the one hand, this may be partly related to the ab-initio definition of the HVC Complexes and their outer boundaries (Table 3). On the other hand, the observed trend in Fig. 9 may be a result of the different distances of these HVCs to the disk, which range from 10 kpc (Complex C), kpc (Complex WA+WB), to kpc (MS; see Table 3, 8th row). Since the CGM gas pressure is expected to decline with increasing distance, HVCs in the outer halo can carry along ionized envelopes with lower densities compared to clouds in the inner halo. This would imply lower recombination rates in the HVC envelopes at large and thus lower values for Si ii/Si iii therein. In addition, diffuse cloud layers around HVCs may be stripped away more efficiently in the inner halo than at larger distances (Heitsch & Putman 2009).
While these explanations are speculative, they are supported by the fact that low Si ii/Si iii column-density ratios are typical for CGM absorber at projected distances kpc around other low-redshift galaxies (Richter et al. 2016; their Fig. 15).
5.3 Connection to Local Group galaxies
While the majority of the high-velocity absorption features in our survey are produced by gas that is gravitationally bound to the Milky Way, several sightlines intersect the circumgalactic environment of other LG member galaxies. Thus, some of the observed high-velocity absorption features might be related to these galaxies. Previous absorption-line studies have indeed demonstrated that UV absorption is observable in the extended halos of the most nearby LG members, such as the Magellanic Clouds (e.g., de Boer & Savage 1980; Lehner & Howk 2007; Richter et al. 2014) and Andromeda (Rao et al. 2013; Lehner et al. 2015; Barger, Lehner & Howk 2016).
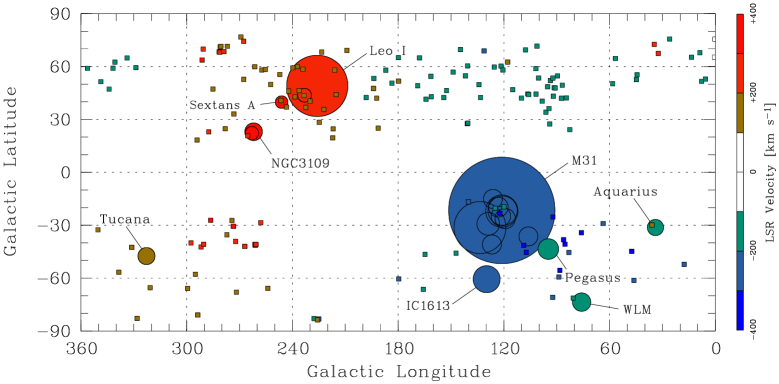
A list of the LG member galaxies is presented in the Appendix in Table A.3. 28 of the listed LG galaxies have radial velocities in the range km s-1 and are located at . To investigate the relation between high-velocity absorption and gaseous halos of LG galaxies we have calculated the projected (angular) size of these galaxies. We here concentrate on LG galaxies beyond the virial radius of our own galaxy ( kpc; Dehnen et al. 2006; McMillan 2011), thus excluding very nearby galaxies such as the Magellanic Clouds and other MW satellite galaxies. We also only consider the brightest galaxies with mag that have the largest angular cross section. For the calculation of and the angular size we use the information on the galaxies’ absolute magnitudes and distances, which we transform into an estimate of their luminosities. We then calculate from the relation from Stocke et al. (2013), which is based on recent halo matching models (Trenti et al. 2010), and then determine the angular size at . In Fig. 10 we show the sky distribution and angular size at of the 19 LG galaxies selected in this manner together with the COS sightlines along which HVC absorption is detected. In the finding charts in the Appendix (Fig. B.2) we have indicated the galaxy velocities for those sightlines that pass within of the selected 19 LG galaxies.
There is an interesting match between the general velocity distribution of the galaxies and the absorption velocities. For all LG galaxies have positive radial velocities from the perspective of the Sun, while for the radial velocities are negative. This trend reflects the general flow of galaxies in the LG towards the LG barycenter (with the MW and M31 being part of this flow), as concluded from studies of the overall dynamics of the LG members (Peebles et al. 2001,2011; Whiting 2014). As shown in Whiting (2014; his Fig. 1), the absolute space velocities of the LG galaxies are expected to be larger if they are closer to the barycenter. From the perspective of the Milky Way, LG galaxies that lie in the antipodal direction with respect to the LG barycenter () thus are expected to lag behind the MW flow speed, thus having positive relative velocities, while galaxies located on the opposite side of the LG barycenter will move towards the Milky Way, thus having negative relative velocities. We would like to emphasize that the effect of galactic rotation only plays a minor role for the observed radial velocities at . As we will discuss below, our observations as well as constrained LG simulations suggest that the LG gas (i.e., gas outside the halos of LG member galaxies) is expected to show an identical velocity-flow pattern.
Fig. 10 implies that there are only two general directions in the sky for which the distribution of COS sightlines allows us to systematically study the connection between high-velocity absorption and nearby LG galaxies based on multiple lines of sight.
In the northern sky there are 12 sightlines that pass through the Leo I dwarf galaxy () at impact parameters . High-velocity absorption is detected in this direction at positive velocities in the range to km s-1 (Complex WA), but not near the systemic velocity of the Leo I at km s-1. Thus, there is no evidence for an extended gaseous halo around Leo I that could be detected in the ionization states discussed here, supporting earlier results presented by Bowen et al. (1997) based on low-resolution spectra of three sightlines passing the inner halo of Leo I. The lack of absorption does not necessarily mean a lack of CGM gas around Leo I. Since the stellar metallicity of Leo I is low ( solar; Bosler et al. 2007), the metal content of the CGM might be too small to be detectable in C iv and Si iii within such a small dark matter halo. Alternatively, the gas might be highly ionized and thus invisible in the UV lines traced by COS. In any case, there is no evidence for the presence of cold streams that could feed Leo I with fresh material to form stars. This is not surprising, however, because it is known from HST observations that the star-formation activity in Leo I dropped dramatically Gyr ago (Gallart et al. 1999). Possibly, the lack of cold gas around Leo I and the quenching of star-formation in this dwarf galaxy are related.
In the southern sky, M31 and its companion galaxies are distributed at , all of them having negative radial velocities. Fig. 10 shows that there are seven sightlines that pass M31 within and that show absorption at high negative velocities. The interpretation of blue-shifted absorption along these sightlines is tricky, however, as there are large amounts of gas from the MS at high negative velocities in the general direction of M31. Disentangling these two components (MS and M31) can only be done based on specific assumptions about the kinematics of the M31 CGM and the velocity distribution of MS gas. Lehner et al. (2015; hereafter L15) present a detailed analysis of the COS spectra in the direction of M31. They came to the conclusion that the M31 CGM is visible in the spectra of HS 0058+4213, HS 0033+4300, RX J0048.3+3941, UGC 12163, 3C 66A, MRK 335, PG 0003+158, and NGC 7469 in the LSR velocity range between and km s-1, while material from the MS is seen predominantly at km s-1. Since we are using the same data in our study, the corresponding absorption features associated with the M31 CGM are visible in the velocity plots in Fig. B.2. Assuming that the L15 velocity model for the MS and M31 is correct, the COS data for the above mentioned sightlines indeed suggest that M31 is surrounded by a massive circumgalactic envelope of gas. Additional COS data for QSO sightlines that are located within will help to distentangle gaseous material stemming from the M31 CGM and the MS (AMIGA project; Lehner et al. 2017, in prep.).
There are other, individual sightlines in our COS sample that pass the halos of other LG dwarf/satellite galaxies at (see Fig. 10). The sightline towards Mrk 509 passes Aquarius at , but no absorption is found within km s-1 of the systemic velocity of Aquarius. Similarly, no absorption is found at km s-1 towards the background source NGC 3125, where circumgalactic gas from the nearby () LG galaxies NGC 3109 and Antila would be expected to be seen. The sightline towards PG1011040 passes Sextans A at , but, again, no absorption is found within km s-1 of the systemic velocity of Sextans A. In contrast to the previous cases, absorption is found towards LBQS01070235 at km s-1, a sightline that passes IC 1613 ( km s-1) at . The high-velocity absorption towards LBQS01070235 () is, however, more likely associated with gas from the MS, which shows absorption (and emission) at similar velocities along other sightlines in this general direction of the sky. No firm conclusion about the origin of this (weak) absorption feature and its possible relation to IC 1613 can be made based on this single line of sight.
Summarizing, only for the case of M31 do the COS data provide compelling evidence for the presence of an extended gaseous galaxy halo. For the LG dwarfs/satellites outside the virial radius of the MW there are no hints of a circumgalactic gas component.
5.4 Local Group gas
One important aspect of our study is the search for a possible connection of high-velocity UV absorption with gas bound to the Local Group as a whole, gas far away from individual galaxies. A number of previous studies have suggested that part of the observed UV and X-ray absorption of high ions such as O vi, O vii, and O viii at km s-1 is caused by LG gas outside the virial radius of the Milky Way (e.g., Sembach et al. 2003; Collins, Shull & Giroux 2005; Gupta et al. 2012), gas that may harbor the dominating baryon fraction in the Local Group. A direct proof of this hypothesis would require a reliable distance measurement of the absorbing (ionized) gas in the LG via the bracketing method (e.g., Wakker et al. 2007, 2008), which is extremely challenging due to the lack of suitable background sources.
Absorption-line studies of gas in other galaxy groups, however, do provide compelling evidence for the presence of discrete gas structures in groups outside the virial radii of group member galaxies, structures that give rise to absorption in intermediate and high ions (e.g., Stocke et al. 2014). Yet, the interpretation of individual absorbers in group environments often remains inconclusive (see, e.g., the Dorado group; Richter et al. 2016).
From our absorption-line analysis and the comparison between UV absorption and 21 cm emission we have identified two distinct regions, at in the northern sky and at in the southern sky, for which high-velocity gas with km s-1 has distinct properties:
-
•
both regions contain very little H i, as indicated by the lack of large-scale 21 cm emission (Fig. 8);
-
•
towards these directions the high-velocity O vi absorption is particularly strong (Sembach et al. 2003; Wakker et al. 2003)
-
•
the detected H i 21 cm clumps at have properties that are unusual compared to other HVCs, as they are lacking cold cloud cores and do not show extended diffuse H i emission (see Winkel et al. 2011)
-
•
in the same region, the C iv/Si iii ratio is enhanced compared to other regions, indicating a high degree of ionization (Fig. 7, lower right panel)
-
•
high-velocity gas near and has a very low thermal gas pressure of K cm-3, incompatible with pressures expected in the inner halo of the Milky Way (Wolfire et al. 1995).
As mentioned in Sect. 4.4 these trends provide evidence that the gas at , km s-1 and possibly also the gas , , km s-1 is relatively diffuse and predominantly ionized, possibly residing at large distances from the disk in outer halo or even in the LG (see dicussions in Sembach et al. 1999; 2003; Wakker et al. 2003; Nicastro et al. 2003; Richter et al. 2009; Winkel et al. 2011). Throughout the following, we refer to the absorber regions , km s-1 and , km s-1 as northern ionized region (NIR) and southern ionized region (SIR), respectively.
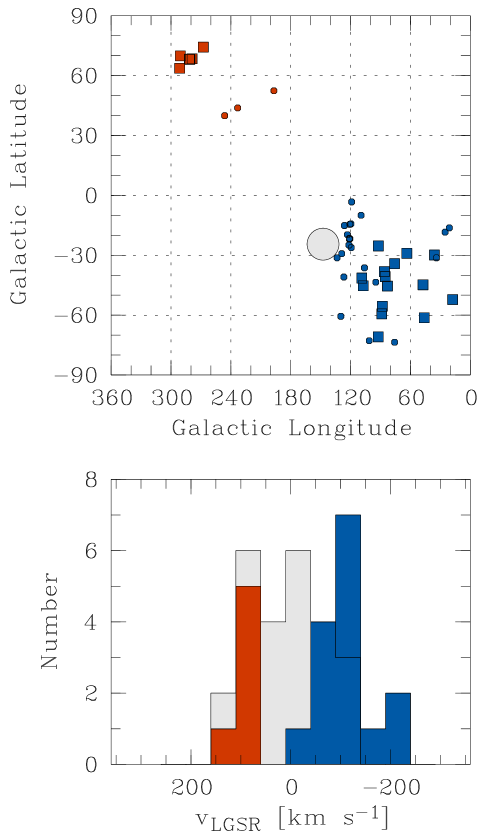
In the northern sky, Complex WA is located at kpc in a () range similar as the one given above, but at lower radial velocities ( km s-1; see Table 3). Thus, the NIR is not associated with Complex WA. The southern region at contains negative-velocity gas from the MS (formally defined for ) and from Complex GCN (; Table 3). In contrast to the MS, origin and distance of Complex GCN are unknown. Therefore, at least some of the detected high-velocity absorption features in the SIR could be located deep in the LG, as there are no observational data that favor a location within the Milky Way halo.
It is striking that the NIR and SIR (together with other nearby high-velocity absorbers) form a velocity dipole on the sky that mimics the one seen for the LG galaxies (Fig. 10). To further emphasize this, we plot in the upper panel of Fig. 11 the sky distribution of all high-velocity absorbers with , , km s-1 and , , km s-1 (filled boxes) together with LG galaxies (filled circles) in the same range.
LG gas that follows the same flow towards the LG barycenter as the galaxies (Sect. 5.3) would show exactly the kind of velocity dipole that is seen in Fig. 11, upper panel. The Milky Way would move faster towards the barycenter than the LG gas that would lag behind in the general anti-barycenter direction, so that positive relative velocities are expected. In the barycenter direction, the Milky Way halo would ram into LG gas that that is at rest at the barycenter or that flows to the barycenter from the opposite side of barycenter (i.e., from the direction of M31 and its large-scale environment), so that it would have high negative velocities. Similar arguments already have been used by Blitz et al. (1999) to model the expected kinematics of an extragalactic HVC population (see also Collins, Shull & Giroux 2005).
In the lower panel of Fig. 11 we show the velocity distribution of the NIR and SIR absorbers after transforming their velocities into the Local Group Standard of Rest (LGSR) velocity frame. In general, the absolute velocity spread in the sample of the absorbers is substantially reduced from km s-1 in the LSR frame to km s-1 in the LGSR frame. Similarly, the standard deviation of the velocity distribution reduces from 260 km s-1 in the LSR velocity frame to 110 km s-1 in the LGSR frame (see also Sembach et al. 2003 and Nicastro et al. 2003 for identical trends in FUSE O vi absorption-line data). In view of the latitude range, this trend can only partly be related to the removal of the Galactic rotation effect in the LGSR frame.
A more detailed interpretation of this plot is difficult, however, without knowing the contribution of the MS to the velocity distribution at high negative velocities. In addition, the overall kinematics of the LG gas is expected to be more complicated than the kinematics of the galaxies because some of the gas is being accreted by the LG galaxies, thus having different directions of motion. The 3D velocity distribution of the gas might also be influenced by ram-pressure forces and large-scale turbulent flows. To critically evaluate the importance of these processes and to investigate whether a simple flow scenario towards the group barycenter is realistic for LG gas around MW and M31, hydrodynamical simulations of the LG and its gaseous environment are required (N14). In Sect. 7 we analyze such simulations to further study the expected large-scale kinematics of gas in the LG.
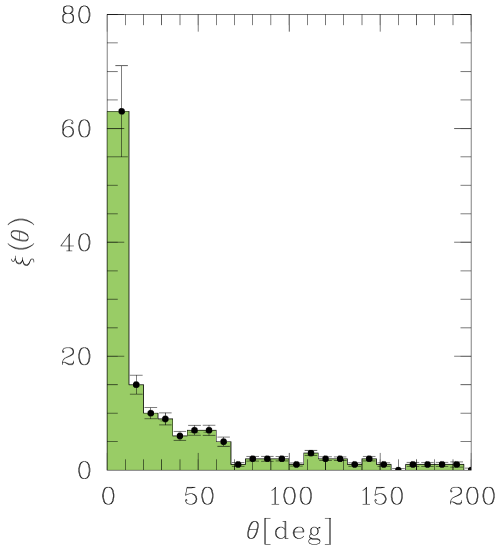
5.5 Spatial clustering and sub-structure
To characterize the amplitude of spatial clustering of HVC absorption components on the sky we analyze the two-point correlation function, , of HVC absorbers, where represents the angular distance between any two sightlines and is the selected velocity bin. We determined in our data set by counting the number of HVC absorption components, , in a given bin along all sightline pairs in our sample and comparing the result to the number of absorbers derived for a random distribution of HVC components, . Using the Davis & Peebles (1983) standard estimator, we can write
| (4) |
The random HVC absorber distribution was calculated from a Monte-Carlo simulation, in which we simulated 100 realizations of random distributions in and along 270 sightlines.
The result of our analysis is shown in Fig. 12, where we plot against for all sightline pairs with . A strong clustering signal is evident for small angular separations , while decreases rapidly for larger angles. Obviously, the high-velocity absorption is caused by coherent gas structures that typically span on the sky (see also Lehner et al. 2012). This result is in line with the visual appearance of typical angular sizes of the 21 cm HVC Complexes displayed in Fig. 8. At a distance of kpc (e.g., Complex C) an angular separation of on the sky corresponds to a linear separation of pc.
The sky distribution of the sightlines shown in Fig. 2 indicates that there are sightline pairs with small angular separations that can be used to study the internal structure of the Milky Way CGM on pc scales by comparing along two adjacent sightlines the absorption depths and velocity centroids of high-velocity absorbers. We have selected 12 sightline pairs in our COS sample with angular separations to identify such differences in the absorption patterns. In Fig. 13 we show three examples of these pairs, where the angular separation between the sightlines is indicated on top of each panel. The first sightline pair in Fig. 13 (RX J0439.65311/HE 04355304) has an angular separation of only . These sightlines trace gas from the MS at high positive velocities. There are significant differences in the absorption depth of all plotted ion transitions, indicating changes in the gas properties on (relatively large) scales of pc if a MS distance of kpc is assumed. The sightlines towards Mrk 380 and RXJ 01745+7408 (Fig. 13, middle panel) are separated by and pass through negative-velocity gas in HVC Complex A at kpc distance (van Woerden et al. 1999; Wakker 2001). Significant differences are seen in the singly-ionized species Si ii and C ii, indicating differences in the gas distribution on scales of pc. The third sightline pair in Fig. 13 (HE 04395254/RX J0439.65311) again shows differences in the absorption properties in the MS on scales of several hundred pc. The full set of these plots is presented in the Appendix in Fig. B.1. In addition, we discuss in the Appendix (Sect. A.3; Fig. A.3) small-scale structure in the equivalent-widths maps of Complex C and Complex WA and previous results on small-scale structure in HVCs.
The observed variations in the UV absorption patterns of HVCs along adjacent sightlines further support the scenario, in which HVCs represent coherent gaseous structures with large-scale kinematics (on kpc scales) and small-scale variations (on pc and sub-pc scales; see Sect. A.3) in physical conditions.
6 Mass estimate of the Milky Way’s CGM
6.1 Total gas columns and ionization fractions
A commonly used approach to study the ionization conditions in individual high-velocity clouds in the Milky Way halo is the use of column density ratios of low, intermediate, and high ions together with Cloudy (Ferland et al. 2013) ionization models (e.g., Richter et al. 2009, 2013; Fox et al. 2013, 2014, 2015; Herenz et al. 2013). Such ionizations models provide useful constraints on the gas densities, ionization parameters, and metal abundances in the gas, but they require accurate information on the column densities of different ions, the velocity-component structure, and the distance of the absorbing gas from the Milky Way disk. The latter aspect is important, because the ionizing radiation field in the Milky Way halo is expected to be anisotropic with contributions from the overall UV background and from stars in the Milky Way disk (see Fox et al. 2005).
Because our COS absorber sample is limited in S/N, spectral resolution, and because model-constraining distance information is available for only a sub-set of the HVC complexes, we refrain from using Cloudy models in this all-sky survey, as these would be afflicted with large systematic uncertainties. Instead, we estimate for each high-velocity absorber a lower limit for the total column density of hydrogen, (HH iH ii), from the column densities of Si (Si ii+Si iii) and C (C ii+C iv) and combine the values for (H) with the neutral gas column densities derived from the 21 cm data (see also Fox et al. 2014). To obtain a limit for (H) we define
| (5) |
and
| (6) |
and consider the larger of the two values for each absorber; in 90 percent, .
In the above equations, (Si/H and (Si/H are the solar abundances of Si and C (Asplund et al. 2009). The parameter denotes the mean metallicity of the gas in solar units. We assume , motivated by the fact that most of the prominent HVCs in the Milky Way halo, such as the MS, Complex C, Complex A, have abundances of percent solar (Wakker et al. 1999; Richter et al. 2001; Sembach et al. 2004; Fox et al. 2013, 2015).
We need to emphasize at this point that the values for (H) and (H) derived in this way reflect only the amount of hydrogen that is traced by Si ii, Si iii, C ii, and C iv. Photoionized and shock-heated H ii at lower gas densities and/or higher gas temperatures that is traced by higher metal ions such as O vi, O vii, and O viii is known to exist in the Milky Way’s CGM as well (Sembach et al. 2003; Wakker et al. 2003; Gupta et al. 2012; Miller et al. 2016), but is not sampled in our data. In addition, because the Si ii, C ii, Si iii absorption is saturated in the strongest absorbers, (H) and (H) are systematically underestimated in these systems. However, (H) and (H) cannot be smaller than (H i) and thus the H i column density measured from the 21 cm data sets the lower limit for the total hydrogen column. Consequently, we adopt as final value (H MAX[(H i), (H),(H)], which represent conservative lower limit for the total hydrogen column density in each absorber.
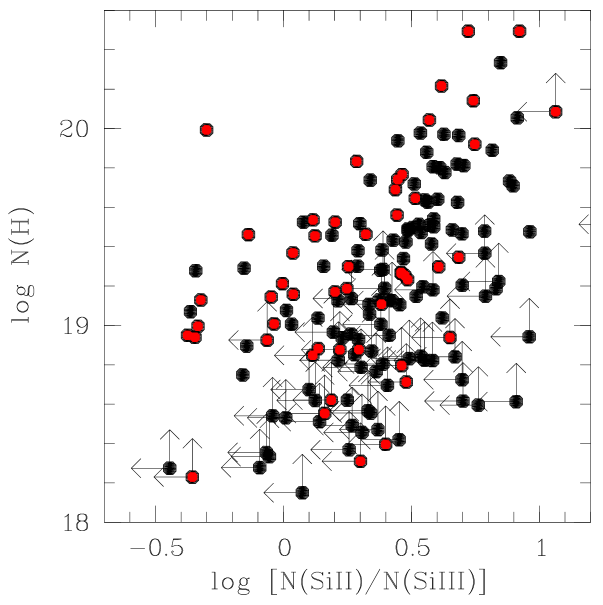
In Fig. 14, we show the total hydrogen column density plotted against the Si ii/Si iii column-density ratio for all 187 high-velocity absorbers, where limits for these parameters are indicated with arrows (red dots indicate values for MS sightlines). Despite the large scatter there is a clear trend of log (H) increasing with increasing Si ii/Si iii ratio. The intrinsic scatter of this distribution would be significantly smaller if the many data points with limits in Si ii/Si iii and H i would be removed. The observed trend implies that high-column density HVCs (which are also seen in H i 21 cm emission) have a smaller mass fraction of diffuse gas (traced by Si iii) than low-column density HVCs, which are predominantly diffuse and ionized. Although Si iii is the most sensitive Si ion to trace diffuse, multi-phase gas in HVCs, the dominating ionization state of Si in our HVC absorber sample (in terms of column density) is Si ii. In our sample, the Si ii column density exceeds that of Si iii for gas columns log (H cm-2, typically.
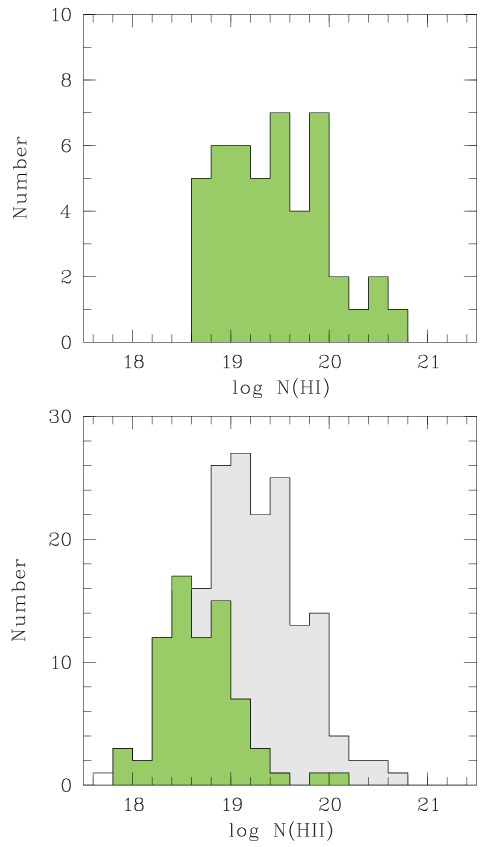
In Fig. 15, upper panel, we show the distribution of the measured 46 neutral hydrogen column densities (log (H i, upper panel) in our HVC sample. The majority (87 percent) of the measured H i column densities lie below cm-2 and for log (H i the distribution shows a decline in the form of a power-law, similar to what has been found in previous H i HVC surveys (see, e.g., Lockman et al. 2002; Wakker 2004). In the lower panel of Fig. 15 we display the distribution of the estimated total hydrogen column densities for all 187 HVC absorbers. Also the total hydrogen column densities predominantly are cm-2 with a median value of log H Because of the observational restrictions in constraining absolute values for (H i) and (H) for our HVC sample, only upper limits for the neutral gas fraction log log (H i)log (H) can be given for most sightlines. Values/limits for log (H i), log (H), and log for each high-velocity absorber in our sample are listed in Table A.4 in the Appendix.
6.2 The total gas masses of HVCs
To estimate the total gas mass of the entire population of Galactic HVCs we assume that HVCs are gas patches that are ellipsoidally/spherically distributed around the Milky Way disk. Let kpc be the fixed radius of the Milky Way H i disk and be the distance of the absorbing structures from the Galactic center. We adopt a spherical distribution of HVCs for and a ellipsoidal distribution for (i.e., in the latter case, the height above the disk is smaller than the disk radius).
For each sphere, the area covered by HVCs at distance then is simply , where is the covering fraction of HVC gas on that sphere. The parameter denotes the correction factor for ellipsoidal symmetry and is defined as with the ellipticity . Based on our observations, we estimate the mean total hydrogen column density, (H), for each HVC Complex listed in Table 3 using the method described in the previous subsection.
In general, (H) is the product of the hydrogen volume density and the absorption path length, (H. In our HVC model, can be regarded as the thickness of the absorbing gas layer. The mass per particle is with as factor that corrects for the presence of helium and heavy elements in the gas. Combining these equations, we obtain an expression for the gas mass of an HVC at radius then in the form
| (7) |
To calculate the total gas mass in each HVC, we adopt the values for and listed in Table 3 and take the median total gas column density, (H in each HVC complex. The total gas mass in the CGM traced by the ions in our survey then is obtained by summing over all (Table 3, column 12).
For the MS (including the LA), for instance, we assume kpc and and from our measurements, together with equations (5) and (6), we obtain . This value is higher than the one estimated by Fox et al. (2014), which is due to larger assumed sky covering fraction of the MS in our study ( vs. ; see Sect. 3.1 in Fox et al. 2014). The total mass of the MS would be even higher, if some of the gas was located at larger distances than the canonical 55 kpc assumed here. In fact, several authors suggested that the bulk of the MS is located at kpc rather than at kpc (Besla, et al. 2012; Jin & Lynden-Bell 2008; Bland-Hawthorn et al. 2013), implying that the MS mass could be as large as .
The contribution of all other HVCs to the total mass is small; their gas mass sums up to a total value of no more than . The total mass of high-velocity gas around the Milky Way thus is clearly dominated by material that stems from the interaction of the Milky Way with the Magellanic Clouds, while the contribution of gas from other origins is negligible ( percent; see also Fox et al. 2014). The total mass of HVCs thus is essentially identical to the estimated mass of the MS, , which is percent of the ISM gas mass in the Galactic disk (; Ferriere 2001). Because in our survey we do not account for the highly-ionized gas phase in HVCs as traced, for instance, by O vi (e.g., Sembach et al. 2003; Fox et al. 2004), our estimates for the HVC masses represent conservative lower limits.
For the calculation of the Milky Way’s gas-accretion rate of high-velocity gas (Table 2, last column) we set
| (8) |
where we assume km s-1 as characteristic value for the infall velocity of the gas and define km s-1) as according scaling parameter. The choice of km s-1 is motivated by the results from hydrodynamical simulations of neutral HVCs infalling into hot, coronal halo gas (Heitsch & Putman 2009; Joung et al. 2012). These studies demonstrate that the bulk of infalling gas clouds have velocities far below the expected ballistic velocities due to the hydrodynamical interaction between the infalling gas and the ambient hot medium. The parameter denotes the fraction of the HVC gas that actually arrives in the Milky Way disk (in whatever form and state). Estimating realistic values for is challenging, as this requires full-fledged hydrodynamical models that describe the passage of neutral and ionized gas through the hot coronal gas of the Milky Way (see again Heitsch & Putman 2009; Joung et al. 2012). We here consider the range as realistic, but carry along this scaling parameter for the following estimates.
The lower limit of the total gas accretion rate from all HVCs listed in Table 3 comes out to yr-1. Here, the MS contributes with yr-1, while the contribution of all other HVCs sums up to yr-1. If much of the MS would be located at kpc (as discussed above) or the infall velocity of the gas would be higher, the gas accretion rate would be increased accordingly. For comparison, the current star-formation rate of the Milky Way is estimated to be SFR(MW) yr-1 (Chomiuk & Povich 2011; Robitaille & Whitney 2010), thus very similar. The infall of gas towards the disk in the form of HVCs thus provides a significant mass flow that is exptected to substantially influence the future star-formation rate of the Milky Way. Because we consider the velocity range km s-1 in our analysis, our calculations do not cover the contribution of low-velocity halo clouds (LVHCs; Peek et al. 2009; Zheng et al. 2015) to the total gas mass in the Milky Way halo and to the global gas accretion rate.
If we re-scale (MS) to previously used, smaller sky-covering fractions of the Stream, our values for and dd are in good agreement with our previous results (Fox et al. 2014) and with estimates from earlier studies (e.g., Putman, Peek & Joung 2012; Richter 2012; Lehner & Howk 2011). We would like to note that these previous estimates are based on other data sets and different model assumptions, so that a direct comparison remains difficult. For a detailed discussion of observational and theoretical studies of the Milky Way’s gas accretion we refer to the review by Richter (2017).
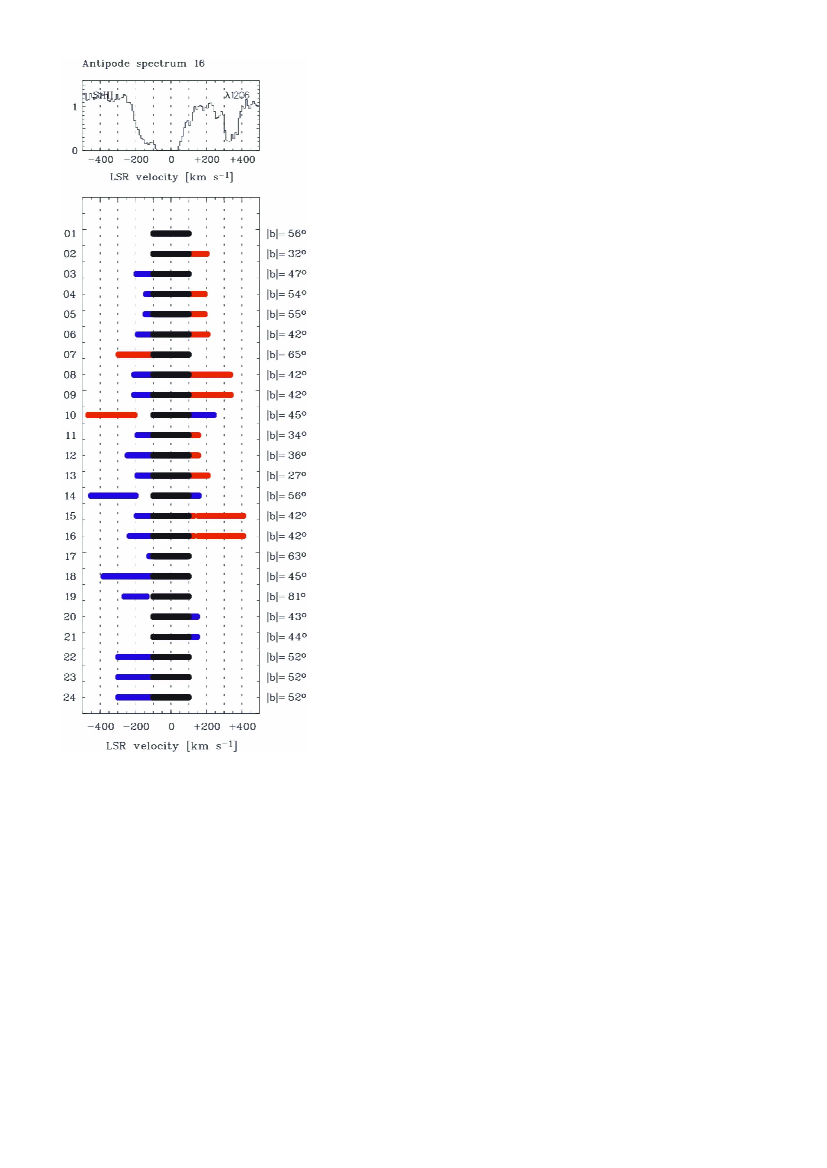
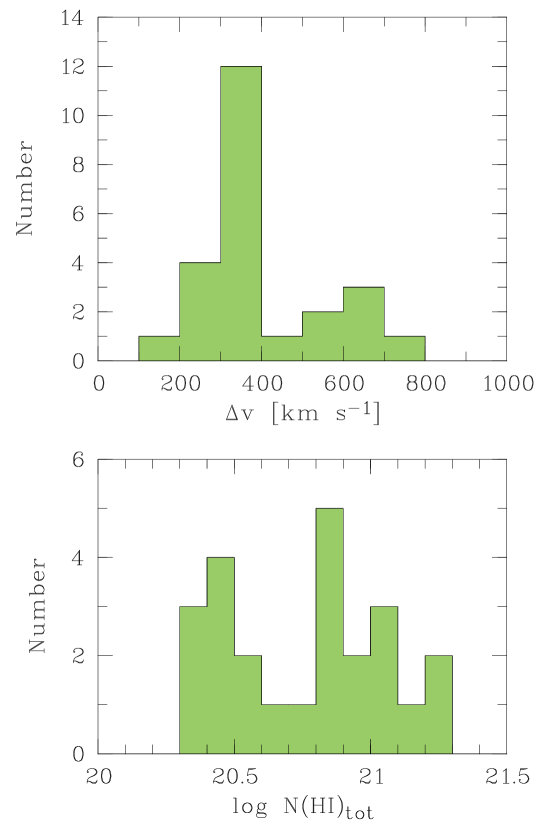
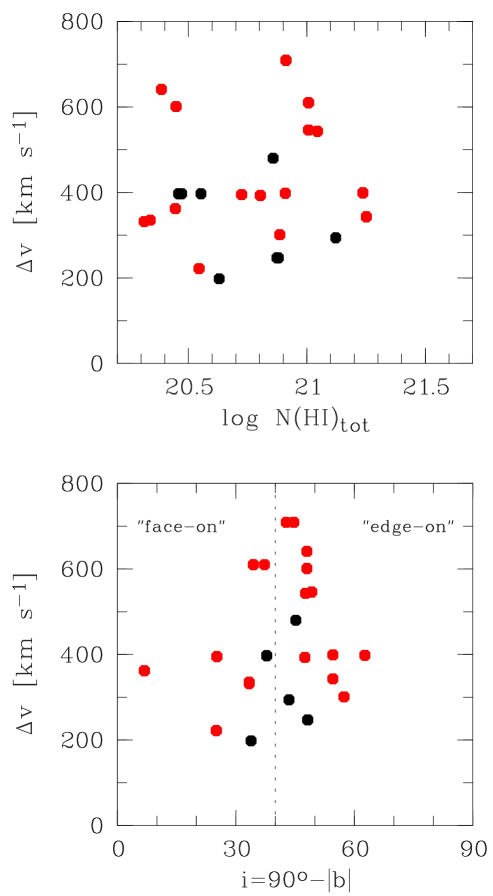
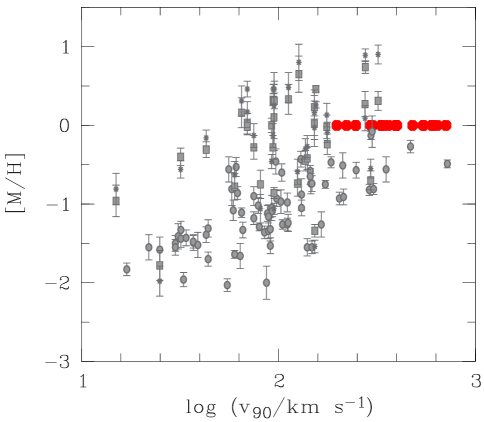
7 The Milky Way’s CGM in a cosmological context
7.1 A search for antipodal sightlines
With 270 more or less randomly distributed sightlines at hand, it is promising to search for sightline pairs in our COS data sample that represent antipodes on the celestial sphere. A systematic study of antipodal sightlines and their spectra allows us to produce composite spectra that reflect the absorption characteristics of complete sightlines through the Milky Way disk and halo environment at the position of the Sun from different external vantage points (see Marggraf & de Boer 2000 for an example towards LMC/M81). Such antipodal composite absorption spectra then can be readily compared with spectra of intervening absorption-line systems, such as Damped Lyman absorbers (DLAs). They provide an idea of how the Milky Way and its gaseous environment would look like if it was seen as a QSO absorption-line system from far away (Herenz et al. 2013).
We consider antipodal sightline pairs in cones with opening angles of in our sample and find 24 such pairs (48 QSO spectra); they are listed in the Appendix in Table A.5. The basic concept of identifying antipodal QSO sightlines at , is illustrated in Fig. A.4. To systematically study the velocity width of disk and halo absorption along the antipodal sightline pairs we combined the COS data for individual antipodal pairs by multiplying the continuum-normalized spectra. In this way, we created composite velocity profiles for for the strongest ion transition, Si iii , in the velocity range to km s-1 (see Fig. 16, upper panel, for an example). For each of the 24 sightline pairs we define the total velocity width of the absorption in the composite spectrum as . In the lower panel of Fig. 16 we show the velocity distribution of Si iii absorption along these 24 antipodal composite profiles (with the contribution of the MS labeled in red). Twenty-three out of the 24 antipodal profiles show halo absorption at either high negative or positive LSR velocities, and in 12 spectra absorption is seen at high positive and negative velocities. The plot illustrates the diversity of the absorption characteristics of the Milky Way disk and halo gas components, if seen from different vantage points.
This diversity is also seen in the upper panel of Fig. 17, where we show the distribution of in a histogram. ranges from 100 to 800 km s-1, while the distribution shows a strong peak at km s-1. The antipodal sightline pairs with the largest values for are those passing the MS (see Fig. 16). This further highlights the importance of the MS for the overall absorption characteristics of the Milky Way as an absorption-line system.
7.2 The Milky Way as a DLA
We combined the kinematic information discussed in the previous section with information on the total H i column densities along the 24 antipodal sightlines to compare in detail the absorption characteristics of Milky Way disk and halo gas with the absorption properties of low-redshift QSO absorbers. In the lower panel of Fig. 17 we show the distribution of total (logarithmic) H i column densities along the 24 antipodal sightlines, as derived from integrating the combined 21 cm profiles. The total column densities vary considerably in a range between log (H i) and with 71 percent of the sightlines having log (H i. This distribution suggests that, from an external vantage point, log (H i) (and thus the absorber type) would strongly depend on the viewing angle. The Milky Way disk and halo gas would be seen either as low-column density DLA (log (H i) or high-column density DLA (log (H i), if the sightline would pass the disk at the position of the Sun at an impact parameter of kpc.
The contribution of halo H i to the total H i column density is generally small. For 71 percent the column-density fraction of halo H i with km s-1 with respect to the total neutral gas column along the antipodal sightline, , is less than 10 per cent. The median value of is . This implies that the total H i column density along the antipodal sightlines is determined predominantly by the intrinsic variations in the neutral gas columns in the Milky Way disk, if seen at different viewing angles. The total velocity spread of the absorption, in contrast, is governed predominantly by the large-scale distribution of Milky Way halo gas components along the different sightlines, which should be independent of the H i disk properties. In fact, we do not find any correlation between and log (H i (Fig. 18, upper panel) in our sample.
Recent studies of strong metal absorbers and their host galaxies suggest that the velocity spread of the absorbing gas is related to the inclination of the galaxy and its absorbing ISM and CGM components with respect to the observer (Nielsen et al. 2015). The general trend in the Nielsen et al. sample is that has a maximum for blue (star-forming) ”face-on” cases (with small values for ), possibly reflecting a kinematic imprint from outflows and winds along the projected minor axis.
To investigate the angular dependence of the absorption characteristics of Milky Way disk and halo gas along the different antipodal sightlines we transformed the absolute latitude into an inclination by using the relation . In this way, sightlines passing through the Galactic poles are regarded as ”face-on” sightlines, while those with small values of are considered as ”edge-on” cases (see Nielsen et al. 2015, their Fig. 1). In Fig. 18, lower panel, we plot the velocity spread (from Si iii ) against for the 24 antipodal sightlines.
The velocity spread has its maximum in the range , extending to very large values above km s-1, while for the ”edge-on” case () and the ”face-on” case () the values for are km s-1. The observed velocity spreads in the Milky Way thus are substantially (by a factor of a few) larger than those presented in Nielsen et al. (2015), who report values for of km s-1. It needs to be kept in mind that the DLAs in the Nielsen et al. sample spans a large range of impact parameters (with typically larger than 8 kpc). They also trace different types of DLA host galaxies that, in general, do not mimic the chemical and kinematic properties of nearby disk gas in the solar neighborhood. The primary origin for the discrepancy between the Milky Way range and that of DLAs is the MS, however. The MS alone spans a LSR velocity range of more than 800 km s-1 along the 24 antipodal sightlines (see Fig. 16).
In general, CGM features that arise from the interaction and merging of (satellite) galaxies presumably dominate the velocity spread of gas around Milky-Way type galaxies, as the velocity dispersion of satellite galaxies is expected to be higher than the gas infall- and outflow velocities. As a result, the kinematic signatures of outflows, winds, and accretion most likely are obscured by those of galaxy mergers. The cross section of merger-related gas streams around the local galaxy population is small, however (Gauthier et al. 2010; Martin et al. 2012), so that the observed large velocity dispersion of the Milky Way CGM is an exception, but not the rule. Possibly existing outflowing gas structures above the Milky Way disk, such as those belonging to the Fermi Bubbles (Fox et al. 2015), thus do not show up as separate features in the / diagram.
Another regularly used diagnostic tool to study strong absorption-line systems is the velocity width/metallicity relation for DLAs. In Fig. 19 we plot the range from the antipodal sightline analysis on the velocity width/metallicity relation presented by Som et al. (2015). For the Milky Way gas, we assume solar metallicities (i.e., [M/H), which is justified because the mean metallicity should be a column-density weighted mean value, so that for the Milky Way (as DLA) it should be close to the value representative for the solar neighborhood. For the Milky Way antipodal sightlines the measured values for range from to km s-1 (see Fig. 17), thus being broadly consistent with values of measured for high-metallicity DLAs. The majority of the MW data points lie, however, at the high end of the distribution for [M/H absorbers, which we again attribute to the fact that large values for in the MW are caused by gas from the MS, i.e., from merger processes, which are believed to be rare in DLA samples. If such a large scatter in was typical for low-redshift galaxies, the individual data points on DLA scaling relations must be interpreted with great caution, as the observed parameters (H i column density, velocity spread) may not reflect at all representative properties of the absorber host galaxy.
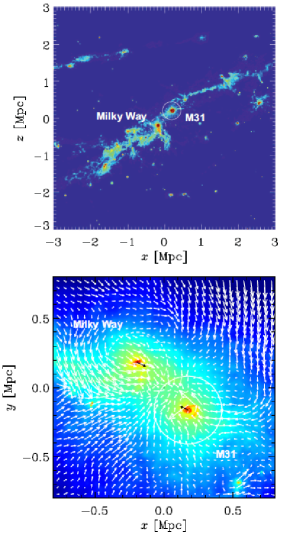
7.3 Comparison with Local Group simulations
Cosmological hydrodynamical simulations predict that group environments within the overall cosmic web are filled with large amounts of diffuse gas whose mass exceeds that of gas inside the galaxies (e.g., Raouf, Khosroshabi & Dariush 2016). In their recent study, N14 have explored the large-scale distribution and overall physical properties of gas in the Local Group based on simulation data from the Constrained Local UniversE Simulations (CLUES) project (www.clues-project.org), which aims at simulating a realistic LG environment including local features and the most prominent surrounding cosmological structures. To evaluate the large-scale properties of LG gas and its possible signatures in FUV absorption-line data we here reanalyze the simulations of N14.
We focus particularly on a side-aspect of the N14 study, namely the spatial distribution of LG gas outside the virial radius of the Milky Way. We also want to explore the kinematics of the LG gas with respect to the space motion of the MW disk and its rotation and compare it with the velocity distribution of the HVCs seen in our COS data.
The initial matter distribution in the CLUES simulations consists of a cubic box of 64 Mpc side length with a high-resolution spherical region of 2 Mpc radius located at its center. The masses of the gas and dark matter particles inside the high-resolution region are and , respectively. Further details on the setup and realization of the CLUES simulations as well as a detailed description of the overall results from that simulation can be found in N14 and references therein. Note that the following results are specific to the CLUES simulations and their cosmological representation of the LG. It would need to be tested whether they could be reproduced using different simulations with different initial conditions and physical recipes.
In the upper panel of Fig. 20 we show the spatial distribution of neutral hydrogen (H i at K) in the large-scale environment of the LG at . The gas distribution is relatively patchy and forms a bar-like structure that follows closely the elongated shape of the cosmological filament that hosts the LG. Milky Way and M31 (white circles denoting their virial radii) reside in the center of this structure. Obviously, there are substantial amounts of diffuse warm gas outside the virial radii of MW and M31 that potentially could give rise to UV absorption if seen from the MW disk.
To display the large-scale kinematics of the gas around MW and M31 we show in the lower panel of Fig. 20 the velocity vectors (with respect to the LG barycenter) of the simulated gas particles (white arrows) and the two galaxies (black arrows) in the plane. The galaxies move towards the LG barycenter while the ambient gas is circulating around MW and M31 in a complex pattern of infall- and outflow channels. Because of the complex gas motions, the velocity components in the direction of the LG barycenter are smaller for the gas particles than for the two galaxies. As a result, there is a systematic net-motion of both galaxies towards the LG barycenter with respect to the ambient LG gas: MW and M31 are ramming into LG gas that lies in-between them near the LG barycenter, while they are moving away from gas that lies behind them in the opposite direction in the outer regions of the LG filament.
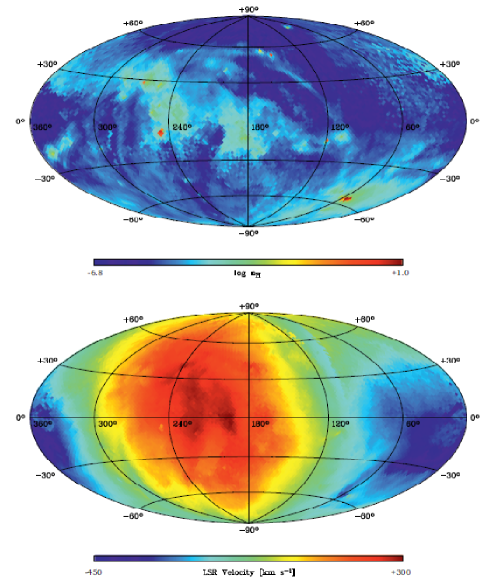
To predict the velocities of UV absorption based on this simulation we take into account the rotational motion of the MW disk. We assume that the simulated MW disk has a circular orbit speed at the position of the Sun of km s-1, as recently derived by Reid et al. (2014). Taking all this spatial and kinematic information into account we prepared maps for the sky distribution of the LG gas from the simulation in a similar way as we prepared the maps for the observational data. In the upper panel of Fig. 21 we show the density map of LG gas outside the MW virial radius. The bar-like gaseous LG filament (see Fig. 20, upper panel) reaches from the general M31 direction (in the simulation: roughly to its antipole on the sky (see also N14). In the lower panel, we plot the expected radial LSR velocity of the LG gas as a function of including the effect of Galactic rotation. A dipole pattern is clearly visible. Only at low latitudes () is Galactic rotation relevant for km s-1. The observed velocity dipole for gas at higher (absolute) latitudes and velocities instead is a result of the relative motion of the Milky Way with respect to the surrounding gas in the direction of the LG barycenter. From the combination of the velocity and density information in the two panels in Fig. 21 follows that LG gas at , if it were cold and dense enough to be observed in UV absorption, would imprint a dipole absorption pattern on the sky, with redshifted high-velocity absorption ( km s-1) at and blue-shifted high-velocity absorption ( km s-1) at .
As discussed earlier, such a dipole is indeed seen in our COS survey (NIR, SIR; Sect. 5.4; Figs. 2,8,11). It also has been recognized in our previous O vi survey (Sembach et al. 2003; Wakker et al 2003) and other studies of intermediate and high ions (e.g., Collins, Shull & Giroux 2005). A definite answer, whether the observed dipole-absorption features are indeed related to LG gas yet cannot be given here, because the MS similarly imprints an emission/absorption dipole pattern on the sky, as evident from Fig. 8. Since a reliable distance determination of this gas appears to be out of reach, a precise measurement of its chemical composition (in comparison with abundances found in the MS) might shed light on its origin.
In summary, the CLUES simulations support (but do not require) the idea that some of the observed absorbers in the NIR and SIR represent ionized LG gas beyond the virial radius of the Milky Way that follows the large-scale flow of matter in the LG.
8 Conclusions
In this paper, we present the largest available survey of UV absorption in Galactic HVCs in the velocity range km s-1, tracing the extended gaseous halo and CGM of the Milky Way and gas in the Local Group. Our survey is based on the analysis of various lines from the metal ions Si ii, Si iii, C ii, and C iv in 270 spectra of extragalactic UV background sources observed with HST/COS. We supplement our COS spectra with H i 21 cm data from GASS and EBHIS, as well as with data from constrained cosmological simulations from the CLUES project. We update previous results from smaller HVC surveys (e.g., Lehner et al. 2012; Herenz et al. 2013) concerning the HVC’s sky distribution, their internal structure, their ionization properties, and estimate the total HVC mass and accretion rate. Based on our excellent database, we further present several new results on HVC aspects that have not yet been studied before. We analyze the angular two-point correlation function of HVC absorption and analyze small-scale variations in the UV absorption patterns. We further investigate the relation between high-velocity UV absorption and gas in other LG galaxies and the LG’s intragroup medium. We systematically compare the UV absorption characteristics of Milky Way disk and halo gas along antipodal sightlines with those of low-redshift DLAs. Finally, we discuss the role of HVCs in a cosmological context by comparing the observed gas properties with those seen in constrained simulations of the LG.
We summarize the main results of our study as follows:
(1) Sky-covering fraction of HVCs.
The overall all-sky covering fraction of high-velocity absorption
in our survey is percent, as derived from the analysis of the most
sensitive ion, Si iii for Si iii. For the other three ions
we obtain covering fractions of
Si ii percent for Si ii,
C ii percent for C ii, and
C iv percent C iv.
The Si iii detection rate is
times higher than that for H i for
log (H i along the same sightlines,
as estimated from the
complementary 21 cm data from GASS and EBHIS. Most of the detected high-velocity
absorbers can be kinematically attributed to known H i 21 cm gas complexes,
such as the MS, Complex C, Complex A, and others. This implies that
the large cross section of high-velocity UV absorption is mostly due to the
the ionized envelopes of the neutral HVC cores.
The overall HVC absorption fraction is systematically lower in the northern sky than
in the southern hemisphere
(e.g., Si iii in the north vs.
Si iii in the south). We attribute this asymmetry to the widespread presence
of diffuse (predominantly ionized) gas from the MS at negative radial velocities
that covers a significant
fraction of the sky at . We identify two
antipodal regions at in the northern
sky (northern ionized region, NIR) and at
in the south (southern ionized region, SIR) that show prominent UV absorption at very
high (absolute) radial velocities ( km s-1), but with
only very little H i 21 cm emission.
(2) The multi-phase nature of HVCs.
The simultaneous detection of Si ii, Si iii, C ii,
C iv, and H i in many high-velocity absorption components implies the
presence of multiple gas phases (from neutral to highly ionized gas) in the CGM
along each sightline.
The substantially higher covering fraction of high-velocity UV absorption
compared to high-velocity H i 21 cm emission demonstrates that hydrogen is
predominantly ionized in these structures. Many regions that exhibit high-velocity UV absorption
without corresponding 21 cm emission represent the ionized outer layers of nearby
neutral HVC complexes, as indicated by the same large-scale kinematics. From the
observed spatial and kinematic variations of the column-density ratios
Si ii/Si iii, C ii/Si iii, and
C iv/Si iii follows that there is substantially more ionized
gas at high negative radial velocities than at high positive velocities. Again, this trend is
related to diffuse gas associated with the MS. Particularly high
C iv/Si iii are found in the NIR and SIR, indicating that
these regions contain mostly diffuse, ionized gas.
(3) Spatial clustering of HVCs and their internal structure.
We analyze the angular distribution of high-velocity absorption
by constructing the two-point correlation function, ,
for HVC components in our QSO sample. We find that
exhibits a strong clustering signal for angular separations of
, while drops quickly for larger
angles. From the analysis of 12 sightline pairs with small angular separations
(down to ) we find significant variations
in the equivalent widths of high-velocity features, while
the overall velocity structure in the HVC absorption patterns
remains mostly unchanged at the spectral resolution of COS.
For typical HVC distances in the range kpc these findings
indicate that high-velocity absorbers in the Milky Way halo
represent coherent gas structures on scales of a few up to
a few hundred kpc that follow a large-scale kinematics and that
exhibit internal variations in gas density/physical conditions
on pc scales.
(4) Relation between HVCs and other LG galaxies.
We systematically investigate sightlines that pass the outskirts of
several Local Group galaxies outside the virial radius of the
MW to search for absorption signatures
that might be related to the CGM of these galaxies.
Along seven sightlines, high-velocity absorption from extended
halo gas around M31 most likely is present in the
LSR velocity range between and km s-1,
in line with the findings recently presented by Lehner et al. (2015).
No CGM absorption is found at impact parameters
and velocities close to the systemic galaxy velocities for
NGC 3109, Antila, Sextans A, Aquarius (one sightline per galaxy, respectively),
and Leo I (12 sightlines). Absorption is found in a sightline passing
IC 1613 at near the systemic velocity of
IC 1613, but this absorption most likely is associated with gas
from the MS.
Therefore, only for M31 and the Milky Way the COS data provides
compelling evidence for the presence of an extended CGM,
while for the LG dwarfs/satellites there are no hints for a
circumgalactic gas component.
(5) Local Group gas.
We further investigate the distinct gas properties and kinematics of the
NIR and SIR (see definition above) by relating
the observed HVC absorption characteristics
in these regions with the kinematics of LG galaxies and with predictions from
hydrodynamical simulations of LG gas. The NIR and SIR, for which no distance
information are available, form a dipole on the
sky with opposite signs for the observed absorption velocities. Because of
the observed high radial velocities and the high absolute Galactic latitudes of
these antipodal regions, the observed dipole pattern cannot be produced by the
rotation of the Galactic disk. We show that the galaxies outside the virial radius
of the Milky Way form a similar dipole-velocity pattern on the sky, which reflects
the general flow of galaxies in the LG towards the LG barycenter, the Milky
Way being part of that flow. Using constrained cosmological
simulations of the LG and its gaseous environment from the CLUES project
(N14) we further demonstrate that LG gas, that circulates around
LG member galaxies within the overall matter flow, is indeed expected to form a
dipole-velocity pattern that matches well the observed one for the NIR/SIR.
This, together with the well-established presence of high-velocity
O vi in these directions at similar high radial velocities
(Sembach et al. 2003; Wakker et al. 2003), leads us to speculate that
the NIR and the SIR traces LG gas that follows the large-scale kinematics
of matter in the cosmological filament that forms the LG.
(6) Total mass and infall rate of HVCs.
From the observed ion covering fractions, previously measured HVC distances
and metallicities as well as the measured total Si and C column
densities in HVCs we estimate a total gas mass of the Milky Way’s HVCs of
. This is percent
of the ISM gas mass in the Galactic disk.
We find that the total gas accretion rate in the form of
neutral and ionized HVCs is yr-1.
The MS, here assumed
to be located at a distance of kpc, dominates
the total HVC mass and gas-accretion rate by far, while all other
HVCs contribute with only percent.
If much of the MS would be located at distances kpc
the gas accretion rate would be even higher by a factor of .
The infall of HVCs from the halo to the disk thus represents
a significant mass inflow that may substantially
influence the future star-formation rate in the Milky Way.
(7) The Milky Way as a DLA.
From our data set we identify 24 sightline-pairs with antipodal directions
within . We create composite spectra for these antipodal sightlines
to study the integrated absorption characteristics of the Milky Way disk and halo gas
from different vantage points and compare the results with recent studies
of QSO absorption-line systems.
The total column densities along the 24 antipodal sightlines show a substantial scatter,
ranging from log (H i) to , with 71 percent of the sightlines having
log (H i. Thus, the Milky Way disk and halo gas (at the position
of the Sun) would be seen as a DLA from an external vantage point, with a total
gas column that depends (non-systematically) on the viewing angle.
We find that also the total velocity width, , of Si iii absorption in
the various disk and halo absorption
components shows a huge spread along the 24 antipodal directions.
varies from to km s-1 and the
distribution shows a peak at km s-1.
With such large velocity spreads, the Milky Way disk/halo gas
lies at the extreme end of the distribution of low-
DLAs, but still fits to the general velocity-width vs. metallicity relation for
DLAs and sub-DLAs (Som et al. 2015).
The dominant contribution to the large velocity spread of Milky Way gas comes from
the MS, again indicating the dominant role of the Stream for the Milky Way’s
CGM absorption properties.
Since the cosmological cross section of merger-related gas streams
around galaxies is small, the MW thus would represent an a-typical DLA if
seen from far away.
Acknowledgements.
This research used the facilities of the Canadian Astronomy Data Centre operated by the National Research Council of Canada with the support of the Canadian Space Agency. Based on observations obtained with the NASA/ESA Hubble Space Telescope, which is operated by the Space Telescope Science Institute (STScI) for the Association of Universities for Research in Astronomy, Inc., under NASA contract NAS5D26555. S. E. N. acknowledges support from the Deutsche Forschungsgemeinschaft (DFG) under the grant NU 332/21. Support was provided by NASA through grants HST-GO-12604.01-A (Wakker), HST-GO-13448.01-A (Wakker), HST-GO-13840.05-A (Wakker), HST-GO-12982 (Lehner), HST-AR-12854 (Lehner), and HST-AR-12846.001 (Charlton) from the Space Telescope Science Institute, which is operated by the Association of Universities for Research in Astronomy, Incorporated, under NASA contract NAS5-26555. We thank an anonymous referee for helpful comments and suggestions.References
- (1) Asplund, M., Grevesse, N., Sauval, A.J., & Scott, P. 2009, ARA&A, 47, 481
- (2) Barger, K.A., Lehnerm, N., & Howk, J.C. 2016, ApJ, 817, 91
- (3) Ben Bekhti, N., Richter, P., Westmeier, T., & Murphy, M.T. 2008, A&A, 487, 583
- (4) Ben Bekhti, N., Winkel, B., Richter, P., et al. 2012, A&A, 542, A110
- (5) Besla, G., Kallivayalil, N., Hernquist, L., et al. 2012, MNRAS, 421, 210
- (6) Bland-Hawthorn, J., Maloney, P., Sutherland, R. S., & Madsen, G. J. 2013, ApJ,778, 58
- (7) Blitz, L., Spergel, D.N., Teuben, P.J., Hartmann, D., & Burton, W.B. 1999, ApJ, 514, 818
- (8) Bluhm, H., de Boer, K.S., Marggraf, O., & Richter, P. 2001, A&A, 367, 299
- (9) Bosler, T.L., Smecker-Hane, T.A., Stetson, P.B. 2007, MNRAS, 378, 318
- (10) Bowen, D.V., Tolstoy, E., Ferrara, A., Blades, J.C., & Brinks, E. 1997, ApJ, 478, 530
- (11) Cen, R. 2013, ApJ, 770, 139
- (12) Chomiuk, L. & Povich, M.S. 2011, AJ, 142, 197
- (13) Collins, J.A., Shull, J.M., & Giroux, M.L. 2005, ApJ, 623, 196
- (14) Collins, J.A., Shull, J.M., & Giroux, M.L. 2009, ApJ, 705, 962
- (15) Danforth, C.W., Howk, J.C., Fullerton, A.W., Blair, W.P., & Sembach, K.R. 2002, ApJS, 139, 81
- (16) Davis, M., & Peebles, P.J.E. 1983, ApJ, 267, 465
- (17) de Avillez, M.A. & Breitschwerdt, D. 2007, ApJ, 665, L35
- (18) de Boer, K.S. & Savage, B.D. 1980, ApJ, 238, 86
- (19) Debes, J., et al. 2016, Cosmic Origins Spectrograph Instrument Handbook, Version 8.0 (Baltimore, MD: STScI)
- (20) Dehnen, W., McLaughlin, D.E.,& Sachania, J. 2006, MNRAS, 369, 1688
- (21) Dickey, J.M. & Lockman, F.J. 1990, ARA&A, 28, 215
- (22) Dieter, N. H. 1971, A&A, 12, 59
- (23) D’Onghia, E. & Fox, A.J. 2016, ARA&A, 54, 363
- (24) Ferriere, K. 2001, RvMP, 73, 103
- (25) Fontana, A., & Ballester, P. 1995, ESO Messenger, 80, 37
- (26) Fox, A.J., Wakker, B.P.; Savage, B.D., et al. 2005, ApJ, 630, 332
- (27) Fox, A.J., Savage, B.D., & Wakker, B.P. 2006, ApJS, 165, 229
- (28) Fox, A.J., Wakker, B.P., Smoker, J.V., et al. 2010, ApJ, 718, 1046
- (29) Fox, A.J., Richter, P., Wakker, B.P., et al. 2013, ApJ, 772, 110
- (30) Fox, A.J., Wakker, B.P., Barger, A., et al. 2014, ApJ, 787, 147
- (31) Fox, A.J., Bordoloi, R., Savage, B.D., et al. 2015, ApJ, 799, L7
- (32) Gallart, C., Freedman, W.L., Aparicio, A., Bertelli, G., & Chiosi, C. 1999, AJ, 118, 2245
- (33) Gauthier, J.-R., Chen, H.-W., & Tinker, J.L. 2010, ApJ, 716, 1263
- (34) Green, J.C., Froning, C.S., Osterman, S., et al. 2012, ApJ, 744, 60
- (35) Gupta, A., Mathur, S., Krongold, Y., Nicastro, F., & Galeazzi, M. 2012, ApJL, 756, L8
- (36) Haardt, F., & Madau, P. 2012, ApJ, 746, 125
- (37) Herenz, P., Richter, P., Charlton, J.C., & Masiero, J.R. 2013, A&A, 550, A87
- (38) Heitsch, F., & Putman, M. E. 2009, ApJ, 698, 1485
- (39) Howk, J.C.,& Consglio, S.M. 2012, ApJ, 759, 97
- (40) Jin, S. & Lynden-Bell, D. 2008, MNRAS, 383, 1686
- (41) Joung, M.R., Putman, M.E., Bryan, G.L., Fernandez, X., & Peek, J.E.G. 2012, ApJ, 759, 137
- (42) Kalberla, P.M.W., Burton, W.B., Hartmann, D., et al. 2005, A&A, 440, 775
- (43) Kalberla, P.M.W., McClure-Griffiths, N.M., Pisano, D.J., et al. 2010, A&A, 521, 17
- (44) Keeney, B.A., Danforth, C.W., Stocke, J.T., et al. 2006, ApJ, 646, 951
- (45) Kerp, J., Burton, W.B., Egger, R., et al. 1999, A&A, 342, 213
- (46) Kerp, J., Winkel, B., Ben Bekhti, N., Floer, L., & Kalberla, P.M.W. 2011, AN, 332, 637
- (47) Kollmeier, J.A., Weinberg, D.H., Oppenheimer, B.D., et al. 2014, ApJ, 789, L32
- (48) Lehner, N., & Howk, J.C. 2007, MNRAS, 377, 687
- (49) Lehner, N., & Howk, J.C. 2010, ApJ, 709, 138
- (50) Lehner, N., & Howk, J.C. 2011, Sci, 334, 955
- (51) Lehner, N., Howk, J.C., Thom, C., et al. 2012, MNRAS, 424, 2896
- (52) Lehner, N., Howk, J.C., Tripp, T.M., et al. 2013, ApJ, 770, 138
- (53) Lehner, N., Howk, J.C., & Wakker, B.P. 2015, ApJ, 804, 79
- (54) Liang, C.J., & Chen, H.-W. 2014, MNRAS, 445, 2061
- (55) Lockman, F.J., Murphy, E.M., Petty-Powell, S., & Urick, V.J. 2002, ApJS, 140, 331
- (56) Marggraf, O. & de Boer, K.S. 2000, A&A, 363, 733
- (57) Martin, C.L., Shapley, A.E., Coil, A. 2012, ApJ, 760, 127
- (58) Mathewson, D.S., Cleary, M.N., & Murray, J.D. 1974, ApJ, 190, 291
- (59) McClure-Griffiths, N.M., Pisano, D.J., Calabretta, M.R., et al. 2009, ApJS, 181, 398
- (60) McMillan, P.J. 2011, MNRAS, 414, 2446
- (61) Miller, M.J. & Bregman, J.N. 2015, ApJ, 800, 14
- (62) Miller, M.J., Kluck, E.J. & Bregman, J.N. 2016, ApJ, 818, 112
- (63) Morton, D.C. 2003, ApJS, 149, 205
- (64) Murray, C.E., Stanimirovicz, S., McClure-Griffithsm N.M., et al. 2015, ApJ, 808, 41
- (65) Nicastro, F.,Zezas, A., Elvis, M., et al. 2003, Nature, 421, 719
- (66) Nielsen, N.M., Churchill, C.W., Charlron. J.C., et al. 2015, ApJ, 811, 132
- (67) Nuza, S.E., Parisi, F., & Scannapieco, C., et al. 2014, MNRAS, 441, 2593
- (68) Peebles, P.J.E., Phelps, S.D., Shaya, E.J., & Tully, R.B. 2001, ApJ, 554, 104
- (69) Peebles, P.J.E., Tully, R.B., & Shaya, E.J. 2011, arXiv:1105.5596
- (70) Prochaska, J.X. 2017, Astronomy & Computing, in press; arXiv:1703.04695
- (71) Putman, M.E., Staveley-Smith, L., Freeman, K.C., Gibson, B.K., & Barnes, D.G. 2003, ApJ, 586, 170
- (72) Putman, M.E., Peek, J.E.G., & Joung, M.R. 2012, ARA&A, 50, 491
- (73) Rao, S.M., Sardane, G., Turnshek, D.A. 2013, MNRAS, 432, 866
- (74) Raouf, M., Khosroshabi, H.G., & Dariush A.A. 2016, ApJ, in press
- (75) Reid, M.J., Menten, K.M., Brunthaler, A., et al. 2014, ApJ, 783, 130
- (76) Richter, P., de Boer, K.S., Bomans, D.J., et al. 1999, Nature, 402, 386
- (77) Richter, P., Sembach, K.R., Wakker, B.P., & Savage, B.D. 2001a, ApJ, 562, L181
- (78) Richter, P., Savage, B.D., Wakker, B.P., Sembach, K.R., Kalberla, P.M.W. 2001b, ApJ, 549, 281
- (79) Richter, P. 2006, RvMA 19, 31
- (80) Richter, P., Charlton, J.C., Fangano, A.P.M., Ben Bekhti, N., & Masiero, J.R. 2009, ApJ, 695, 1631
- (81) Richter, P., Krause, F., Fechner, C., Charlton, J.C., & Murphy, M.T. 2011, A&A, 528, A12
- (82) Richter, P. 2012, ApJ, 750, 165
- (83) Richter, P., Fox, A. J., Wakker, B. P., et al. 2013, ApJ, 772, 111
- (84) Richter, P., Fox., A.J., Ben Bekhti, N., Murphy, M.T., Bomans, D., & Frank, S. 2014, AN, 335, 92
- (85) Richter, P., Wakker, B.P., Fechner, C., et al. 2016, A&A, 590, A68
- (86) Richter, P. 2017, in: Gas Accretion onto Galaxies, Astrophysics and Space Science Library, eds. A. J. Fox & R. Davé (Springer), 15
- (87) Robitaille, T.P. & and Whitney, B.A. 2010, ApJ, 710, L11
- (88) Ryans, R.S.I., Keenan, F.P., Sembach, K.R., & Davies, R.D 1997, MNRAS, 289, 986
- (89) Savage, B.D., & Sembach, K.R. 1991, ApJ, 379, 245
- (90) Sembach, K.R., Howk, J.C., Savage, B.D., & Shull, J.M. 2001, AJ, 121, 992
- (91) Sembach, K.R., Wakker, B.P., Savage, B.D., Richter, P., et al. 2003, ApJS, 146, 165
- (92) Sembach, K.R., Wakker, B.P., Tripp, T.M. 2004, ApJS, 150, 387
- (93) Shull, J.M., Jones, J.R., Danforth, C.W., & Collins, J.A. 2009, 699, 754
- (94) Shull, J.M. 2014, ApJ, 784, 142
- (95) Som, D., Kulkarni, V.P., Meiring, J., et al. 2015, ApJ, 806, 25
- (96) Stocke, J.T., Keeney, B.A., Danforth, C.W., et al. 2013, ApJ, 763, 148
- (97) Stocke, J.T., Keeney, B.A., Danforth, C.W., et al. 2014, ApJ, 791, 128
- (98) Thom, C., Putman, M. E., Gibson, B. K., et al. 2006, ApJ, 638, L97
- (99) Thom, C., Peek, J. E. G., Putman, M. E., et al. 2008, ApJ, 684, 364
- (100) Trenti, M., Stiavelli, M., Bouwens, J.R., et al. 2010, ApJ, 714, L202
- (101) Tripp, T.M., Wakker, B.P., Jenkins, E.B., et al. 2003, AJ, 125, 3122
- (102) Tumlinson, J., Shull, J.M., Rachford, B.L., et al. 2002, ApJ, 566, 857
- (103) Tumlinson, J., Thom, C., Werk, J.K., et al. 2013, ApJ, 777, 59
- (104) Wakker, B.P. & van Woerden, H. 1998, ARA&A, 35, 217
- (105) Wakker, B.P., Howk, J.C., Savage, B.D. 1999, Nature, 402, 388
- (106) Wakker, B.P. 2001, ApJS, 136, 463
- (107) Wakker, B.P., Ooserloo, T., & Putman, M.E, 2002, AJ, 123, 1953
- (108) Wakker, B.P., Savage, B.D., Sembach, K.R., et al. 2003, ApJS, 146, 1
- (109) Wakker, B.P. 2004, in High Velocity Clouds, ed. H. van Woerden, B.P.Wakker, U.J. Schwarz, & K.S. de Boer (Dordrecht: Kluwer), 25
- (110) Wakker, B. P., York, D. G., Howk, J. C., et al. 2007, ApJ, 670, L113
- (111) Wakker, B. P., York, D. G., Wilhelm, R., et al. 2008, ApJ, 672, 298
- (112) Wakker, B.P., Hernandez, A.K., French, D.M., et al. 2015, ApJ, 814, 40
- (113) Werk, J.K., Prochaska, J.X., Thom, C., et al. 2013, ApJS, 204, 17
- (114) Whiting, A.B. 2014, ApJ, 793, 63
- (115) Winkel, B., Kalberla, P.M.W., Kerp, J., & Flöer, L. 2010, ApJS, 188, 488
- (116) Winkel, B., Ben Bekhti, N., Darmstädter, V., Flöer, L., Kerp, J. & Richter, P. 2011, A&A, 533, A105
- (117) Wolfe, A.M. & Prochaska, J.X. 1998, ApJ, 494, L15
- (118) Wolfire, M.G., McKee, C.F., Hollenbach, D., & Tielens, A.G.G.M. 1995, ApJ, 453, 673
- (119) Wannier, P., & Wrixon, G.T. 1972, ApJL, 173, L119
- (120) van Woerden, H., Schwarz, U.J., Peletier, R.F., Wakker, B.P., & Kalberla, P.M.W. 1999, Nature, 400, 138
- (121) Zech, W., Lehner, N., Howk, J.C., Dixon, W., & Brown, T. 2008, ApJ, 679, 460
- (122) Zheng, Y., Putman, M.E., Peek, J.E.G., & Joung, M.R. 2015, ApJ, 807, 103
Appendix A Supplementrary discussions, tables and figures
A.1 Absorption fraction without MS contribution
To investigate the role of the MS in the velocity-dependent absorption fraction (Fig. 5) we show in Fig. A.1 the absorption fraction of Si iii (red), Si ii (blue), Si ii (green), and C iv (orange) as a function of LSR velocity excluding the regions covered by the MS (see Table 3). By doing this, the asymmetry between negative and positive velocities (Fig. 5) is reduced, with now almost similar absorption fractions in Si iii on both sides of the distribution. This trend demonstrates that the MS and its environment contribute substantially to the absorption fraction of the CGM at high negative velocites.
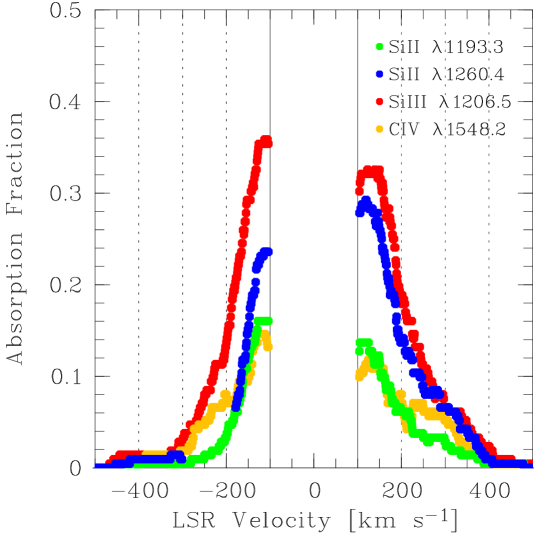
A.2 Equivalent-width/column-density ratios vs. LSR velocity
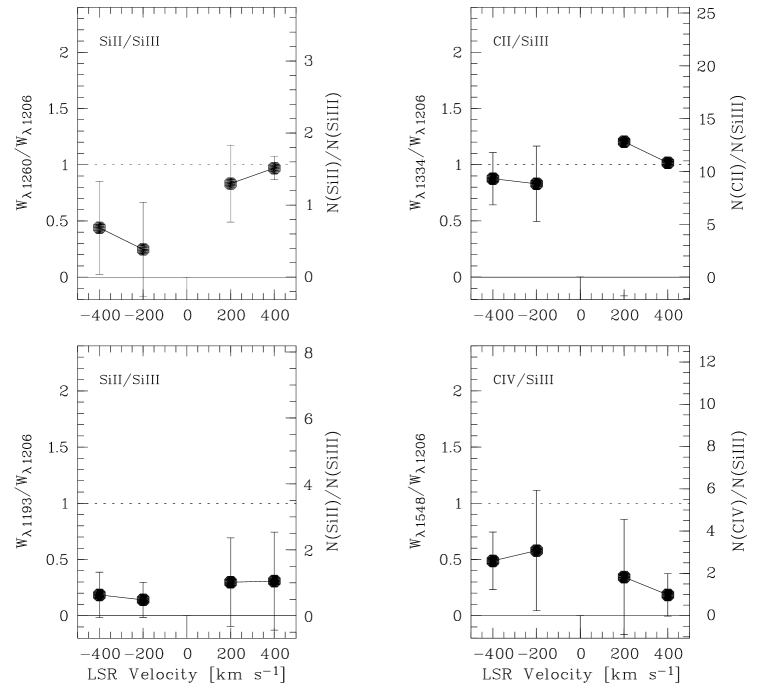
In Fig. A.2 we show the distribution of the same equivalent-width/column-density ratios as presented in Sect. 4.2, but now as a function of LSR velocity. For this plot we have averaged the equivalent-width ratios over the entire sky in velocity bins of km s-1. What can be seen here is that the ratio Si ii /Si iii is small at negative velocities, in particular for km s-1. In the same velocity bin the C iv /Si iii ratio has its maximum, indicating that gas at high negative radial velocities has, on average, a substantially higher degree of ionization than gas at any other (high) radial velocity. Since most of extreme negative velocity absorbers are found in the region, , (see Sect. 4.2), the trends seen in Fig. A.2 are not surprising: they further demonstrate the distinct properties of negative-velocity gas in this direction. In addition, it can be concluded from Fig. A.2 that the average degree of ionization, as indicated by the above listed equivalent-width/column-density ratios, is higher for CGM gas that moves towards the Sun than for gas that moves away from it.
A.3 Small-scale structure in HVCs
As can be seen in Fig. 2, there are two regions in the sky where the projected density of background sources is particularly high: , (tracing Complex C at kpc) and , (tracing Complex WA at kpc; Table 3). For these regions/complexes, we constructed equivalent-width maps for the Si ii line, as shown in Fig. A.3. On small angular scales () the equivalent widths vary by factors , indicating spatial variations in the column densities of Si ii on linear scales of kpc (Complex C) and kpc (Complex WA).
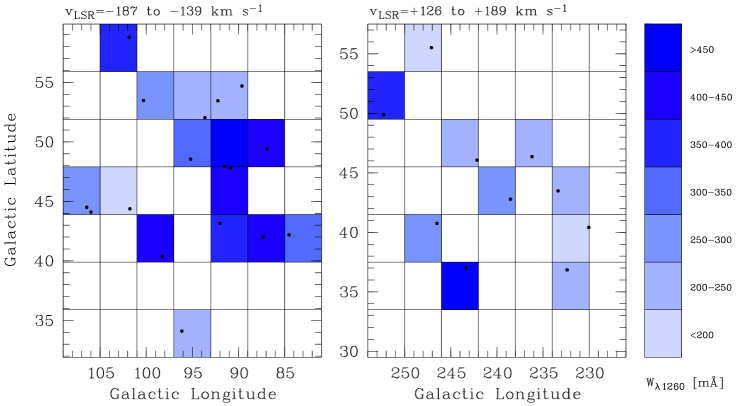
Figs. 13, and A.3 indicate that the equivalent widths of metal ions can vary substantially within HVCs on sub-kpc scales. The largest differences are seen in the singly-ionized species Si ii and C ii, while they are typically less pronounced in Si iii and C iv. As can be concluded from these figures, the overall velocity structure in the HVC absorption patterns remains mostly unchanged along the different sightlines at the (limited) velocity resolution of the COS instrument ( km s-1). So far, the information on small-scale structure in HVC gas from absorption-line studies is limited to only a few cloud complexes (e.g., the HVC towards the LMC; Danforth et al. 2003; Bluhm et al. 2001; Lehner et al. 2009; Smoker et al. 2014). In contrast, the presence of pc-scale substructure in HVCs in H i is well established from high-resolution 21 cm observations (e.g., Wakker et al. 2002; Sembach et al. 2004). The observed variation in the absorption/emission line strengths imply spatial fluctuations in the local gas density and/or changes in physical conditions (temperature, chemical composition, radiation field, etc.). From the few detections of molecular gas in HVCs (Richter et al. 1999; Sembach et al. 2001; Richter et al. 2001, 2013; Wakker et al. 2006; Murray et al. 2015) follows that substantial small-scale structure in the gas densities exists down to sub-pc scales. The formation and maintenance of small-scale structure in the star-less HVCs are based on physical mechanisms that must be different from those in in the disk, where supernova explosions and other stellar feedback processes are known to stir up the ISM and form (mostly short-lived) interstellar structures on sub-pc/AU scales (de Avillez & Breitschwert 2007).
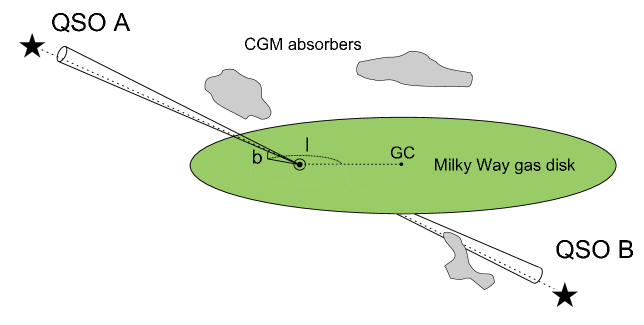
| No. | QSO (COS name) | ||
|---|---|---|---|
| [] | [] | ||
| 1 | J142947.03+064334.9 | 356.3 | 59.0 |
| 2 | RX J2154.1-4414 | 355.2 | 50.9 |
| 3 | 2MASS-J14294076+0321257 | 351.8 | 56.6 |
| 4 | PKS2005-489 | 350.4 | 32.6 |
| 5 | LBQS-1435-0134 | 348.7 | 51.4 |
| 6 | RBS1892 | 345.9 | 58.4 |
| 7 | QSO-B1435-0645 | 344.0 | 47.2 |
| 8 | VV2006-J140655.7+015713 | 341.8 | 59.0 |
| 9 | SDSS-J135726.27+043541.4 | 340.8 | 62.5 |
| 10 | IRAS-F22456-5125 | 338.5 | 56.6 |
| 11 | ESO-141-55 | 338.2 | 26.7 |
| 12 | HE2347-4342 | 336.0 | 69.6 |
| 13 | SDSSJ134206.56+050523.8 | 333.9 | 64.9 |
| 14 | 1H-2129-624 | 331.1 | 42.5 |
| 15 | VV2006-J131545.2+152556 | 329.9 | 77.0 |
a The full version of Table A.1 is only available in electronic form at the CDS via anonymous ftp to
cdsarc.u-strasbg.fr (130.79.128.5) or via http://cdsweb.u-strasbg.fr/cgi-bin/qcat?J/A+A/.
| No. | QSO (COS name) | Ion | S/Nb | log | (log ) | |||||
| [Å] | [km s-1] | [km s-1] | [mÅ] | [mÅ] | ||||||
| 1 | J142947.03+064334.9 | CII | 1334.5 | 6 | -155 | -100 | 145 | 27 | 14.03 | |
| 2 | J142947.03+064334.9 | CIV | 1548.2 | 6 | -165 | -99 | 123 | 35 | 13.77 | 0.13 |
| 3 | J142947.03+064334.9 | CIV | 1550.8 | 6 | -131 | -100 | 42 | 22 | 13.55 | 0.16 |
| 4 | J142947.03+064334.9 | SiII | 1190.4 | 5 | -133 | -103 | 50 | 19 | 13.17 | 0.20 |
| 5 | J142947.03+064334.9 | SiII | 1193.3 | 5 | -149 | -100 | 94 | 26 | 13.32 | |
| 6 | J142947.03+064334.9 | SiII | 1260.4 | 6 | -155 | -100 | 124 | 23 | 13.15 | |
| 7 | J142947.03+064334.9 | SiII | 1526.7 | 5 | -142 | -99 | 59 | 32 | 13.64 | 0.26 |
| 8 | J142947.03+064334.9 | SiIII | 1206.5 | 4 | -167 | -99 | 122 | 39 | 12.81 | |
| 9 | PKS2005-489 | CII | 1334.5 | 24 | 101 | 202 | 125 | 11 | 13.89 | 0.06 |
| 10 | PKS2005-489 | CIV | 1548.2 | 18 | 101 | 167 | 91 | 13 | 13.50 | 0.10 |
| 11 | PKS2005-489 | SiII | 1193.3 | 25 | 101 | 187 | 68 | 9 | 13.11 | 0.08 |
| 12 | PKS2005-489 | SiII | 1260.4 | 34 | 99 | 206 | 123 | 8 | 13.07 | 0.04 |
| 13 | PKS2005-489 | SiIII | 1206.5 | 25 | 101 | 203 | 143 | 9 | 13.00 | 0.06 |
| 14 | LBQS-1435-0134 | CII | 1334.5 | 31 | -136 | -100 | 57 | 4 | 13.59 | 0.07 |
| 15 | LBQS-1435-0134 | CIV | 1548.2 | 35 | -183 | -100 | 118 | 8 | 13.58 | 0.05 |
| 16 | LBQS-1435-0134 | SiII | 1190.4 | 32 | -121 | -100 | ||||
| 17 | LBQS-1435-0134 | SiII | 1260.4 | 39 | -156 | -100 | 59 | 4 | 12.75 | 0.05 |
| 18 | LBQS-1435-0134 | SiIII | 1206.5 | 35 | -180 | -100 | 49 | 6 | 12.44 | 0.07 |
a The full version of Table A.2 is only available in electronic form at the CDS via anonymous ftp to
cdsarc.u-strasbg.fr (130.79.128.5) or via http://cdsweb.u-strasbg.fr/cgi-bin/qcat?J/A+A/.
b S/N per resolution element.
c A “t” in front of the equivalent width indicates a tentative HVC detection.
d For each ion, the maximum value for is adopted for the further column-density analysis (see Sect. 2.2).
| No. | Galaxy name | Alternative name | Type | |||||||
|---|---|---|---|---|---|---|---|---|---|---|
| [h m] | [ m] | [kpc] | [mag] | [km s-1] | [] | [] | ||||
| 1 | M31 | NGC 224 | 00 40.0 | +40 59 | Sb | 770 | 121.2 | |||
| 2 | M33 | NGC 598 | 01 31.1 | +30 24 | Sc | 850 | 133.6 | |||
| 3 | LMC | 05 24.0 | -69 48 | Irr | 49 | 280.5 | ||||
| 4 | IC 10 | 00 17.7 | +59 01 | Irr | 660 | 119.0 | ||||
| 5 | NGC 6822 | DDO 209 | 19 42.1 | -14 56 | Irr | 540 | 25.3 | |||
| 6 | M32 | NGC 221 | 00 40.0 | +40 36 | E2 | 770 | 121.2 | |||
| 7 | NGC 205 | 00 37.6 | +41 25 | E5 | 830 | 120.7 | ||||
| 8 | SMC | 00 51.0 | -73 06 | Irr | 58 | 302.8 | ||||
| 9 | NGC 3109 | DDO 236 | 10 00.8 | -25 55 | Irr | 1260 | 262.1 | |||
| 10 | NGC 185 | 00 36.2 | +48 04 | E3 | 620 | 120.8 | ||||
| 11 | IC 1613 | DDO 8 | 01 02.2 | +01 51 | Irr | 715 | 129.8 | |||
| 12 | NGC 147 | DDO 3 | 00 30.5 | +48 14 | E4 | 755 | 119.8 | |||
| 13 | Sextans A | DDO 75 | 10 08.6 | -04 28 | Irr | 1450 | 246.2 | |||
| 14 | Sextans B | DDO 70 | 09 57.4 | +05 34 | Irr | 1300 | 233.2 | |||
| 15 | WLM | DDO 221 | 23 59.4 | -15 45 | Irr | 940 | 75.9 | |||
| 16 | Sagittarius | 18 51.9 | -30 30 | dE7 | 24 | 5.6 | ||||
| 17 | Fornax | 02 37.8 | -34 44 | dE3 | 131 | 237.1 | ||||
| 18 | Pegasus | DDO 216 | 23 26.1 | +14 28 | Irr | 760 | 94.8 | |||
| 19 | And VII | Cas Dw | 23 24.1 | +50 25 | dE3 | 760 | 109.5 | |||
| 20 | Leo I | DDO 74 | 10 05.8 | +12 33 | dE3 | 251 | 226.0 | |||
| 21 | Leo A | DDO 69 | 09 56.5 | +30 59 | Irr | 692 | 196.9 | |||
| 22 | And II | 01 13.5 | +33 09 | dE3 | 680 | 128.9 | ||||
| 23 | And I | 00 43.0 | +37 44 | dE0 | 790 | 121.7 | ||||
| 24 | And VI | Peg Dw | 23 49.2 | +24 18 | dE3 | 815 | 106.1 | |||
| 25 | SagDIG | 19 27.9 | -17 47 | Irr | 1150 | 21.1 | ||||
| 26 | Aquarius | DDO 210 | 20 44.2 | -13 01 | Irr | 950 | 34.0 | |||
| 27 | Antlia | 10 01.8 | -27 05 | dE3 | 1150 | 263.1 | ||||
| 28 | Sculptor | 00 57.6 | -33 58 | dE | 78 | 287.5 | ||||
| 29 | And III | 00 32.6 | +36 12 | dE6 | 760 | 119.3 | ||||
| 30 | Leo II | DDO 93 | 11 10.8 | +22 26 | dE0 | 230 | 220.2 | |||
| 31 | Cetus | 00 23.6 | -11 19 | dE4 | 800 | 101.4 | ||||
| 32 | Sextans | 10 10.6 | -01 24 | dE4 | 90 | 243.4 | ||||
| 33 | Phoenix | 01 49.0 | -44 42 | Irr | 390 | 272.2 | ||||
| 34 | LGS 3 | 01 01.2 | +21 37 | Irr/dE | 810 | 126.8 | ||||
| 35 | Tucana | 22 38.5 | -64 41 | dE5 | 900 | 322.9 | ||||
| 36 | Carina | 06 40.4 | -50 55 | dE4 | 87 | 260.1 | ||||
| 37 | And V | 01 07.3 | +47 22 | dE | 810 | 126.2 | ||||
| 38 | Ursa Minor | DDO 199 | 15 08.2 | +67 23 | dE5 | 69 | 105.0 | |||
| 39 | Draco | DDO 228 | 17 19.2 | +57 58 | dE3 | 76 | 86.4 | |||
| 40 | And IX | 00 50.0 | +42 57 | dE | 780 | 123.2 |
| No. | QSO | log (H i) | log (H) | log | |
|---|---|---|---|---|---|
| [km s-1] | |||||
| 1 | J142947.03+064334.9 | -133 | |||
| 2 | PKS2005-489 | 152 | |||
| 3 | LBQS-1435-0134 | -140 | |||
| 4 | QSO-B1435-0645 | -119 | |||
| 5 | VV2006-J140655.7+015713 | -131 | |||
| 6 | SDSS-J135726.27+043541.4 | -116 | |||
| 7 | IRAS-F22456-5125 | 146 | |||
| 8 | SDSSJ134206.56+050523.8 | -106 | |||
| 9 | 1H-2129-624 | 186 | |||
| 10 | 1H-2129-624 | 129 | |||
| 11 | SDSSJ134251.60-005345.3 | -114 | |||
| 12 | HARO11 | 142 | |||
| 13 | HARO11 | -164 | |||
| 14 | RXS-J00057-5007 | 130 | |||
| 15 | RBS144 | 156 |
a The full version of Table A.4 is only available in electronic form at the CDS via anonymous ftp to
cdsarc.u-strasbg.fr (130.79.128.5) or via http://cdsweb.u-strasbg.fr/cgi-bin/qcat?J/A+A/.
| Pair no. | QSO | HVC Complex | ||
|---|---|---|---|---|
| [] | [] | |||
| 1 | 2MASS-J14294076+0321257 | 351.8 | 56.6 | Complex L |
| 1 | HB89-0232-042 | 174.5 | -56.2 | |
| 2 | PKS2005-489 | 350.4 | -32.6 | MagellanicStream |
| 2 | SDSSJ080908.13+461925.6 | 173.3 | 32.3 | Complex A |
| 3 | QSO-B1435-0645 | 344.0 | 47.2 | Complex L |
| 3 | MRK595 | 164.8 | -46.5 | |
| 4 | IRAS-F22456-5125 | 338.5 | -56.6 | MagellanicStream |
| 4 | 1ES1028+511 | 161.4 | 54.4 | Complex M |
| 5 | IRAS-F22456-5125 | 338.5 | -56.6 | MagellanicStream |
| 5 | 1SAXJ1032.3+5051 | 161.4 | 54.6 | Complex M |
| 6 | 1H-2129-624 | 331.1 | -42.5 | MagellanicStream |
| 6 | SDSSJ092837.98+602521.0 | 154.1 | 42.4 | Complex A |
| 7 | VV2006-J130524.3+035731 | 311.7 | 66.6 | |
| 7 | LBQS-0107-0235 | 134.0 | -64.8 | MagellanicStream |
| 8 | UKS-0242-724 | 291.8 | -42.4 | MagellanicStream |
| 8 | SDSSJ145907.58+714019.9 | 110.0 | 42.1 | Complex C |
| 9 | ESO-031–G-008 | 290.3 | -40.8 | MagellanicStream |
| 9 | SDSSJ145907.58+714019.9 | 110.0 | 42.1 | Complex C |
| 10 | HE1159-1338 | 285.1 | 47.2 | |
| 10 | PG0003+158 | 107.3 | -45.3 | MagellanicStream |
| 11 | CAL-F-COPY | 277.2 | -35.4 | MagellanicStream |
| 11 | SDSSJ171737.95+655939.3 | 96.1 | 34.1 | Complex C |
| 12 | CAL-F-COPY | 277.2 | -35.4 | MagellanicStream |
| 12 | HS1700+6416 | 94.4 | 36.2 | Complex C |
| 13 | IRAS-L06229-6434 | 274.3 | -27.3 | MagellanicStream |
| 13 | H1821+643 | 94.0 | 27.4 | Complex C |
| 14 | QSO-B1126-041 | 267.6 | 52.7 | |
| 14 | NGC7714 | 88.2 | -55.6 | MagellanicStream |
| 15 | IRAS-F04250-5718 | 267.0 | -42.0 | MagellanicStream |
| 15 | SBS1624+575 | 87.3 | 42.0 | Complex C |
| 16 | IRAS-F04250-5718 | 267.0 | -42.0 | MagellanicStream |
| 16 | PG1626+554 | 84.5 | 42.2 | Complex C |
| 17 | 2DFGRSS393Z082 | 226.6 | -65.0 | MagellanicStream |
| 17 | SDSS-J145424.33+304658.3 | 48.1 | 62.9 | |
| 18 | SDSSJ094733.21+100508.7 | 225.4 | 43.5 | Complex WAWB |
| 18 | PHL1811 | 47.5 | -44.8 | Complex GCN |
| 19 | TONS210 | 225.0 | -83.2 | MagellanicStream |
| 19 | SDSSJ133045.15+281321.4 | 42.4 | 81.2 | |
| 20 | PKS0405-123 | 204.9 | -41.8 | |
| 20 | SDSS-J160519.70+144852.2 | 27.8 | 43.4 | |
| 21 | PKS0405-123 | 204.9 | -41.8 | |
| 21 | 1ES1553+113 | 21.9 | 44.0 | |
| 22 | BZBJ1001+2911 | 199.5 | 52.6 | Complex M |
| 22 | PKS2155-304 | 17.7 | -52.2 | Complex GCN |
| 23 | FBQSJ1010+3003 | 198.4 | 54.6 | Complex M |
| 23 | PKS2155-304 | 17.7 | -52.2 | Complex GCN |
| 24 | 2MASS-J09591486+3203573 | 194.7 | 52.5 | Complex M |
| 24 | PKS2155-304 | 17.7 | -52.2 | Complex GCN |