Can Self-Censorship in News Media
be Detected Algorithmically?
A Case Study in Latin America
Abstract
Censorship in social media has been well studied and provides insight into how governments stifle freedom of expression online. Comparatively less (or no) attention has been paid to detecting (self) censorship in traditional media (e.g., news) using social media as a bellweather. We present a novel unsupervised approach that views social media as a sensor to detect censorship in news media wherein statistically significant differences between information published in the news media and the correlated information published in social media are automatically identified as candidate censored events. We develop a hypothesis testing framework to identify and evaluate censored clusters of keywords, and a new near-linear-time algorithm (called GraphDPD) to identify the highest scoring clusters as indicators of censorship. We outline extensive experiments on semi-synthetic data as well as real datasets (with Twitter and local news media) from Mexico and Venezuela, highlighting the capability to accurately detect real-world self censorship events.
1 Introduction
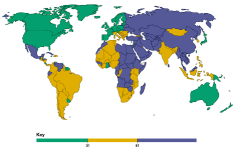
News media censorship is generally defined as a restriction on freedom of speech to prohibit access to public information, and is taking place more than ever before. According to the Freedom of the Press Report, 40.4 percent of nations fit into the “free” category in 2003. By 2014, this global percentage fell to 32 percent , as shown in Figure 1 111https://freedomhouse.org/report/freedom-press/freedom-press-2014. More than 200 journalists were jailed in 2014, according to the Committee to Protect Journalists. In fact, in the past three years, more than 200 journalists have been jailed annually 222http://saccityexpress.com/defending-freedom-of-speech/#sthash.cbI7lWbw.dpbs.
One of the responses to this stifling environmental context is self-censorship, i.e., the act of deciding not to publish about certain topics, owing to safety or partisan reasons. Although the social and political aspects of news media censorship have been deeply discussed and analyzed in the field of social sciences [14, 2, 24, 16], there is currently no efficient and effective approach to automatically detect and track self-censorship events in real time.
Social media censorship often takes the form of active censors identifying offending posts and deleting them and therefore tracking post deletions supports the use of supervised learning approaches [8, 4, 1, 11]. On the other hand, censorship in news media typically has no labeled information and must rely on unsupervised techniques instead.
In this paper, we present a novel unsupervised approach that views social media as a sensor to detect censorship in news media wherein statistically significant differences between information published in the news media and the correlated information published in social media are automatically identified as candidate censored events.
A generalized log-likelihood ratio test (GLRT) statistic can then be formulated for hypothesis testing, and the problem of censorship detection can be cast as the maximization of the GLRT statistic over all possible clusters of keywords. We propose a near-linear-time algorithm called GraphDPD to identify the highest scoring clusters as indicators of censorship events in the local news media, and further apply randomization testing to estimate the statistical significances of these clusters.
We consider the detection of censorship in the news media of two countries, Mexico and Venezuela, and utilize Twitter as the uncensored source.
1.1 Is Twitter a reliable sensor for detecting censorship?
Starting in January 2012, a “Country-Withheld Content” policy has been launched by Twitter, with which governments are able to request withholding and deletion of user accounts and tweets. At the same time, Twitter started to release a transparency report, which provided worldwide information about such removal requests. The Transparency Report lists information and removal requests from Year 2012 to 2015 on a half-year basis. Table 1 summarizes the information and removal requests for Year 2014 on nine countries of interest. As shown in Table 1, for our countries of interest (viz. Mexico and Venezuela), Twitter did not participate in any social media censorship; therefore, we believe that Twitter can be considered as a reliable and uncensored source to detect news self censorship events in these two countries.
The main contributions of this paper are summarized as follows:
-
•
Analysis of censorship patterns between news media and Twitter: We carried out an extensive analysis of information in Twitter deemed relevant to censored information in news media. In doing so, we make important observations that highlight the importance of our work.
-
•
Formulation of an unsupervised censorship detection framework: We propose a novel hypothesis-testing-based statistical framework for detecting clusters of co-occurred keywords that demonstrate statistically significant differences between the information published in news media and the correlated information published in a uncensored source (e.g., Twitter). To the best of our knowledge, this is the first unsupervised framework for automatic detection of censorship events in news media.
-
•
Optimization algorithms: The inference of our proposed framework involves the maximization of a GLRT statistic function over all clusters of co-occurred keywords, which is hard to solve in general. We propose a novel approximation algorithm to solve this problem in nearly linear time.
-
•
Extensive experiments to validate the proposed techniques: We conduct comprehensive experiments on real-world Twitter and local news articles datasets to evaluate our proposed approach. The results demonstrate that our proposed approach outperforms existing techniques in the accuracy of censorship detection. In addition, we perform case studies on the censorship patterns detected by our proposed approach and analyze the reasons behind censorship from real-world data of Mexico and Venezuela during Year 2014.
| Country | Account Information Request | Removal Requests | Tweets Withheld |
| Australia | 12 | 0 | 0 |
| Brazil | 127 | 35 | 101 |
| Colombia | 8 | 0 | 0 |
| Greece | 19 | 0 | 0 |
| Japan | 480 | 6 | 43 |
| Mexico | 12 | 0 | 0 |
| Saudi Arabia | 220 | 0 | 0 |
| Turkey | 380 | 393 | 2003 |
| Venezuela | 4 | 0 | 0 |
2 Related Work
Here is a brief survey of three broad classes of work pertinent to our work.
Analysis of the coverage of various topics across social media and news media has been well established in many studies.
[19] studies topic and timing overlapping in newswire and Twitter and concludes that Twitter covers not only topics reported by news media during the same time period, but also minor topics ignored by news media. Through analysis of hundreds of news events, [5] observes both similarities and differences of coverage of events between social media and news media. In this paper, we uncover indicators of censorship pattern in news media from various interactive patterns between social media and news media.
Event detection in social media has been studied in many recent works. Watanabe et al. [13] develop a system, which identifies tweets posted closely in time and location and determine whether they are mentions of the same event by co-occurring keywords. Ritter et al. [6] presents the first open-domain system for event extraction and an approach to classify extracted events based on latent variable models. Rozenshtein et al. [17] formulates event detection in activity networks as a graph mining problem and proposes effective greedy approaches to solve this problem. In addition to textual information, Gao et al. [21] propose an event detection method which utilizes visual content and intrinsic correlation in social media.
Censorship is a critical problem in many countries across the world and most of the existing studies on censorship analysis are focused on Turkey and China.
Turkey, which is identified as the country issuing the largest number of censorship requests by Twitter, has been studied for censorship topics by applying topic extraction and clustering on a collection of censored tweets in [18]. [3] analyzes the relationship between the Turkish government and media companies and reveals that the government exerts control over mainstream media and the flow of information. However, most of the existing approaches are supervised or semi-supervised, which rely on collections of censored posts, and highlight the necessity of unsupervised approaches to uncover self censorship in news media.
3 Data Analysis
Table 3 summarizes the notation used in this work. The EMBERS project [15] provided a collection of Latin American news articles and Twitter posts. The news dataset was sourced from around 6000 news agencies during 2014 across the world. From “4 International Media & Newspapers”, we retrieved a list of top newspapers with their domain names in the target country. News articles are filtered based on the domain names in the URL links. Twitter data was collected by randomly sampling 10% (by volume) tweets from January 1, 2014 to December 31, 2014. Retweets in Twitter were removed as they were not as informative as original tweets. Mexico and Venezuela were chosen as two target countries in this work since they had no censorship in Twitter (as shown in Table 1) but featured severe censorship in news media (as shown in Fig. 1).
3.1 Data Preprocessing
The inputs to our proposed approach are keyword co-occurrence graphs.
Each node represents a keyword associated with four attributes: (1) time-series daily
frequency (TSDF) in Twitter, (2) TSDF in News, (3) expected daily frequency in Twitter, and (4) expected daily frequency in News. Each edge represents the co-occurrence of connecting nodes in Twitter, or News, or both. However, constructing such graphs is not trivial due to data integration. One challenge is to handle the different vocabularies used in Twitter and News, with underlying distinct
distributions.
To find words that behave differently in News comparing to Twitter, we only retained keywords which are mentioned in both Twitter and News. For each keyword, linear correlation between its TSDF in Twitter and News during Year 2014 is required to be greater than a predefined threshold (e.g. 0.15) in order to guarantee the keyword is well correlated in two data sources. TSDF in Twitter and News for each node are normalized with quantile normalization. An edge is removed if its weight is less than , where is the threshold used to tradeoff graph sparsity and connectivity. Empirically we found to be an effective threshold. A keyword co-occurrence graph for a continuous time window is defined as the maximal connected component from a union of daily keyword co-occurrence graph during the time window.
3.2 Pattern Analysis
Though many events drive both social media and traditional news media, it’s challenging to claim that any deviation between the two is evidence of censorship or different topics of interest. Table 2 summarizes various co-occurring patterns between Twitter and news media that we are able to observe from our real world dataset in Mexico and more details are discussed as follows.
| \pbox3cmTopic is of interest in both social media and news media. | \pbox3cmTopic is of interest in social media but not in news media. | \pbox3cmTopic is of interest in news media but not in social media. | \pbox3cmCensorship in one news media source. | |
![[Uncaptioned image]](/html/1611.06947/assets/x2.png) |
![[Uncaptioned image]](/html/1611.06947/assets/x3.png) |
![[Uncaptioned image]](/html/1611.06947/assets/x4.png) |
![[Uncaptioned image]](/html/1611.06947/assets/x5.png) |
![[Uncaptioned image]](/html/1611.06947/assets/x6.png) |
| \pbox3cmExample: In early March 2014, Malaysia Airlines Flight MH 370 went missing. | \pbox3cmExample: Late June 2014 featured a soccer game between Mexico and Holland as part of the 2014 FIFA World Cup. | \pbox4cmExample: In late September 2014, 125 heads of state and governments attended the Global Climate Summit, which was seen as a milestone to a new legal agreement on climate change. | \pbox4cmExample: In late September 2014, 43 students from Ayotzinapa Rural Teachers’ College went missing in Mexico. This incident has been referred to as the worst human rights crisis Mexico faced since the 1968 massacre of students. |
Topic is of interest both in social media and news media: On March 8th, 2014, Malaysia Airlines Flight MH370 disappeared while flying from Malaysia to China; 12 Malaysian crew members and 227 passengers from 15 nations were declared missing. During the following week, we are able to observe sparks in discussions of this incident and mentions of relevant keywords (MH370, Malaysia) across both social media and news media.
Topic is of interest only in social media: From June 28th to 30th 2014, there are many soccer matches held by the 2014 FIFA World Cup, including one game between Mexico and Holland. During this time period, we are able to observe spikes in mentions of relevant keywords (fifa, fútbol, robben, holland, mexicano) across Twitter in Mexico. However, mentions of these keywords in a list of nine Mexican news outlets do not depict significant changes as this is viewed as a general soccer game.
Topic is of interest only in news media: On September 23, 2014, 125 heads of state and governments attended the global Climate Summit, which was seen as a milestone to a new legal agreement on climate change. This incident is widely discussed in news media, while relatively less attention in social media (in Latin
America).
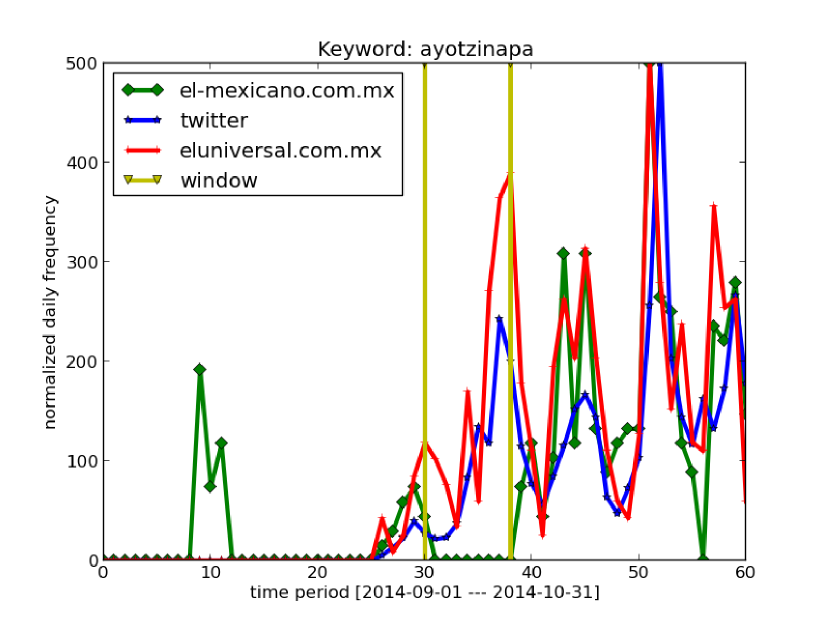
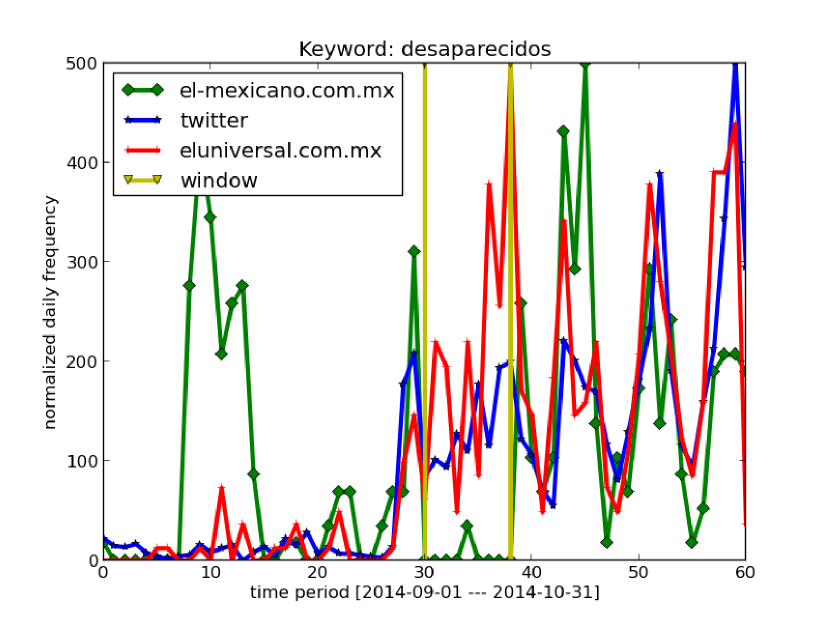
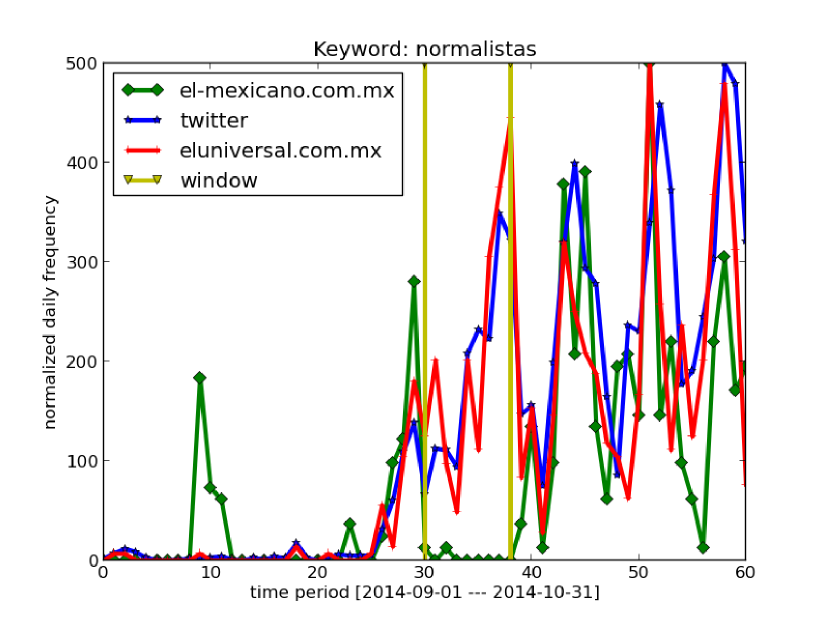
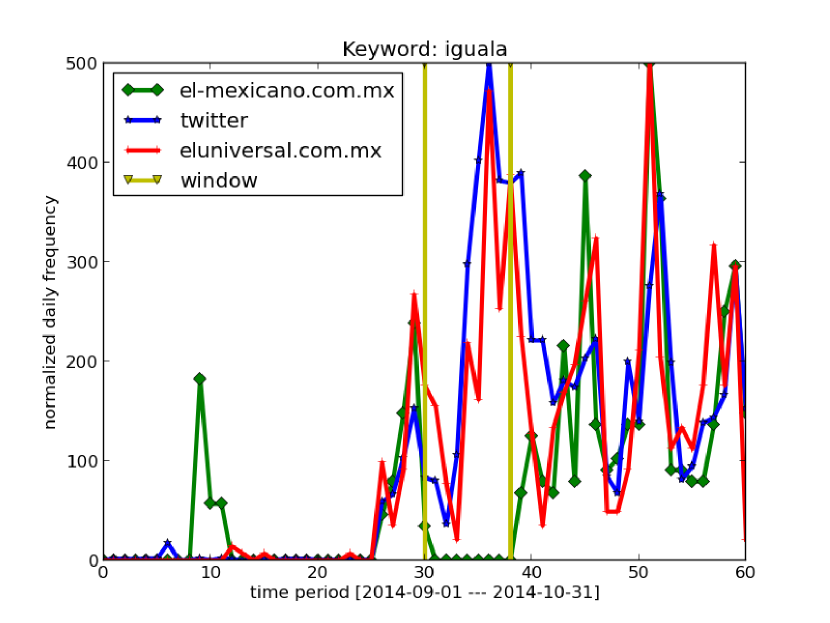
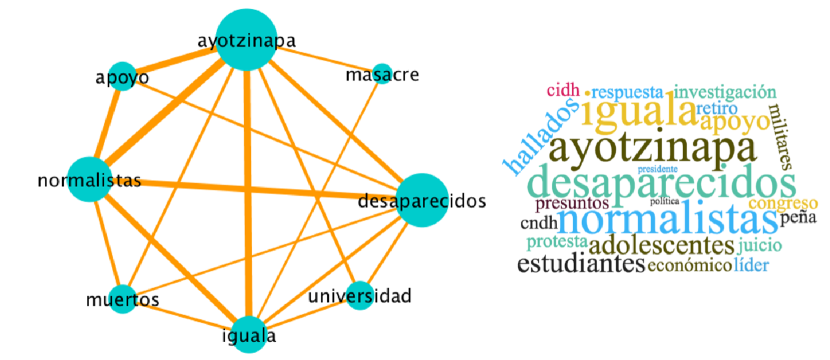
Topic is censored in news media: To illustrate an example anomalous behavior in News, Fig. 2 compares TSDF in El Mexicano Gran Diario Regional (el-mexicano.com.mx) and TSDF in Twitter during a 2-month period on a connected set of keywords sampled from tweets from
Mexico. All the example keywords are relevant to the 43 missing students from Ayotzinapa in the city of Iguala protesting the government’s education reforms. The strong connectivity of these keywords, as shown in Fig. 2(e), guarantees that they are mentioned together frequently in Twitter and local news media. The time region during which anomalous behavior is detected is highlighted with two yellow markers. Since volume of Twitter is much larger than volume of News, TSDF in Fig. 2(a) to Fig. 2(d) are normalized to [0, 500] for visualization. Fig. 2(a) to Fig. 2(d) depict that TSDF in El Mexicano Gran Diario Regional is well correlated with TSDF in Twitter except during the highlighted time region, where abnormal absenteeism in El Mexicano Gran Diario Regional can be observed for all example keywords. In order to validate the deviation between TSDF in El Mexicano Gran Diario Regional and TSDF in Twitter is not due to difference in topics of interests, we also compare with a number of other local news outlets. Fig. 2(a) to Fig. 2(d) shows that TSDF in El Universal in Mexico City is consistent with TSDF in Twitter and does not depict an abnormal absenteeism during the highlighted time period. Using Twitter and El Universal in Mexico City as sensors, we can conclude an indicator of self-censorship in El Mexicano Gran Diario Regional with respect to the 43 missing students during the highlighted time region.
Inspired by these observations, we say that a censorship pattern exists if for a cluster of connected keywords,
-
1.
their TSDF in at least one local news media is consistently different from TSDF in Twitter during a time period,
-
2.
their TSDF in local news media are consistently well correlated to TSDF in Twitter before the time period, and
-
3.
their TSDF in at least one different local news outlet does not depict abnormal absenteeism during the time period.
| Variable | Meaning |
| time series of daily frequency of node in uncensored Twitter dataset | |
| expected daily frequency of node in the Twitter dataset. | |
| time series of daily frequency of node in the censored news dataset | |
| expected daily frequency of node in data source | |
| TSDF | time series of daily frequency |
4 Methodology
This section presents a novel hypothesis testing framework for characterizing the censorship patterns as discussed in Section 3 and an efficient inference algorithm for automatic detection of such censorship patterns in nearly linear time.
4.1 Problem Formulation
Suppose we have a dataset of news reports and a dataset of tweets within a shared time period in a country of interest. Each news report or tweet is represented by a set of keywords and is indexed by a time stamp (e.g., day). We model the joint information of news reports and tweets using an undirected keyword co-occurrence graph , where refers to the ground set of nodes/keywords, refers to the total number of nodes, and is a set of edges, in which an edge indicates that the keywords i and j co-occur in at least one news report or tweet. Each node is associated with four attributes: , , , and as defined in Table 3. As our study is based on the analysis of correlations between frequencies of keywords in the news and Twitter datasets, we only consider the keywords whose frequencies in these two datasets are well correlated (with correlations above a predefined threshold 0.15). Our goal is to detect a cluster (subset) of co-occurred keywords and a time window as an indicator of censorship pattern, such that the distribution of frequencies of these keywords in the news dataset is significantly different from that in the Twitter dataset.
Suppose the chosen time granularity is day and the shared time period is . We consider two hypotheses: under the null (), the daily frequencies of each keyword in the news and Twitter datasets follow two different Poisson distributions with the mean parameters and , respectively; under the alternative (), there is a connected cluster of keywords and a continuous time window , in which the daily frequencies of each keyword in the Twitter dataset follow a Poisson with an elevated mean parameter , but those in the news dataset follows a Poisson with a down-scaled mean parameter . Formally, they can be defined as follows:
-
•
Null hypothesis :
-
•
Alternative hypothesis :
where , , the subgraph induced by (denoted as ) must be connected to ensure that these keywords are semantically related, and is a continuous time window defined as . Given the Poisson probability mass function denoted as , a generalized log likelihood ratio test (GLRT) statistic can then be defined to compare these two hypotheses, and has the form:
| (1) |
In order to maximize the GLRT statistic, we need to obtain the maximum likelihood estimates of and , which we set and , respectively and get the best estimate of and of where , , , . Substituting and with the best estimations and , we obtain the parametric form of the GLRT statistic as follows:
| (2) |
Given the GLRT statistic , the problem of censorship detection can be reformulated as Problem 1 that is composed of two major components: 1) Highest scoring clusters detection. The highest scoring clusters are identified by maximizing the GLRT statistic over all possible clusters of keywords and time windows; 2) Statistical significance analysis. The empirical p-values of the identified clusters are estimated via a randomization testing procedure [22], and are returned as significant indicators of censorship patterns in the news dataset, if their p-values are below a predefined significance level (e.g., 0.05).
Problem 1.
(GLRT Optimization Problem) Given a keyword co-occurrence graph and a predefined significance level , the GLRT optimization problem is to find the set of highest scoring and significant clusters . Each cluster in is denoted as a specific pair of connected subset of keywords () and continuous time window (), in which is the highest scoring subset within the time window :
| (3) |
and is significant with respect to the significance level .
4.2 GraphDPD Algorithm
Our proposed algorithm GraphDPD decomposes Problem 1 into a set of sub-problems, each of which has a fixed continuous time window, as shown in Algorithm 1. For each specific day (the first day of time window in Line 6) and each specific day (the last day of time window of Line 6), we solve the sub-problem (Line 7) with this specific using Relaxed-GrapMP algorithm which will be elaborated later. For each connected subset of keywords returned by Relaxed-GraphMP, its p-value is estimated by randomization test procedure [22](Line 8). The pair will be added into the result set (Line 9) if its empirical p-value is less than a predefined significance level (e.g., 0.05). The procedure getPValue in Line 8 refers to a randomization testing procedure based on the input graph to calculate the empirical p-value of the pair [22]. Finally, we return the set of signifiant clusters as indicators of censorship events in the news data set.
Line 7 in Algorithm 1 aims to solve an instance of Problem 1 given a specific time window , which is a set optimization problem subject to a connectivity constraint. Tung-Wei et. al. [20] proposed an approach for maximizing submodular set function subject to a connectivity constraint on graphs. However, our objective function is non-submodular as shown in Theorem 1 and this approach is not applicable here.
Theorem 1.
Given a specific window , our objective function defined in (2) is non-submodular.
We propose a novel algorithm named Relaxed-GraphMP to approximately solve Problem 1 in nearly linear time with respect to the total number of nodes in the graph. We first transform the GLRT statistic in Equation(2) to a vector form. Let be an n-dimensional vector , where and if , otherwise. We define as follows:
Therefore, , , , and in Equation(2) can be reformulated as follows:
Hence, can be reformulated as a relaxed function :
| (4) |
We relax the discrete domain of to the continuous domain of , and obtain the relaxed version of Problem 1 as described in Problem 2.
Problem 2.
Relaxed GLRT Optimization Problem Let be a continuous surrogate function of that is defined on the relaxed domain and is identical to on the discrete domain . The relaxed form of GLRT Optimization Problem is defined the same as the GLRT optimization problem, except that, for each pair in , the subset of keywords is identified by solving the following problem with :
where is the support of . The gradient of has the form:
| (5) |
Our proposed algorithm Relaxed-GraphMP decomposes Problem 2 into two sub-problems that are easier to solve: 1) a single utility maximization problem that is independent of the connectivity constraint; and 2) head projection and tail projection problems [7] subject to connectivity constraints. We call our method Relaxed-GraphMP which is analogous to GraphMP proposed by Chen et al. [10]. The high level of Relaxed-GraphMP is shown in Algorithm 2. It contains 4 main steps as described below.
-
•
Step 1: Compute the gradient of relaxed GLRT problem (Line 5). The calculated gradient is . Intuitively, it maximizes this gradient with connectivity constraint that will be solved in next step.
-
•
Step 2: Compute the head projection (Line 6). This step is to find a vector so that the corresponding subset can maximize the norm of the projection of gradient ( See details in [7]).
-
•
Step 3: Solve the maximization problem without connectivity constraint. This step (Line 7,8) solves the maximization problem subject to the , where is the union of the support of the previous solution with the result of head projection (Line 7). A gradient ascent based method is proposed to solve this problem. Details is not shown here due to space limit.
-
•
Step 4: Compute the tail projection (Line 9). This final step is to find a subgraph so that is close to but with connectivity constraint. This tail projection guarantees to find a subgraph with constant approximation guarantee (See details in [7]).
-
•
Halting: The algorithm terminates when the condition holds. Our algorithm returns a connected subgraph where the connectivity of is guaranteed by Step 4.
Time Complexity Analysis: The GraphDPD algorithm is efficient as its time complexity is proportional to the total number of continous time windows . Therefore, the time complexity of GraphDPD is mainly dependent on the run time of Relaxed-GraphMP. We give the detailed time complexity analysis in Theroem 2.
Theorem 2.
Proof.
As the maximal time window in input graph is , GraphDPD needs iterations in its inner loop and outer loop (From Line 4 to Line 11 in Algorithm 1) to execute Relaxed-GraphMP (Line 7). Suppose Relaxed-GraphMP needs iterations, the time complexity of each iteration has three parts: 1). the run time for calculating gradient in Line 5 of Algorithm 2; 2). : the run time of Line 8 using gradient ascent where is the number of iterations in gradient ascent method; and 3). : the run time of head and tail projection in Line 6 and Line 9 of Algorithm 2. Hence the time complexity of Relaxed-GraphMP is . Therefore, the total time complexity of GraphDPD immediately follows. As observed in our experiments, the numbers of iterations, including and , scale constant with respect to , and the overall time complexity of GraphDPD hence scales nearly linear with respect to . ∎
5 Experiments
Through experiments, we (1) evaluate the performance of our proposed approach in censorship pattern detection compared with baseline methods, and (2) perform case studies that analyze the censorship patterns we have found in real data. The code and datasets will be available to researchers for evaluation purposes.
5.1 Experimental Design
Real world datasets: Table 4 gives a detailed description of real-world datasets we used in this work. Details of Twitter and news data access have been provided in Section 3. Daily keyword co-occurrence graphs, which integrate News with Twitter, are generated as described in Section 3.1.
| Country | Daily Tweets | Daily News | # of Nodes | # of Edges |
| Mexico | 249,124 | 863 | 3,369 | 93,919 |
| Venezuela | 222,072 | 169 | 2,469 | 37,740 |
Data Preprocessing: The preprocessing of the real world datasets has been discussed in detail in Section 3.1. In particular, we considered keywords whose day-by-day frequencies in news media and Twitter data have linear correlations above 0.15, in order to filter noisy keywords.
Semi-synthetic datasets: We create semi-synthetic datasets by using the coordinates from real-world datasets and injecting anomalies.
Ten daily keyword co-occurrence graphs are randomly selected to inject with random true anomaly connected subgraphs using a random walk algorithm [12] with a restart probability of . The number of nodes in the true anomaly subgraph is percentage of the number of nodes in the daily co-occurrence graph, where . For convenience but without loss of generality, we specified , where controls the scale of anomaly in tweets and controls scale of anomaly in local news articles. In our experiments, we set , and set
correspondingly.
Our proposed Graph-DPD and baseline methods: The maximal window size and result threshold in Graph-DPD are set as 7 and 0.05 respectively. However, our algorithm is not sensitive to the setting of and . We compare our proposed method with one baseline method LTSS [23], which finds anomalous but not necessarily connected subsets of data records by maximizing a score function.
We also compare our proposed method with two state-of-art baseline methods designed specifically for connected anomalous subgraph detection, namely, EventTree [17] and NPHGS [9]. Model parameters are tuned following the original papers.
Specifically, for EventTree we tested , , ,, , , , , , ,, , ,. For NPHGS, we set the number of seed entities and typical significance levels as the authors suggested. Since the baseline methods are designed to detect anomalies on one data source at one time, they are tested separately on Twitter and News, which are labeled as
, , , ,
and . Sepecifically, ,
and are burst detection baseline methods while , , and are absenteeism detection baseline methods by some transformations on attributes.
Performance Metrics: The performance metrics include: (1) precision (Pre), (2) recall (Rec), and (3) f-measure (F-score). Given the returned subset of nodes and the corresponding true subset of anomalies , we can calculate these metrics as follows:
Collecting labels for real data: We collect labels for real-world instances of censorship from all abnormal absence patterns identified in News by all baseline methods. For each abnormal absence pattern in News, we need to first identify if there are any relevant events of interest taking place around the associated time region. An indicator of censorship pattern is considered as valid if we can find the event of interest is: 1) not reported in some local news outlets while reported in some different local news outlets, 2) reported in influential international news outlets, and 3) reported of censorship activity in local news media from other news outlets during the associated time window. The evaluation process is analyzed with the inner-annotator agreement by multiple independent annotators (5 of the authors of this paper).
5.2 Semi-synthetic Data Evaluation
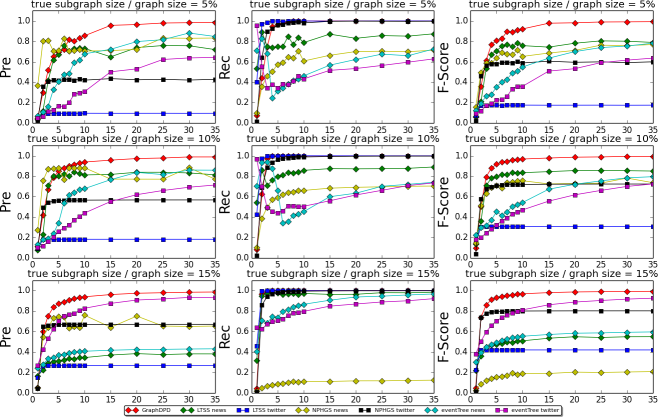
We evaluate the accuracy of our approach to detect the disrupted ground truth anomalies. Fig. 3 shows the average precision, recall, and F-measure in detecting the injected anomalies using the semi-synthetic data. We find that overall our approach consistently outperforms all other baseline methods.
Detection power. (1) Our approach. Our approach outperforms baseline methods especially at low perturbation intensities where the detection is harder to carry out, and the performance increases gradually with the increase of perturbation intensity. In particular, it has a high accuracy of detecting injected anomalies when regardless of the size of injected anomalies. Measures of recall using are as good as our approach while the other baseline methods are significantly worse than our approach especially when the size of disrupted ground truth anomalies is small and perturbation intensity is low. However, the measures of precision using are much worse than our approach. Considering overall F-score, and look similar to our approach when perturbation intensity is low while much worse than our approach when perturbation intensity is high. When we increase , EventTree based methods perform worse than our approach, especially when the size of ground truth anomalies is small. (2) NPHGS. When and true ratio , the precision of is better than our method. However, when , the recall of becomes quite low, which indicates its poor behavior when true subgraph is relatively large. (3) EventTree. The recall of and is among the best when is less than 2.0. The reason is that results of EventTree are easier affected by noise nodes. (4) LTSS. In general, LTSS did well in average recall but poorly in average precision as the size of anomalous graph increases. Hence, our approach outperforms the baseline by detecting connected clusters of keywords.
5.3 Real Data Evaluation
We apply our proposed approach to Twitter and News of Mexico and Venezuela during Year 2014 as shown in Table 4. Performance evaluation on censorship detection is two-fold: (1) quantitative evaluation on accuracy, and (2) qualitative case studies.
5.3.1 Quantitative Evaluation
In this paper, we focus on a list of nine local news outlets for each country and test on all possible continuous time windows from 3 to 7 days starting from January 1, 2014 to December 25, 2014. For every local news outlet and time window, our approach finds the connected cluster of keywords that maximizes the objective function as defined in Eqn. 2. Consider the existence of baseline level of variation, we perform 5,000 random permutations and record the function scores associated with each randomly selected connected cluster of keywords. For every local news outlet, we remove connected clusters of keywords whose p-values are greater than a predefined significance level (0.05). The number of remaining connected cluster of keywords for each local news outlet is summarized in the second column of Table 5. In order to eliminate overlapping time regions, connected clusters of keywords are ranked based on their p-values from low to high and merged if within 5 days of another connected cluster of keywords with a lower p-value. The number of distinct connected cluster of keywords for each local news outlet is summarized in the third column of Table 5. For simplicity, we call each distinct connected cluster of keywords and its corresponding time window as an indicator of censorship pattern.
For each country of interest, we group indicators of censorship patterns across all news outlets and merge similar indicators of censorship pattern in different news outlets. Two similar indicators of censorship pattern need to have overlapping time windows and overlapping event-relevant keywords. This yields 23 distinct indicators of censorship patterns detected in Mexico during Year 2014 and 5 of them are detected in all of the nine local news outlets. As discussed in Section 3.2, absence of patterns in all news outlets could be due to topical differences
between social and news media, and thus we use
the remaining 18 indicators of censorship for
evaluation. Similarly, we mined a total of 17 distinct indicators of censorship patterns in Venezuela during Year 2014 and 14 of them are considered in this study.
As discussed previously, existing approaches on censorship detection in social media rely on the collection of deleted posts and such approaches are not able to detect self censorship in news media. Hence, we apply three anomaly detection baseline methods, LTSS, NPHGS, and EventTree, to detect anomalies in News on graphs with all possible time windows from 3 days to 7 days using starting days from January 1, 2014 to December 25, 2014. The parameters used for the baselines are set similarly as in Section 5.1. The baseline methods can find anomalous subgraphs according to their own score functions; however, they are not able to evaluate the significance level of each subgraph. For the purpose of comparison, we remove duplicate subgraphs with overlapping time regions in the same manner as our method. The remaining subgraphs are ranked from the best to the worst according to their function values and top 18 subgraphs in Mexico and top 14 subgraphs in Venezuela are selected to compare with our method.
Table 6 summarizes the comparison of false positive rates in censorship detection and our method outperforms LTSS, NPHGS, and EventTree. The baseline methods, which are designed for event detection instead of censorship detection, will capture all falling patterns in News. In particular, the baseline methods are not able to successfully differentiate censored events from non-censored events, e.g., the normal end of attention paid to breaking events. Table 7 summarizes a list of example instances of censorship identified by our approach in Mexico and Venezuela with significance level . We will next evaluate these instances.
| Mexico | ||
| News Media | \pbox2cm# of results with p-value | # of distinct results |
| El Imparcial | 56 | 10 |
| El Mexicano Gran Diario Regional | 77 | 15 |
| El Siglo de Torreon | 43 | 9 |
| El Universal in Mexico City | 52 | 11 |
| El Informador | 59 | 11 |
| Noroeste | 65 | 13 |
| Novedades Acapulco | 63 | 12 |
| Correo | 58 | 11 |
| Vanguardia | 58 | 11 |
| Venezuela | ||
| News Media | \pbox2cm# of results with p-value | # of distinct results |
| El Tiempo in Trujillo | 59 | 11 |
| El Impulso | 58 | 9 |
| El Mundo | 45 | 8 |
| El Nacional | 57 | 11 |
| El Tiempo in Anzoategui | 63 | 12 |
| El Universal in Caracas | 46 | 7 |
| La Verdad | 69 | 12 |
| Tal Cual | 68 | 12 |
| Ultimas Notícias | 76 | 14 |
| Country | LTSS | NPHGS | EventTree | GraphDPD |
| Mexico | 0.722 | 0.667 | 0.556 | 0.278 |
| Venezuela | 0.714 | 0.786 | 0.643 | 0.357 |
| Mexico | |||
| Date | Example censored keywords | \pbox3cmExample local news media | |
| detected with censorship | Reasons for censorship in news media | ||
| 2014-05-01 | \pbox5cmreforma(reform), gasolina(petrol), educación(education) | Noroeste | \pbox7cmTens of thousands of people marched in Mexico City on Labor Day to protest the new laws, which target at Mexico’s education system and opening up the state controlled oil industry to foreign investors. |
| 2014-09-27 | \pbox5cmayotzinapa, iguala, normalistas, desaparecidos(missing), detenidos(detained), protesta(protest) | El Mexicano Gran Diario Regional | \pbox7cm43 students from the Ayotzinapa Rural Teachers’ College went missing and kidnapped in Iguala on September 26, 2014. This incident became the biggest political and public security scandal of Mexican President. |
| 2014-11-10 | \pbox5cmayotzinapa, estudiantes(students), normalistas, desaparecidos(missing), protesta(protest), militares(military), iguala | El Mexicano Gran Diario Regional | \pbox7cmProtests in Mexico City demanding the return of the missing students, who came from Ayotzinapa Rural Teachers’ College and went missing in Iguala on September 26, 2014, turned violent for the first time. Protesters set fire at the National Palace and some of them were arrested. |
| Venezuela | |||
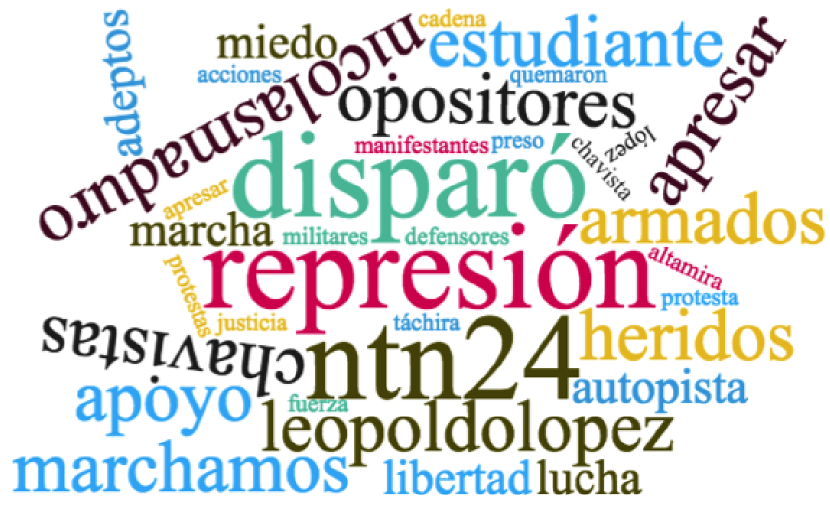
| 2014-02-18 | \pbox5cmrepresión(repression), disparó(shooting), marchamos(march), heridos(wounded), nicolasmaduro, armados(armed), leopoldolopez, apresar(arrest), ntn24 | Ultimas Notícias | \pbox7cmMass protests led by opposition leaders, including Leopoldo López, occurred in 38 cities across Venezuela asking for the release of the arrested students. Colombian TV news channel NTN24 is taken off air for airing anti-government demonstrations. |
| 2014-05-01 | \pbox5cmmuertes(deaths), cambio(change), caracas, presidente(president), labor | El Tiempo in Anzoategui | \pbox7cmThousands of Venezuelans demonstrated in Caracas to commemorate Labor Day and denounce shortages. Some protesters were injured when dispersed by authorities. |
| 2014-08-12 | \pbox5cmgubernamental(government), anticontrabando, contrabando, ébola, muerte(death) | El Nacional | \pbox7cmVenezuela is the only country in Latin America with increasing number of malaria. With the spreading of Ebola virus, Venezuela is one of the most vulnerable countries in Latin America due to the lack of basic supplies, water, and electricity. |
5.3.2 Case Studies
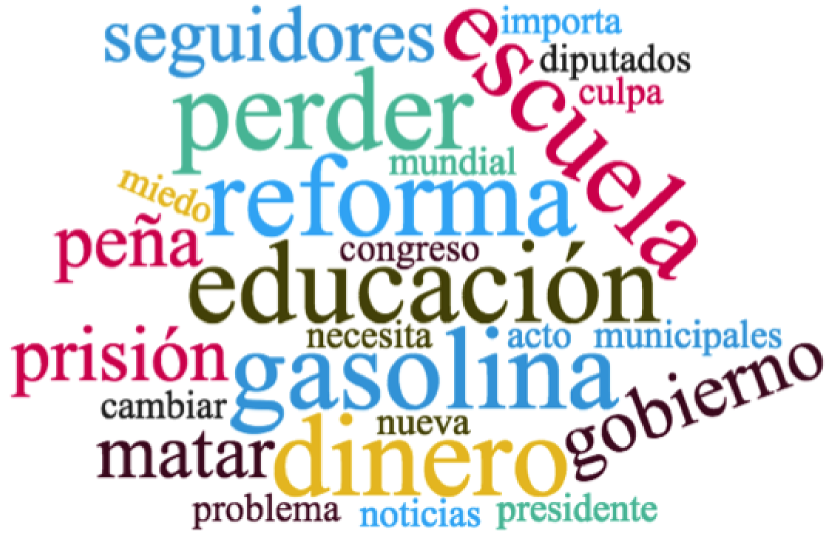
Mexico May 2014. In December 2013, Mexican president Peña Nieto and Congress amended the Constitution, opening up the state controlled oil industry to foreign investors. Tens of thousands of protesters demonstrated in Mexico City on Labor Day (May 1) to protest against the energy reform, fearing the total privatization of the energy sector and higher energy prices 333http://www.wbur.org/hereandnow/2014/05/02/may-day-mexico
. In additions, protesters were also unsatisfied with the 2013 reforms of the educational sector. However, this incident was not reported in a number of influential newspapers in Mexico, including but not limited to Noroeste, Vanguardia, El Siglo de Torreon, Correo, El Imparcial, El Informador, Novedades Acapulco, and El Universal, which is an indicator of censorship. Fig. 4(a) shows a cluster of censored keywords detected by our method around May 1, 2014 in Mexico.
Our approach has successfully captured consistent censorship patterns among a collection of relevant keywords, which well describe the topics around which the May 1 demonstrations were organized (reforma, gasolina, dinero, educación, escuela).
Venezuela February 2014. As a result of the collapse of the price of oil (main export of the country), a decade of disastrous macroeconomic policies and growing authoritarianism Venezuela suffered from inflation, shortages of basic foodstuffs and other necessities, and increasing political frustration.
Mass opposition protests led by opposition leaders demanding the release of the students occurred in 38 cities across Venezuela on February 12, 2014. While this incident was reported by a number of major international newspapers,
there was significant censorship in the country’s largest daily Ultimas Notícias, an event
reported by a number of international news outlets 444http://articles.chicagotribune.com/2014-02-19/news/sns-rt-us-venezuela-protests-media-20140219_1_live-coverage-president-nicolas-maduro-news-channel-globovision/2 555http://www.nybooks.com/daily/2014/04/09/venezuela-protests-censorship/ 666https://panampost.com/marcela-estrada/2014/02/13/venezuela-opposition-rallies-end-in-bloodshed-riots/
. The day after the protests President Maduro announced that Colombian TV news channel NTN24, which had been the only station to broadcast the protests to within Venezuela, was being removed from the grid of Venezuelan cable operators for airing anti-government demonstrations. Fig. 4(b) shows a cluster of censored keywords detected by our method around February 18, 2014 in Venezuela, which well describes the populations involved (estudiante, chavistas, opositores, leopoldolopez) and the target of the demonstrations (nicolasmaduro).
6 Conclusion
In this paper, we have presented a novel unsupervised approach to identify censorship patterns in domestic news media using social media as a sensor. Through comprehensive experiments on semi-synthetic datasets, we showed that our approach outperforms popular anomalous subgraph detection methods: LTSS, EventTree, and NPHGS, especially when the perturbation intensity is low. Analyzing real-world datasets in Mexico and Venezuela during Year 2014 demonstrates that our approach is capable of accurately detecting real-world censorship patterns in domestic newspapers. In future work, we are interested in generalizing censorship detection to other countries and to undertake censorship forecasting.
References
- [1] G. Chin. Censorship of social media in china. Science, 345(6199):886–888, 2014.
- [2] S. Cook. The long shadow of chinese censorship: How the communist party’s media restrictions affect news outlets around the world. 2013.
- [3] A. Coskuntuncel. Privatization of governance, delegated censorship, and hegemony in the digital era: The case of turkey. Journalism Studies, pages 1–19, 2016.
- [4] A. A. C. et al. Social media censorship in times of political unrest-a social simulation experiment with the uk riots. Bulletin of Sociological Methodology/Bulletin de Methodologie Sociologique, 115(1):5–20, 2012.
- [5] A. O. et al. Comparing events coverage in online news and social media: The case of climate change. ICWSM, 15:288–297, 2015.
- [6] A. R. et al. Open domain event extraction from twitter. In Proc. KDD, pages 1104–1112. ACM, 2012.
- [7] C. H. et al. A nearly-linear time framework for graph-structured sparsity. In Proc. ICML, pages 928–937, 2015.
- [8] D. B. et al. Censorship and deletion practices in chinese social media. First Monday, 17(3), 2012.
- [9] F. C. et al. Non-parametric scan statistics for event detection and forecasting in heterogeneous social media graphs. In Proc. KDD, pages 1166–1175. ACM, 2014.
- [10] F. C. et al. A generalized matching pursuit approach for graph-structured sparsity. In Proc. IJCAI, pages 1389–1395, 2016.
- [11] G. K. et al. How censorship in china allows government criticism but silences collective expression. American Political Science Review, 107(02):326–343, 2013.
- [12] H. T. et al. Fast random walk with restart and its applications. In Proc. ICDM, pages 613–622. IEEE Computer Society, 2006.
- [13] K. W. et al. Jasmine: a real-time local-event detection system based on geolocation information propagated to microblogs. In Proc. CIKM, pages 2541–2544. ACM, 2011.
- [14] M. F. A. et al. Kuwaiti political cartoons during the arab spring: Agenda setting and self-censorship. Journalism, 16(5):630–653, 2015.
- [15] N. R. et al. ’beating the news’ with embers: forecasting civil unrest using open source indicators. In Proc. KDD, pages 1799–1808. ACM, 2014.
- [16] P. R. et al. Pockets of resistance: British news media, war and theory in the 2003 invasion of Iraq. Oxford University Press, 2013.
- [17] P. R. et al. Event detection in activity networks. In Proc. KDD, pages 1176–1185. ACM, 2014.
- [18] R. S. T. et al. Known unknowns: An analysis of twitter censorship in turkey. In Proceedings of the 14th ACM Workshop on Privacy in the Electronic Society, pages 11–20. ACM, 2015.
- [19] S. P. et al. Can twitter replace newswire for breaking news? 2013.
- [20] T.-W. K. et al. Maximizing submodular set function with connectivity constraint: Theory and application to networks. IEEE/ACM Transactions on Networking (TON), 23(2):533–546, 2015.
- [21] Y. G. et al. Multimedia social event detection in microblog. In MMM, pages 269–281. Springer, 2015.
- [22] D. B. Neill. An empirical comparison of spatial scan statistics for outbreak detection. International journal of health geographics, 8(1):1, 2009.
- [23] D. B. Neill. Fast subset scan for spatial pattern detection. Journal of the Royal Statistical Society: Series B (Statistical Methodology), 74(2):337–360, 2012.
- [24] P. Seib. Beyond the front lines: How the news media cover a world shaped by war. Springer, 2016.