From bad metal to Kondo insulator: temperature evolution of the optical properties of SmB6
Abstract
The recent rekindling of interest in the mixed valent Kondo insulator SmB6 as candidate for a first correlated topological insulator has resulted in a wealth of new experimental observations. In particular, angle-resolved photoemission experiments have provided completely new insights into the formation of the low temperature Kondo insulating state starting from the high temperature correlated metal. Here, we report detailed temperature and energy dependent measurements of the optical constants of SmB6 in order to provide a detailed study from the point of view of a bulk sensitive spectroscopic probe. We detect a previously unobserved infrared active optical phonon mode, involving the movement of the Sm ions against the boron cages. The changes taking place in the free carrier response with temperature and their connection to changes in optical transitions between different bands are discussed. We find that the free charge density starts to decrease rapidly below approximately 200 K. Below 60 K a small amount of spectral weight begins to accumulate in low lying interband transitions, indicating the formation of the Kondo insulating state; however, the total integrated spectral weight in our experimental window ( eV) decreases. This indicates the involvement of a large Coulomb interaction ( 5 eV) in the formation of the Kondo insulator.
I Introduction
The enormous interest in SmB6 as the first realization of a correlated topological insulator (or in this case more precisely a topological Kondo insulator Dzero et al. (2010, 2016)), has resulted in a wealth of new information on its electronic properties and the formation of the Kondo insulating state. In a concerted effort to detect the predicted surface states, several angle-resolved photoemission spectroscopy (ARPES) experiments Jiang et al. (2013); Zhu et al. (2013); Denlinger et al. (2013); Frantzeskakis et al. (2013); Xu et al. (2014a, b); Min et al. (2014); Denlinger et al. (2014), transport experiments Wolgast et al. (2013); Kim et al. (2013); Zhang et al. (2013); Syers et al. (2015); Luo et al. (2015); Chen et al. (2015); Tan et al. (2015), and scanning tunneling microscopy (STM) experiments Ruan et al. (2014); Rossler et al. (2014) have been performed. At the same time, fine tuning of the crystal growth conditions as well as comparisons between growth methods have been reportedHatnean et al. (2013); Bao et al. (2013); Phelan et al. (2016), making it worthwhile to also revisit bulk sensitive probes such as optical spectroscopy. Previous optical studies Kierzek-Pecold (1969); Allen et al. (1978); Gorshunov et al. (1999); Sluchanko et al. (2000); Nanba et al. (1993); Hudáková et al. (2004); Travaglini and Wachter (1984) have provided important information on the formation of the Kondo insulating state.
In this article we report reflectivity measurements of SmB6, and present an analysis of the optical conductivity and dielectric function derived from them. As the temperature below which surface states are expected to become detectable is below the lowest temperature achievable in our setup, we instead focus on the changes in the optical spectra related to the formation of the Kondo insulating state. The room temperature spectra are characterized by an incoherent metallic response and several interband transitions. The interband transitions can be related to LSDA+ calculations Antonov et al. (2002), where Sm has been taken to have both a 2+ and 3+ valence, providing an indirect signature of the mixed valence state of Sm. We also observe for the first time an infrared mode at 19.4 meV that we associate with the motion of Sm ions against the B6 cages. As temperature is decreased, the incoherent metallic response first becomes more coherent but then collapses below approximately 60 – 70 K. The total amount of spectral weight lost in the metallic response corresponds to approximately 0.076 carriers per SmB6 unit and is not recovered in the entire energy range of the experiment (4.35 eV). Based on a simple calculation we rule out kinematic effects associated with the hybridization gap as the cause for the lost spectral weight. Instead, we suggest that strong correlation effects, associated with the effective Coulomb interaction , are responsible for the transfer of spectral weight to very high energies that has thus far not been observed in mixed valent Kondo insulators.
The paper is organized as follows: in Sec. II we discuss the experimental details and present an overview of the main optical features that can be directly inferred from the reflectivity data. In Sec. III.1, we present the optical response functions and present an identification of the main features. A detailed analysis of the transfer of spectral weight is presented in Sec. III.2. (Our toy model calculations are presented in Appendix B.) Finally, in Sec. IV we provide a brief summary and concluding remarks.
II Methods.
A single crystal boule was grown by the floating-zone technique, as detailed previously in Ref. [Bao et al., 2013]. To obtain a large mirror-like surface, we first oriented the as-grown boule using Laue diffraction. We then made a slit using spark erosion, cutting on the side of the crystal along the (100) oriented plane and subsequently cleaved the crystal just before inserting it in our UHV cryostat. This resulted in a large (5 mm diameter) flat surface oriented perpendicular to the [001] direction.
The reflectivity of SmB6 was measured as a function of photon energy (4 meV – 4.35 eV) and temperature (14 – 300 K) with 2 K steps. The measurements were performed using a Bruker vertex 80v Fourier-Transform infrared spectrometer. The crystal was mounted in a high-vacuum cryostat ( mbar) that includes in - situ evaporators to cover the sample with a reference layer. Different materials (e.g. Au, Ag, Al) have been used as reference layers for different frequency ranges. A detailed description of the experimental procedures, which we used to calibrate the obtained reflectivity, are given in Ref. [Tytarenko et al., 2015].
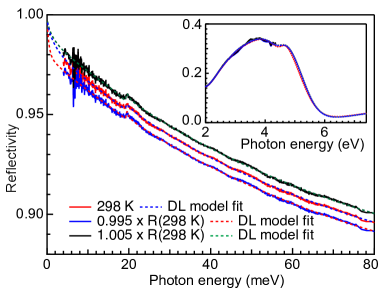
Reflectivity spectra for selected temperatures are shown in Fig. 1. Figure 1a shows the reflectivity over the full spectral range measured. The most prominent changes as function of temperature take place in the low frequency part of the spectrum (displayed in Fig. 1b). However, at higher photon energies a clear shift of the plasma edge is visible between 1 and 2 eV. Above the plasma edge several structures in the reflectivity point to interband transitions. Figure 1b shows the reflectivity below 0.2 eV, where the effects due to the formation of the Kondo state at low temperature are most prominent. Overall the spectral features agree with previously published data Travaglini and Wachter (1984); Nanba et al. (1993); Gorshunov et al. (1999); Hudáková et al. (2004), but there are also significant differences as we will discuss further below. At room temperature the reflectivity scales according to the expectation for a metal, namely as (i.e. Hagen - Rubens behavior), with the DC conductivity. We extracted by fitting the Hagen-Rubens relation to the low energy . It agrees to within a factor 2-3 with the DC resistivity measured on a different crystal taken from the same boule (data reported in Ref. [Frantzeskakis et al., 2013]).
At room temperature, Hagen-Rubens (HR) behavior persists up to about 12 meV, but we expect the HR scaling to eventually break down below a certain temperature due to the opening of the hybridization gap. We estimate this temperature scale as follows: we fit the low frequency reflectivity to the relation and determine and . The functions and in the Hagen-Rubens limit. From we obtain , while a deviation of from 1 is taken as an indication for the opening of the hybridization gap. We can directly compare obtained from our fits to the temperature dependent resistivity reported in Ref. [Frantzeskakis et al., 2013]. Apart from a (temperature independent) scaling factor 2.7, we obtain excellent agreement between these two measurements if we restrict the photon energy range used in the HR fit from the lower limit of the data (4 meV) up to 12 meV. The temperature dependence of obtained in this case is shown in the inset of Fig. 1a. The blue shaded area indicates the dependence of resulting from varying the upper bound of the photon energy range (6 meV – 30 meV) included in the fits. Based on the departure of from one, we estimate that the metallic response persists down to approximately 60 - 70 K, which is in good agreement with estimates of the onset temperature for the formation of the Kondo groundstate Caldwell et al. (2007). We note that this onset temperature increases to about 100 K if we include the frequency range up to 30 meV, but in this case the agreement with the measured is lost around 150 K.
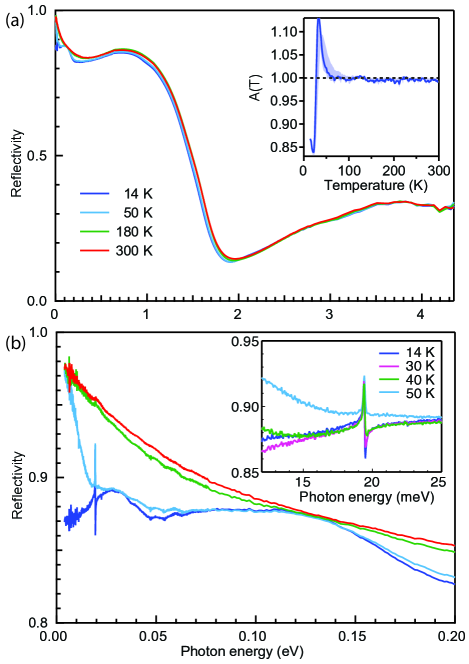
Before proceeding with further analysis we highlight a few observations that can be gleaned directly from the reflectivity data itself. With decreasing temperature several minima develop in the reflectivity spectra. An isobestic point (i.e. a frequency where the reflectivity is temperature independent) is visible at 0.13 eV. Both above and below this energy, minima start to develop as temperature is lowered. As we will see below, both minima roughly correspond to interband transitions. As temperature decreases below 60 K, a third minimum develops at the lowest measured energies (starting to become visible around 20 meV in the 50 K spectrum).
Another feature that becomes more prominent with decreasing temperature is a phonon mode around 19.4 meV, as shown in the inset of Fig. 1b. This mode has been observed for other hexaborides Kimura et al. (1991); Degiorgi et al. (1997); Ott et al. (1997); Vonlanthen et al. (2000); Werheit et al. (2000); Cho et al. (2004); Perucchi et al. (2004); Kim et al. (2005) and according to the symmetry of the crystal structure should be the mode. This mode has thus far not been seen in the IR spectra of SmB6 Travaglini and Wachter (1984); Nanba et al. (1993); Gorshunov et al. (1999); Hudáková et al. (2004), attesting to the high quality of our single crystal. A symmetry ‘forbidden’ excitation was observed in recent Raman experiments Nyhus et al. (1995); Valentine et al. (2016) with a similar energy as our phonon mode and we suggest that the mode observed in the Raman spectra could thus be interpreted as part of the IR optical phonon branch observed here. We note that the mode becomes more prominent in the reflectivity spectra at low temperature due to ‘unscreening’. Specifically, the oscillator strength associated with this mode remains more or less temperature independent, but with decreasing temperature the free charge carrier density is reduced resulting in less effective screening of the mode. Finally, we note a weak but noticeable Fano-like asymmetry for this feature that becomes more prominent as the hybridization gap opens, similar to what has been observed in FeSi Damascelli et al. (1997).
III Results
Next we turn our attention to the complex optical response functions. These were obtained from the reflectivity data using a Kramers-Kronig consistent variational routine Kuzmenko (2005). When applied to reflectivity data, this approach is equivalent to a Kramers-Kronig transformation, but with slightly modified low and high frequency extrapolations (see appendix A). We obtain all relevant optical quantities such as the complex optical conductivity and dielectric function from the resulting variational dielectric function model.
III.1 Complex optical conductivity
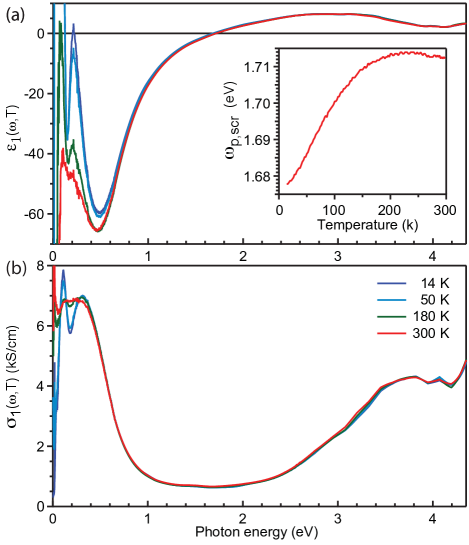
Figure 2 presents the real part of the optical constants of SmB6 over the entire measured frequency range. In panel 2a we show the dielectric function and in panel 2b the optical conductivity for the same temperatures as the reflectivity data in Fig. 1. At room temperature, the dielectric function resembles that of a typical metal: negative at low energy and, with the exception of a structure around 125 meV, monotonically increasing as a function of energy. We observe a zero crossing around 1.7 eV at all temperatures, corresponding to the screened plasma frequency, . The inset of panel 2a shows that decreases with temperature. This decrease is gradual at higher temperatures, but it starts to accelerate below roughly 200 K. We note that at lower temperatures the dielectric function displays several additional zero crossings, which we will discuss further below.
At photon energies larger than , remains positive with structures up until the highest measured frequencies. In this range (3 - 4 eV), the optical conductivity (Fig. 2b) shows a strong interband transition. The origin of this transition is not entirely clear. According to LSDA+ calculations it can have a different interpretation depending on the assumed Sm valence Antonov et al. (2002). If a divalent Sm2+ configuration is assumed, the transition involves mostly B 2 Sm 5. Alternatively, it corresponds to a mixture of B 2 Sm 5 and Sm 5 Sm 4 transitions in the case of trivalent Sm3+. We further observe two weak structures in the optical conductivity around 1.5 and 2 eV. These transitions are not explicitly described in Ref. [Antonov et al., 2002], but the calculated optical conductivity for the Sm3+ configuration does show a sharp structure in this range. They seem to originate from transitions between Sm 5 Sm 5-4 states and are exclusive to the trivalent Sm3+ configuration. Our data therefore support the presence of some Sm3+ in the system.
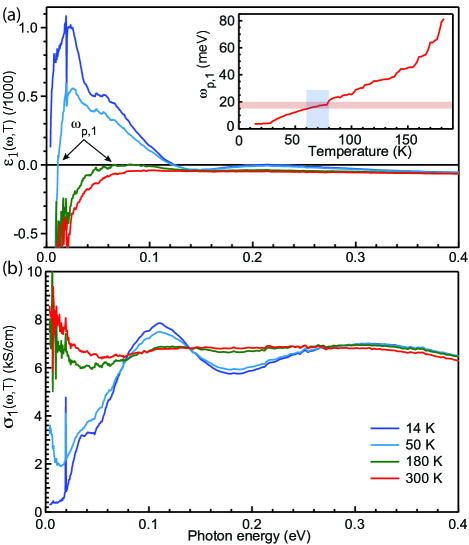
Figure 3 presents a more detailed view on and at low photon energy, which allows for a more careful examination of the temperature dependence in this range. At room temperature the dielectric function in this photon energy range is always negative; however, as temperature is decreased below 180 K, a new zero-crossing appears, labeled . If we decrease temperature further, becomes positive over an extended range. Figure 3b shows that for temperatures between room temperature and 180 K the main change in the optical conductivity is a reduction in the spectral weight of the Drude peak. We will discuss the detailed evolution of the Drude spectral weight in the next section. Here we would like to point out that the Drude peak has been completely suppressed at 14 K pointing to the formation of a gap in the energy spectrum at the Fermi level. Below 180 K two transitions become more prominently visible in : one around 0.11 eV and another around 0.32 eV, and both increasing in spectral weight as temperature decreases. At much lower temperatures a third transition becomes evident in around 0.04 eV.
There are several possible origins for these three peaks. The LSDA+ calculations of Ref. [Antonov et al., 2002] again predict several interband transitions in the photon energy range below 1 eV, depending on the Sm valence. However, several aspects of this interpretation should be noted: First, the experimental transition around 0.3 eV seems to stem mostly from occupied, mixed - 5-states for the Sm2+ configuration, but it may also contain a component related to Sm 5 4 transitions for the Sm3+ configuration. Compared to the experimental data reported in Ref. [Nanba et al., 1993], the centre of this transition is somewhat lower in energy in our case. If this transition indeed has contributions from both Sm2+ and Sm3+, this reduction in the centre of the transition could be understood as arising from a different average valence and indicating a larger Sm2+ component for our experiments. This hypothesis is further corroborated by the transition that we observe around 0.11 eV. This transition is also present in the experimental data of Ref.’s [Gorshunov et al., 1999] and [Nanba et al., 1993], but in those experiments the transition is much weaker relative to the transition at 0.3 eV, whereas in our case it is much more prominent. According to Ref. [Antonov et al., 2002], this transition is between occupied, mixed states and unoccupied Sm 5 states that are exclusive to the Sm2+ configuration. The second aspect of note is that Antonov et al. predict that the lowest lying interband transitions occur around 50 meV and are between various hybridized Sm 5 bands exclusive to the Sm3+ configuration. This matches well with the structure that we see evolving with temperature just above the optical gap. As might be expected, the lowest energy transitions are most strongly affected as function of temperature as these bands involve transitions directly between hybridizing bands.
We conclude this section with some remarks concerning the appearance of the additional zero-crossings in at low temperature, and in particular the low energy crossing labeled . As the inset of panel 3a shows, this crossing first appears below 180 K and quickly shifts to lower energy with decreasing temperature. It disappears below the lower limit of our experimental range below K, but we are still able to infer its approximate energy position from our Drude-Lorentz model. The low temperature value, (18 K) = 3.5 meV, agrees reasonably well with the zero crossing reported in Gorshunov et al. (Ref. [Gorshunov et al., 1999]). Although the temperature dependence of does not show signs of changes at a particular temperature, a specific temperature scale can be defined as follows. With decreasing temperature the low energy spectral weight starts to decrease and an optical gap begins to form. As Fig. 3b shows, the hybridization gap appears to have completely formed around 50 K (based on the appearance of the low energy peak around 0.04 eV). We estimate that the optical gap is approximately 15 to 20 meV wide, based on the 14 K spectrum and using the onset of absorption just below the phonon mode as a measure. In the inset of Fig. 3a we indicate the approximate size of the optical gap as the red shaded area and note that the zero crossing in falls below the gap edge at low temperature. The temperature range where this happens is indicated by the blue shaded area and spans the temperature range 60 - 80 K.
III.2 Spectral weight transfer
Having identified the main features of the optical response functions, we now turn our attention to the somewhat more subtle changes in their temperature evolution by presenting an analysis of spectral weight transfers associated with the destruction of the metallic state and the formation of the hybridization gap. As temperature decreases the hybridization of the and states is expected to result in the formation of an energy gap near (or at) the Fermi level Martin and Allen (1979). The formation of this state takes place at the cost of mobile -electron states in favor of a larger occupation of -electron states and a reduction of the Drude spectral weight results. This can be quantified by examining the partial integrated spectral weight,
When applied to materials where the optical properties change as function of an external parameter, the integral is often restricted to finite frequency intervals in order to detect associated transfers of spectral weight. The energy range over which these transfers take place can provide information on the interactions involved in the transition Katsufuji et al. (1995); Rozenberg et al. (1996); Molegraaf et al. (2002).
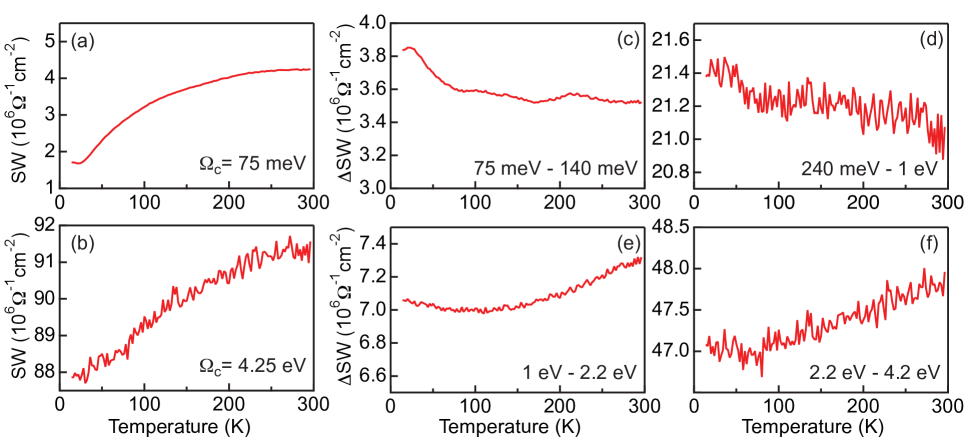
Inspection of Fig. 2 and Fig. 3, allows us to anticipate approximately the relevant energy ranges. The low energy range is defined by 0 meV and 75 meV and the temperature dependence of the in this range is shown in Fig. 4a. The integrated spectral weight continuously decreases as the temperature is lowered. Assuming that this depletion can be ascribed entirely to a collapse of the Drude peak, we use as an estimate of the free carrier density at room temperature. From Fig. 4a we obtain 9850 cm-1, which corresponds to cm-3 assuming that there is no mass renormalization (e.g. assuming at room temperature). This value is in good agreement with early estimates of the room temperature carrier density Allen et al. (1979). The error bar on this number was determined using the method presented in appendix C. If we express this in terms of carriers per formula unit, we find that the loss of spectral weight with decreasing temperature corresponds to 0.076 carriers per SmB6 unit. This reduction is in close agreement with a reduction of the Sm valence observed in temperature dependent x-ray absorption measurements Mizumaki et al. (2009), where the estimated average valence of the Sm ions changes from 2.58 at room temperature to 2.5 at low temperature.
One expects that the Drude weight decreases in a simple semiconductor with the chemical potential inside the band gap (or very close to the bottom/top of a band) as a result of changes in the available phase space for scattering and the thermal distribution of free carriers. In SmB6 at intermediate temperatures the chemical potential sits very close to the hybridization zone between the mobile band and the localized -levels, while at low temperature the hybridization gap opens at the Fermi level as evidenced by the optical gap. The loss of spectral weight could therefore result from a similar kinematic effect as that occurring in semiconductors. In appendix B we calculate the temperature dependence of the optical constants for such a scenario.
Applying the same analysis of the spectral weight to the calculated optical conductivity shows that the Drude spectral weight is transferred in the energy range just above the optical gap such that the total spectral weight remains constant. This is not the case for SmB6 as Fig. 4b shows. If we integrate the optical conductivity over the entire range measured, we find that the total integrated spectral weight decreases with about the same amount. This indicates that a significant amount of Drude spectral weight is being redistributed to energies well above eV. Moreover, this effect is well beyond what is expected due to simple kinematic effects associated with the opening of the hybridization gap. This situation is somewhat reminiscent of spectral weight transfers taking place in the cuprate high Tc superconductors Molegraaf et al. (2002). In the cuprates spectral weight is transferred from low energy to the scale of the effective Coulomb interaction ( 2-3 eV in the cuprates) as the superconducting gap opens. For the case at hand, the on-site Coulomb interaction was estimated to be 7 eV Antonov et al. (2002). This is beyond our experimental window; however, a previous optical experiment by Kimura et al. Kimura et al. (1994) indeed shows interband transitions around 5 and 10 eV.
Our spectral weight analysis suggests that the hybridization between and states involves energy scales on the order of the effective Coulomb interaction. Surprisingly, almost all of the Drude spectral weight lost in the formation of the Kondo insulating state is transferred to this high energy scale. The stark contrast between the spectral weight redistribution in the experiment and the tight-binding model perhaps serves as an illustration of the idea Martin and Allen (1979) that the Kondo insulator can be understood as the large version of a hybridized band insulator. The effective Kondo interaction becomes small in the large limit. Transfers of spectral weight involving large energy ranges have been observed in several other Kondo insulators Bucher et al. (1994); Schlesinger et al. (1993), which therefore seems a generic feature associated with the formation of the Kondo insulating state. The loss of spectral weight can therefore be seen as a signature of strong electron-electron interactions and the energy scale over which it is recovered as a measure of the effective Coulomb interaction.
The remaining panels of Fig. 4 demonstrate that the overall reduction of spectral weight is masking more subtle shifts in spectral weight. For example, the spectral weight of the interband transition around 0.11 eV increases at low temperatures, as is clearly visible in Fig. 3b. To estimate if this is the pile-up of spectral weight just above the gap edge anticipated above, we calculate the partial sum rule, , integrated from 75 meV to 140 meV (Fig. 4c). Here we observe a different trend in spectral weight as function of temperature: the spectral weight contained in this transition remains more or less constant as function of temperature down to approximately 60 - 70 K, where the spectral weight suddenly begins to increase. This temperature is close to the temperature where the reflectivity starts to deviate from Hagen-Rubens behavior (see Fig. 1a), suggesting that the enhancement of this transition is indeed related to the opening of the hybridization gap. Note, however, the difference in SW scales. The total Drude spectral weight lost is cm-2, while the increase of spectral weight around 0.11 eV is of the order of cm-2 (panel 4c). We find a similar increase in the range between 0.24 eV and 1 eV (panel 4d). between 1 eV and 2.2 eV (Fig. 4e) is relatively weak, with a change in slope observed as function of temperature. Finally, panel, 4f, shows in the range between 2.2 and 4.2 eV. The spectral weight in this transition mostly decreases with temperature, but a similar change in slope can be observed around 60 - 70 K, resulting in a small increase of spectral weight of again cm-2. To summarize, the total spectral weight decreases, but we observe a small increase in spectral weight in all of the interband transitions as the Kondo insulating state forms. In appendix C we show that this result is robust against substantial shifts of the experimental reflectivity data and corresponding changes in the spectral weight analysis.
As discussed above, the interband transitions at 0.11 eV and 0.32 eV contain a significant component originating from mixed 5 transitions. The increase in spectral weight below 60 - 70 K can therefore possibly be linked to changes taking place in the hybridization of the and states. In recent ARPES works the temperature dependence of the hybridization was investigated in detail Min et al. (2014); Denlinger et al. (2013). It has been observed that one of the -levels shifts from above (low temperature) to below (high temperature) the Fermi level. The temperature where this state crosses the Fermi level is approximately 60 K, very close to the temperature where we observe changes taking place in (i) the low energy reflectivity and (ii) the temperature dependence of the integrated spectral weight. It is possible that the small feature at 0.04 eV just above the gap edge (see Fig. 3b) arises from interband transitions between these occupied and unoccupied mixed states, as the energy matches reasonably well with the splitting observed in Ref. [Denlinger et al., 2013]. Comparing to our toy-model calculation, this then implies a hybridization parameter of approximately 20 meV. These authors also notice a second effect: namely a loss of the ‘coherency’ of the -states with increasing temperature. This change in coherence (observed as changes in the 4 - amplitude and width in the ARPES spectra) is a gradual trend however and not particularly linked to an onset temperatureDenlinger et al. (2013). It is likely that these changes in coherence are reflected in the smearing of spectral features in the optical spectra.
IV Summary
We have investigated the temperature dependent optical properties of SmB6 in detail. From the reflectivity data we estimate that the high temperature metallic state is destroyed below 60 - 70 K. A new feature observed in the reflectivity data is a phonon mode with an energy of 19.4 meV, which is related to the T1u mode associated with the rattling of the Sm ion against the boron cages. An analysis of the optical spectra shows that the destruction of the metallic state is a gradual trend, with an approximate onset temperature around 200 K. A comparison of the measured interband transitions and LSDA+ calculations indicates the presence of ions with varying valence in this material. The destruction of the metallic state is accompanied by a loss of low energy (Drude) spectral weight that is not recovered in the experimental range measured. In contrast, a representative tight-binding model calculation shows that this spectral weight should be recovered on an energy scale corresponding to the hybridization strength of the and -states. Our analysis suggests that this spectral weight is instead shifted over an energy range involving the effective Coulomb interaction ( 7 eV). We suggest that this is a signature of the important role played by strong electron-electron interactions in this material.
V Acknowledgement
EvH would like to thank S.V. Ramankutty, M.S. Golden, Yu Pan and A. de Visser for fruitful discussions and the IoP for support. S.J. was supported by the University of Tennessee Science Alliance JDRD program; a collaboration with Oak Ridge National Laboratory
Appendix A Reflectivity extrapolations
The traditional method for obtaining the complex optical conductivity or dielectric function from reflectivity data is to make use of a Kramers-Kronig transformation. In such an approach the phase angle of the complex reflection coefficient is calculated by making use of the Kramers-Kronig relation to the measured reflectivity. In this case, extrapolations to low (zero) and high (infinite) frequency have to be made beyond the experimental range over which the reflectivity has been measured. Typical expressions for these extrapolations are the Hagen-Rubens approximation as discussed in section II for the low frequency extrapolation and these extrapolations always introduce some uncertainty in the resulting optical quantities. In our analysis we make use of a different approach that has been described in ref. [Kuzmenko, 2005]. When applied to reflectivity data alone, this approach is equivalent to a Kramers-Kronig transformation, but with slightly different extrapolations for low and high frequency.
The first step in this procedure is to fit the reflectivity spectrum at a given temperature with a Drude-Lorentz model.
An example of a fit of the room temperature and the low and high frequency ’extrapolations’ are shown in Fig. 5. The fitted curve shown is still without the variational function added on top of it. Note that the Drude-Lorentz model already provides a very accurate description of the reflectivity data. The second step in this procedure is to add a variational dielectric function on top of this model to reproduce all the detailed features (including noise) of the reflectivity spectrum. The full Drude-Lorentz + variational dielectric function model then provides full access to any of the optical quantities of interest.
There are two major advantages to this approach. The first is that there are no artifacts at the boundaries of the experimental data: the flexibility of the model allows for a smooth transition between extrapolation and experimental data. The second advantage is that some of the parameters are more robustly determined. For example, the value of is determined by the reflectivity data over a very broad energy range.
Appendix B Tightbinding Model
In order to examine the kinematic effects we considered a simple two-band tight-binding model designed to reproduce the salient features of the SmB6 optical spectra. The Hamiltonian is
| (1) | |||||
Here, is the band dispersion of the band; () is the electron creation (annihilation) operators for the band; is the hybridization parameter between and bands; and is the spin of the electron. Our two-band model then consists of a dispersive band , and a dispersionless (localized) band . The hybridization parameter between the two bands is momentum independent with . We then set () = () eV and = -15 meV, such that the band structure mimics approximately the band dispersion around the X-point of the Brillouin zone Lu et al. (2013). These bands hybridize with a hybridization parameter eV, resulting in a direct optical gap of 0.2 eV and an indirect gap of approximately 20 meV. We choose the hybridization parameter to be temperature independent as this is sufficient to demonstrate the energy range over which spectral weight is redistributed.
The optical conductivity is evaluated from the Kubo formula, in which the induced electric current density is approximated to be linear to the external field as , where are the cartesian directions, is the conductivity tensor; and and are the wavevector and energy of the applied field Mahan (1986). For optics, we take the limit. The detailed derivation of , including multiband effects, can be found in Ref. [Atkinson and Carbotte, 1995]. The real part of is given by
| (2) | |||||
where is the imaginary part of the electron Greens function , is the vertex function, is the Fermi-Dirac function, and is the volume of the crystal. Here, meV is a phenomenological broadening introduced by impurity scattering. The dielectric function is related to the conductivity by , where is the complex-valued optical conductivity with the imaginary part obtained from the Kramers-Kronig relations.
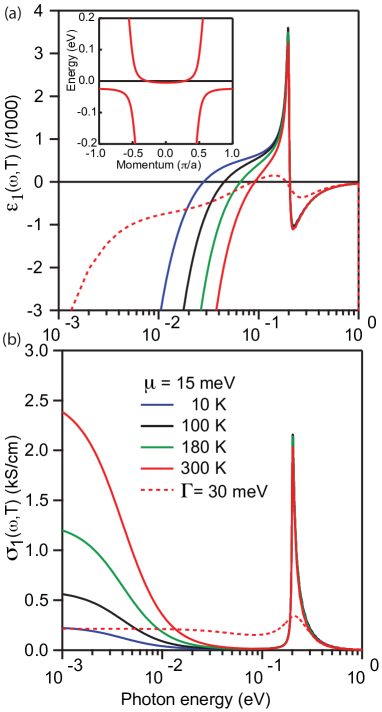
The calculated optical spectrum is shown in Fig. 6. Figure 6a shows the calculated dielectric function at selected temperatures. It captures the main features of the experimental spectrum: at low frequency there is a zero-crossing followed by an interband transition and then two more zero crossings (the zero crossing corresponding to the screened plasma frequency sits outside the calculated window). The model also captures the main temperature dependencies of the experimental data with the exception of the disappearance of the low frequency zero-crossing ( in the inset of Fig. 3a). Another difference is the broadening of the interband transitions with increasing temperature. This may be related to the temperature dependence of the scattering rate , which we have neglected here. Figure 6a also shows the optical spectrum calculated with an impurity broadening = 30 meV, providing a better agreement with the data at elevated temperature. Note that the increased broadening does not affect the energy of the zero-crossing.
The calculated optical conductivity is shown in Fig. 6b. At high temperatures the results display a clear Drude peak as expected. With decreasing temperature, the Drude peak is gradually suppressed, which is associated with larger occupation of the band bottom. This effect is large enough that the resistivity increases by an order of magnitude as temperature is reduced. It is obvious that the integrated spectral weight below 0.1 eV is significantly reduced at low temperature. Our calculations show that within the model, this spectral weight is redistributed to higher energies, and most of it is transferred to the interband transition centered at 0.2 eV. However, a few percent of the spectral weight is redistributed over a wider energy range comparable to the full bandwidth of the model.
Appendix C Error estimate spectral weight transfer
The accurate estimation of the absolute value of the integrated spectral weight is complicated and to some extent depends on choices made in the conversion of the experimental data (e.g. reflectivity) to the complex optical quantities. In appendix A we have already discussed the method used to extract the complex optical quantities. The purpose of this appendix is to show that the main conclusions of the article (i.e. a collapse of the Drude peak and the associated transfer of spectral weight over a large energy range to high energy) are a robust feature that do not depend significantly on the modeling choices made in our analysis. We will show that although the absolute value of the spectral weight is very sensitive to the specific model chosen, the relative value between different temperatures can be accurately determined.
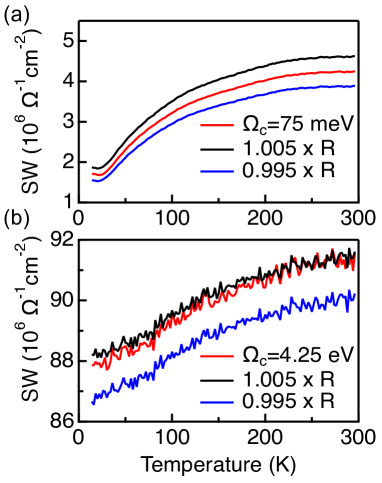
As a result of the highly detailed temperature dependence used to measure the reflectivity data over a very wide energy range, we can make a reasonable estimate of the error bar on our reflectivity spectrum. Even in the noisiest part of the spectrum (between 4 and 12 meV) the noise is only 0.4 of the total reflectivity. The systematic error bar on the data (0.2 ) can be estimated from the reproducibility of the many temperature sweeps performed (ranging from 2 cooling-warming cycles in the far infrared to up to 10 cycles in the UV range). To make an estimate of the error introduced in the determination of the spectral weight shifts we therefore follow the following procedure. We scale the reflectivity data up and down by 0.5 (constant for all temperatures and well beyond the actual error) as shown in Fig. 5. We then perform the full analysis to determine the spectral weight based on these scaled datasets. The results are summarized in Fig. 7. As expected, the Drude spectral weight (Fig. 7a) slightly increases if the reflectivity data is scaled upwards, while it decreases when the data is scaled downwards. The most important point however is that the relative change between room temperature is qualitatively unchanged and quantitatively very similar. The change amounts to an error of about 8 on the absolute value of the Drude weight. The same holds true if we calculate the integrated spectral weight up to a cutoff frequency = 4.25 eV. The error bar on the relative change between low and high temperature is about 3, but most importantly the total spectral weight decreases irrespective of the shift of the reflectivity data. Comparing panels (a) and (b) of fig. 7, we note that the redistribution of the additional Drude weight does not seem to result in an additional transfer of weight to energies beyond our experimental window. Instead this weight is already recovered in the interband transition between 3-4 eV.
References
- Dzero et al. (2010) M. Dzero, K. Sun, V. Galitski, and P. Coleman, Phys. Rev. Lett. 104, 106408 (2010).
- Dzero et al. (2016) M. Dzero, J. Xia, V. Galitski, and P. Coleman, Annu Rev. Cond. Matt. Phys. 7, 249 (2016).
- Jiang et al. (2013) J. Jiang, S. Li, T. Zhang, Z. Sun, F. Chen, Z. R. Ye, M. Xu, Q. Q. Ge, S. Y. Tan, X. H. Niu, et al., Nature Comm. 4, 3010 (2013).
- Zhu et al. (2013) Z. H. Zhu, A. Nicolaou, G. Levy, N. P. Butch, P. Syers, X. F. Wang, J. Paglione, G. A. Sawatzky, I. S. Elfimov, and A. Damascelli, Phys. Rev. Lett. 111, 216402 (2013).
- Denlinger et al. (2013) J. D. Denlinger, J. W. Allen, J. S. Kang, K. Sun, J. W. Kim, J. H. Shim, B. I. Min, D.-J. Kim, and Z. Fisk, arXiv: (2013), eprint 1312.6637v2.
- Frantzeskakis et al. (2013) E. Frantzeskakis, N. de Jong, B. Zwartsenberg, Y. K. Huang, Y. Pan, X. Zhang, J. X. Zhang, F. X. Zhang, L. H. Bao, O. Tegus, et al., Phys. Rev. X 3, 041024 (2013).
- Xu et al. (2014a) N. Xu, C. E. Matt, E. Pomjakushina, X. Shi, R. S. Dhaka, N. C. Plumb, M. Radovic, P. K. Biswas, D. Evtushinsky, V. Zabolotnyy, et al., Phys. Rev. B 90, 085148 (2014a).
- Xu et al. (2014b) N. Xu, P. K. Biswas, J. H. Dil, R. S. Dhaka, G. Landolt, S. Muff, C. E. Matt, X. Shi, N. C. Plumb, M. R. cacute, et al., Nature Comm. 5, 4566 (2014b).
- Min et al. (2014) C.-H. Min, P. Lutz, S. Fiedler, B. Y. Kang, B. K. Cho, H. D. Kim, H. Bentmann, and F. Reinert, Phys. Rev. Lett. 112, 226402 (2014).
- Denlinger et al. (2014) J. D. Denlinger, J. W. Allen, J.-S. Kang, K. Sun, B.-I. Min, D.-J. Kim, and Z. Fisk, in Proc. Int. Conf. SCES (SCES2013) (Journal of the Physical Society of Japan, 2014).
- Wolgast et al. (2013) S. Wolgast, Ç. Kurdak, K. Sun, J. W. Allen, D.-J. Kim, and Z. Fisk, Phys. Rev. B 88, 180405 (2013).
- Kim et al. (2013) D. J. Kim, S. Thomas, T. Grant, J. Botimer, Z. Fisk, and J. Xia, Sci. Rep. 3, 3150 (2013).
- Zhang et al. (2013) X. Zhang, N. P. Butch, P. Syers, S. Ziemak, R. L. Greene, and J. Paglione, Phys. Rev. X 3, 011011 (2013).
- Syers et al. (2015) P. Syers, D. Kim, M. S. Fuhrer, and J. Paglione, Phys. Rev. Lett. 114, 096601 (2015).
- Luo et al. (2015) Y. Luo, H. Chen, J. Dai, Z.-a. Xu, and J. D. Thompson, Phys. Rev. B 91, 075130 (2015).
- Chen et al. (2015) F. Chen, C. Shang, Z. Jin, D. Zhao, Y. P. Wu, Z. J. Xiang, Z. C. Xia, A. F. Wang, X. G. Luo, T. Wu, et al., Phys. Rev. B 91, 205133 (2015).
- Tan et al. (2015) B. S. Tan, Y. T. Hsu, B. Zeng, M. C. Hatnean, N. Harrison, Z. Zhu, M. Hartstein, M. Kiourlappou, A. Srivastava, M. D. Johannes, et al., Science 349, 287 (2015).
- Ruan et al. (2014) W. Ruan, C. Ye, M. Guo, F. Chen, X. Chen, G.-M. Zhang, and Y. Wang, Phys. Rev. Lett. 112, 136401 (2014).
- Rossler et al. (2014) S. Rossler, T. H. Jang, D. J. Kim, L. H. Tjeng, Z. Fisk, F. Steglich, and S. Wirth, Proc. Nat. Acad. Sc. 111, 4798 (2014).
- Hatnean et al. (2013) M. C. Hatnean, M. R. Lees, D. M. K. Paul, and G. Balakrishnan, Scientific Reports 3, 3071 (2013).
- Bao et al. (2013) L. H. Bao, O. Tegus, J. X. Zhang, X. Zhang, and Y. K. Huang, J. Alloys Compd. 558, 39 (2013).
- Phelan et al. (2016) W. A. Phelan, S. M. Koohpayeh, P. Cottingham, J. A. Tutmaher, J. C. Leiner, M. D. Lumsden, C. M. Lavelle, X. P. Wang, C. Hoffmann, M. A. Siegler, et al., Sci. Rep. 6, 20860 (2016).
- Kierzek-Pecold (1969) E. Kierzek-Pecold, Phys. Stat. Sol. (B) 33, 523 (1969).
- Allen et al. (1978) J. W. Allen, R. M. Martin, B. Batlogg, and P. Wachter, J. Appl. Phys. 49, 2078 (1978).
- Gorshunov et al. (1999) B. Gorshunov, N. Sluchanko, A. Volkov, M. Dressel, G. Knebel, A. Loidl, and S. Kunii, Phys. Rev. B 59, 1808 (1999).
- Sluchanko et al. (2000) N. E. Sluchanko, V. V. Ġlushkov, B. P. Gorshunov, S. V. Demishev, M. V. Kondrin, A. A. Pronin, A. A. Volkov, A. K. Savchenko, G. Grüner, Y. Bruynseraede, et al., Phys. Rev. B 61, 9906 (2000).
- Nanba et al. (1993) T. Nanba, H. Ohta, M. Motokawa, S. Kimura, S. Kunii, and T. Kasuya, Physica B 186, 440 (1993).
- Hudáková et al. (2004) N. Hudáková, P. Farkašovský, K. Flachbart, Y. Paderno, and N. Shitsevalova, Czech. J. Phys. 54, 339 (2004).
- Travaglini and Wachter (1984) G. Travaglini and P. Wachter, Phys. Rev. B 29, 893 (1984).
- Antonov et al. (2002) V. N. Antonov, B. N. Harmon, and A. N. Yaresko, Phys. Rev. B 66, 165209 (2002).
- Tytarenko et al. (2015) A. Tytarenko, Y. Huang, A. de Visser, S. Johnston, and E. van Heumen, Sci. Rep. 5, 12421 (2015).
- Caldwell et al. (2007) T. Caldwell, A. P. Reyes, W. G. Moulton, P. L. Kuhns, M. J. R. Hoch, P. Schlottmann, and Z. Fisk, Phys. Rev. B 75, 075106 (2007).
- Kimura et al. (1991) S.-i. Kimura, t. Nanba, S. Kunii, and T. Kasuya, J. Phys. Soc. Jpn. 61, 371 (1991).
- Degiorgi et al. (1997) L. Degiorgi, E. Felder, H. R. Ott, J. L. Sarrao, and Z. Fisk, Phys. Rev. Lett. 79, 5134 (1997).
- Ott et al. (1997) H. R. Ott, M. Chernikov, E. Felder, L. Degiorgi, E. G. Moshopoulou, J. L. Sarrao, and Z. Fisk, Z. Phys. B 102, 337 (1997).
- Vonlanthen et al. (2000) P. Vonlanthen, E. Felder, L. Degiorgi, H. R. Ott, D. P. Young, A. D. Bianchi, and Z. Fisk, Phys. Rev. B 62, 10076 (2000).
- Werheit et al. (2000) H. Werheit, T. Au, R. Schmechel, Y. B. Paderno, and E. S. Konovalova, J. Solid State Chem. 154, 87 (2000).
- Cho et al. (2004) B. K. Cho, J.-S. Rhyee, B. H. Oh, M. H. Jung, H. C. Kim, Y. K. Yoon, J. H. Kim, and T. Ekino, Phys. Rev. B 69, 113202 (2004).
- Perucchi et al. (2004) A. Perucchi, G. Caimi, H. R. Ott, L. Degiorgi, A. D. Bianchi, and Z. Fisk, Phys. Rev. Lett. 92, 067401 (2004).
- Kim et al. (2005) J.-H. Kim, Y. Lee, C. C. Homes, J.-S. Rhyee, B. K. Cho, S. J. Oh, and E. J. Choi, Phys. Rev. B 71, 075105 (2005).
- Nyhus et al. (1995) P. Nyhus, S. L. Cooper, Z. Fisk, and J. Sarrao, Phys. Rev. B 52, R14308 (1995).
- Valentine et al. (2016) M. E. Valentine, S. Koohpayeh, W. A. Phelan, T. M. McQueen, P. F. S. Rosa, Z. Fisk, and N. Drichko, arXiv: (2016), eprint 1601.02694v1.
- Damascelli et al. (1997) A. Damascelli, K. Schulte, D. Van Der Marel, and A. Menovsky, Phys. Rev. B 55, R4863 (1997).
- Kuzmenko (2005) A. B. Kuzmenko, Rev. Sci. Instrum. 76, 083108 (2005).
- Martin and Allen (1979) R. M. Martin and J. W. Allen, J. Appl. Phys. 50, 7561 (1979).
- Katsufuji et al. (1995) T. Katsufuji, Y. Okimoto, and Y. Tokura, Phys. Rev. Lett. 75, 3497 (1995).
- Rozenberg et al. (1996) M. J. Rozenberg, G. Kotliar, and H. Kajueter, Phys. Rev. B 54, 8452 (1996).
- Molegraaf et al. (2002) H. J. A. Molegraaf, C. Presura, D. Van Der Marel, P. H. Kes, and M. Li, Science 295, 2239 (2002).
- Allen et al. (1979) J. W. Allen, B. Batlogg, and P. Wachter, Phys. Rev. B 20, 4807 (1979).
- Mizumaki et al. (2009) M. Mizumaki, S. Tsutsui, and F. Iga, J. Phys.: Conf. Ser. 176, 012034 (2009).
- Kimura et al. (1994) S. I. Kimura, T. Nanba, S. Kunii, and T. Kasuya, Phys. Rev. B 50, 1406 (1994).
- Bucher et al. (1994) B. Bucher, Z. Schlesinger, P. C. Canfield, and Z. Fisk, Phys. Rev. Lett. 72, 522 (1994).
- Schlesinger et al. (1993) Z. Schlesinger, Z. Fisk, H.-T. Zhang, M. B. Maple, J. DiTusa, and G. Aeppli, Phys. Rev. Lett. 71, 1748 (1993).
- Lu et al. (2013) F. Lu, J. Zhao, H. Weng, Z. Fang, and X. Dai, Phys. Rev. Lett. 110, 096401 (2013).
- Mahan (1986) G. Mahan, Many-Particle Physics (plenum Press, 1986).
- Atkinson and Carbotte (1995) W. A. Atkinson and J. P. Carbotte, Phys. Rev. B 52, 10601 (1995).