A study of the low-luminosity Type II-Plateau supernova 2008bk
Abstract
Supernova (SN) 2008bk is a well observed low-luminosity Type II event visually associated with a low-mass red-supergiant progenitor. To model SN 2008bk, we evolve a 12 M⊙ star from the main sequence until core collapse, when it has a total mass of 9.88 M⊙, a He-core mass of 3.22 M⊙, and a radius of 502 R⊙. We then artificially trigger an explosion that produces 8.29 M⊙ of ejecta with a total energy of 2.51050 erg and 0.009 M⊙ of i. We model the subsequent evolution of the ejecta with non-Local-Thermodynamic-Equilibrium time-dependent radiative transfer. Although somewhat too luminous and energetic, this model reproduces satisfactorily the multi-band light curves and multi-epoch spectra of SN 2008bk, confirming the suitability of a low-mass massive star progenitor. As in other low-luminosity SNe II, the structured H profile at the end of the plateau phase is probably caused by Ba ii 6496.9 Å rather than asphericity. We discuss the sensitivity of our results to changes in progenitor radius and mass, as well as chemical mixing. A 15% increase in progenitor radius causes a 15% increase in luminosity and a 0.2 mag -band brightening of the plateau but leaves its length unaffected. An increase in ejecta mass by 10% lengthens the plateau by 10 d. Chemical mixing introduces slight changes to the bolometric light curve, limited to the end of the plateau, but has a large impact on colours and spectra at nebular times.
keywords:
radiative transfer - hydrodynamics - supernovae: general - supernovae: individual: SN 2008bk1 Introduction
Massive stars with an initial mass greater than 8 M⊙ are expected to end their lives with the gravitational collapse of their degenerate core. If a successful explosion follows, an H-rich progenitor leads to a Type II supernova (SN), the most frequently observed type of core-collapse SNe (Smith et al., 2011). These SNe are characterised by the presence of strong hydrogen Balmer lines in their optical spectra. Their high-brightness phase, which also coincides with the photospheric phase, lasts about one hundred days. Early simulations of such Type II SNe (Grassberg et al. 1971, Falk & Arnett 1977) suggest a progenitor star with a massive and extended H-rich envelope, as typically found in red-supergiant (RSG) stars. The physics underlying the evolution of a SN II-Plateau (II-P) has been extensively discussed by, for example, Falk & Arnett (1977) or more recently Utrobin (2007). The association between Type II-P SNe and RSG stars has also been more directly made through the identification of the progenitor star on pre-explosion images (see Smartt 2009 for a review).
Type II SNe exhibit a broad range in -band absolute magnitude, spanning about 5 mag during the photospheric phase and the nebular phase (Hamuy, 2003). The latter suggests a range of 10 in the mass of i ejected. The ejecta expansion rate inferred from P-Cygni profile widths halfway through the plateau also spans a range from 1000 to 8000 km s-1 (Hamuy, 2003), suggestive of a large scatter in the ratio of ejecta kinetic energy and ejecta mass . More recent surveys document this diversity further (Anderson et al., 2014; Faran et al., 2014a, b; Sanders et al., 2015; Galbany et al., 2015), and also emphasize, for example, the range in photospheric phase durations, the -band decline rate after maximum, how various radiative properties correlate.
The existence of low-luminosity (i.e., intrinsically faint) SNe II was well established in the 90s. SN 1997D was one of the first Type II to exhibit abnormally narrow P-Cygni profiles (of the order of 1000 km s-1) and a low optical brightness during the photospheric phase (always fainter than 14.65 mag in the -band; Turatto et al. 1998), both suggestive of a low energy explosion in an extended H-rich star. The sample of low-luminosity Type II SNe now includes a handful of objects (Pastorello et al., 2004; Spiro et al., 2014), with an absolute -band magnitude that covers from 14 to 15.5 mag around 50 d after explosion, thus 2 3 mag fainter than the prototypical Type II-P SN 1999em (Leonard et al., 2002). The fraction of low-luminosity SNe could be 5% of all Type II SNe (Pastorello et al., 2004).
Numerous radiation-hydrodynamic simulations of low-luminosity Type II SNe have been carried out. Constraints on the progenitor star and the ejecta (explosion energy, i mass) are obtained through iteration until a good match to the bolometric light curve and the photospheric velocity evolution. Utrobin et al. (2007) modelled the low-luminosity SN 2003Z and obtained an ejecta mass of 14 M⊙, an ejecta kinetic energy of 2.451050 erg, 0.006 M⊙ of i, and a progenitor radius of 230 R⊙. Spiro et al. (2014) used a similar approach and proposed progenitor masses in the range 10–15 M⊙ for the whole sample of low-luminosity SNe II. These results suggest that low-luminosity Type II SNe are intrinsically under-energetic and synthesize little i. Other studies have argued that these low-luminosity Type II SNe are the result of weak explosions in higher mass RSG stars. In this context, the low i mass arises from the significant fallback of material onto the proto-neutron star, associated potentially with the subsequent formation of a black hole.
Turatto et al. (1998) propose this scenario with a 26 M⊙ progenitor star for SN 1997D (Benetti et al., 2001), and argue against the possibility of a lower mass progenitor. Later work by Zampieri et al. (2003), using a semi-analytic modelling of the light curve, give support to the association with higher mass progenitors, in which the explosion is followed by fallback. The situation is therefore unsettled. For SN 1997D, Zampieri (2007) proposes a 14 M⊙ progenitor, which disagrees with Turatto et al. (1998). For the low-luminosity SNe II-P 2005cs and 2008bk, a progenitor detection exists and suggests a low/moderate mass massive star (in the range 9–13 M⊙ on the zero-age main-sequence, ZAMS; Maund et al. 2005; Li et al. 2006; Mattila et al. 2008; Van Dyk et al. 2012; Maund et al. 2014 ).
Even when an ejecta mass is inferred from light-curve modelling, estimating the corresponding progenitor mass on the main sequence is subject to error because of the uncertain mass loss history. Furthermore, the light curve modelling above is primarily sensitive to the H-rich ejecta mass, not the total ejecta mass. The helium core mass can only be estimated by modelling nebular phase spectra and the helium core dynamics (Dessart et al., 2010a; Dessart & Hillier, 2011; Maguire et al., 2012; Jerkstrand et al., 2012; Dessart et al., 2013).
In this work, we model the low-luminosity SN 2008bk because it is the best observed SN of this class of event, with a good photometric monitoring in the optical that started about a week after explosion (Pignata, 2013). Based on pre-explosion images and evidence of the disappearance of a source on post-explosion images, inferences have been made to constrain the nature of the progenitor star and its mass. The consensus is that it is a RSG star, although its inferred ZAMS mass differs somewhat between studies, with 8–8.5 M⊙ (Mattila et al. 2008; Van Dyk et al. 2012; see also Van Dyk 2013) and 11.1–14.5 M⊙ (Maund et al., 2014). In contrast, there has been little analysis of the SN spectroscopic and photometric data. A preliminary analysis is presented in Pignata (2013), who proposes an ejecta with 2.51050 erg, a total mass of 12 M⊙, and a i mass of 0.009 M⊙, together with a progenitor radius of 550 R⊙, Maguire et al. (2012) present an analysis of a nebular-phase spectrum at 547 d after explosion and propose a progenitor star with a main-sequence mass of 12 M⊙.
The simulations presented here are based on models of the progenitor evolution from the main-sequence until core collapse, together with the subsequent simulation of the piston-driven explosion including explosive nucleosynthesis. The bulk of the work lies, however, in the non-Local-Thermodynamic-Equilibrium (nLTE) time-dependent radiative-transfer modelling of the photometric and spectroscopic evolution of SN 2008bk. Since a low/moderate mass progenitor has been proposed by all former studies on SN 2008bk, we limit our investigation to a progenitor star of 12 M⊙ on the main sequence. In a forthcoming study, we will investigate the properties of the whole sample of low-luminosity Type II SNe, and consider progenitors from both low and high mass RSG stars.
In the next section, we summarise the source of observational data for SN 2008bk. In Section 3, we present our numerical approach for the modelling of the pre-SN evolution with mesa (Paxton et al., 2011, 2013, 2015), the explosion with v1d (Livne, 1993; Dessart et al., 2010b, a), and the modelling of the SN radiation from 10 d after explosion until nebular times with cmfgen (Hillier & Miller, 1998; Dessart & Hillier, 2005b, 2008; Hillier & Dessart, 2012; Dessart et al., 2013). Our best match model to the photometric and spectroscopic observations of SN 2008bk is presented in Section 4. In Section 5, we discuss the sensitivity of our results to changes in progenitor/ejecta radius (Section 5.1), progenitor mass (Section 5.2), and chemical mixing (Section 5.3). We conclude in Section 6.
2 Observational data
The optical and near-IR photometry that we use for SN 2008bk comes from Pignata (2013). For the spectroscopic data, we limit our analysis to the optical range, and use observations from Pignata as well as the spectropolarimetric observations of Leonard et al. (2012a, see also Leonard et al., in prep.). The spectropolarimetric data is, however, not accurately calibrated in flux (no flux standard was used during the observing night) so the corresponding spectra are used mostly to compare the morphology of line profiles (in practice, we distort the observed spectrum so that it has the same overall shape as the model at the same epoch; see Section 4).
Following the earlier estimate of a low reddening towards SN 2008bk (Pignata, 2013), we adopt an 0.02 mag. This is within 0.01 mag of the value reported by Schlegel et al. (1998) for the line-of-sight towards NGC 7793, the galaxy host of SN 2008bk. This suggests the source of extinction to SN 2008bk is exclusively galactic. Our reference model X (see below) gives a satisfactory agreement to the spectral and colour evolution of SN 2008bk but it overestimates its plateau brightness. This discrepancy is reduced with a larger reddening although an value greater than 0.1 mag causes a mismatch in colour.
We adopt the Cepheid-based distance modulus of 27.68 0.05 mag (internal error) 0.08 mag (systematic error) inferred by Pietrzyński et al. (2010). Finally, we adopt a recession velocity of 283 km s-1 for SN 2008bk, as inferred from nearby H ii regions (Pignata, private comm.).
By drawing an analogy between the light curves of SN 2008bk and SN 2005cs, Pignata (2013) proposes an explosion date of MJD 54548.0 2. Our best match model yields an improved agreement with observations if we adopt instead MJD 54546.0, which is within the uncertainty of Pignata’s choice.
3 Numerical setup
3.1 Pre-supernova evolution
Using in all cases an initial mass of 12 M⊙, we evolved several models from the main sequence to the gravitational collapse of the iron core using mesa version 7623 (Paxton et al., 2011, 2013, 2015). We used the default massive star parameters of mesa (those given in inlist_massive_defaults), except for the adjustments discussed below.
Models X, XR1, XR2, and XM were evolved at a metallicity of 0.02. Convection is followed according to the Ledoux criterion, with a mixing length parameter that varies between models, a semi-convection efficiency parameter 0.1, and an exponential overshoot with parameter 0.004. The mixing length parameter was adjusted to modulate the stellar radius at the time of death. In Dessart et al. (2013), we found that to reconcile the colour evolution of SNe II-P with observations, more compact RSG progenitors were needed. In mesa, this can be achieved by employing for a value larger than standard (the ‘standard’ used by default in mesa is 2.0) — by enhancing the efficiency of convection within the MLT formalism we allow the star to carry the core radiative flux through a denser/smaller envelope. Models X, XR1, and XR2 use a value of of 3, 2.5, and 2, respectively. For these three models, we enhanced the mass loss rate from the “Dutch” recipe by a factor of 2.5. This choice is to compensate for the lower mass loss rates that result from the higher effective temperatures of our more compact RSG models and also to reduce the final star mass to 10 M⊙ (originally motivated by the low progenitor masses of 8-8.5 M⊙ inferred by Mattila et al. 2008 and Van Dyk et al. 2012). In model XM, we use 3, but enhance the mass loss by a factor of 1.5 instead of 2.5 in order to obtain a higher mass model at death.
Model X is our best match model to the observations of SN 2008bk so these other models are computed to explore the sensitivity of our results to a number of evolution parameters. In a 12 M⊙ star, most of the mass loss occurs during the RSG phase. Hence, the modulations in the mass loss rate impact primarily the H-rich envelope mass and leave the He-core largely unaffected. As discussed later, 10% changes in H-rich envelope mass or progenitor radius can visibly impact the resulting SN radiation, although in different ways.
Model Y was computed as part of a separate effort (with mesa version 4723) and so uses slightly different parameters from the above set. It was evolved at a metallicity of 0.0162 with the ‘Dutch’ mass-loss recipe, with an enhancement factor of 1.4. Convection is followed according to the Ledoux criterion, with a mixing length parameter 3, a semi-convection efficiency parameter 0.1, and an exponential overshoot with parameter 0.008. Model Y is included here to discuss the effect of mixing (see next section) on the SN ejecta and radiation.
These various incarnations of a 12 M⊙ star yield similar stellar properties at the time
of core collapse. All models produce RSG stars at death with surface radii of 405–661 R⊙,
total masses of 9.46–11.01 M⊙, and He-core masses of 3.13–3.26 M⊙.
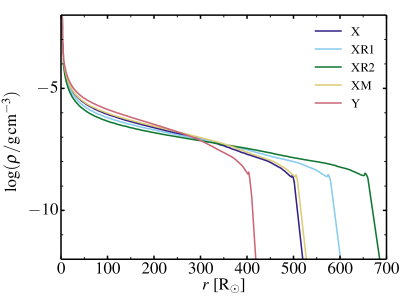
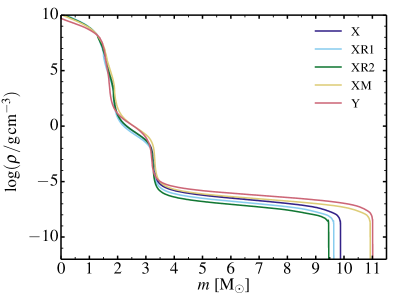
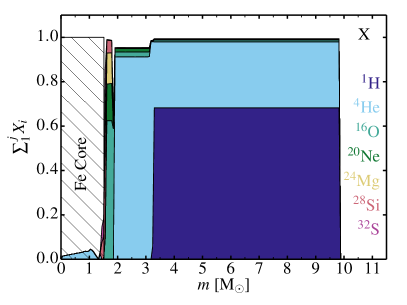
The progenitor density structure at collapse shows the typical RSG profile, with a high-density highly bound He core
and a low-density extended massive H-rich envelope (Fig. 1).
In such a low-mass massive star, there is only 0.2 M⊙ between the outer edge of
the iron core and the inner edge of the He-rich shell. The H-rich shell is about 7 M⊙, hence about 7 times
more massive than the He-rich shell.
| Model | Z | Fe core | CO core | He core | Ejecta | H-rich | H | He | O | i0 | |||||
|---|---|---|---|---|---|---|---|---|---|---|---|---|---|---|---|
| [R⊙] | [M⊙] | [K] | [L⊙] | [M⊙] | [M⊙] | [M⊙] | [M⊙] | [M⊙] | [M⊙] | [M⊙] | [M⊙] | [M⊙] | [1050 erg] | ||
| X | 0.02 | 502 | 9.88 | 3906 | 52733 | 1.53 | 1.86 | 3.22 | 8.29 | 6.66 | 4.54 | 3.24 | 0.22 | 8.57(-3) | 2.5 |
| XR1 | 0.02 | 581 | 9.63 | 3644 | 53436 | 1.50 | 1.85 | 3.20 | 8.08 | 6.43 | 4.38 | 3.17 | 0.19 | 8.19(-3) | 2.6 |
| XR2 | 0.02 | 661 | 9.45 | 3390 | 51770 | 1.60 | 1.85 | 3.19 | 7.90 | 6.26 | 4.25 | 3.13 | 0.22 | 9.00(-3) | 2.7 |
| X | 0.02 | 502 | 9.88 | 3906 | 52733 | 1.53 | 1.86 | 3.20 | 8.29 | 7.10 | 4.54 | 3.24 | 0.22 | 8.57(-3) | 2.5 |
| XM | 0.02 | 510 | 10.92 | 3943 | 56408 | 1.50 | 1.89 | 3.27 | 9.26 | 7.65 | 5.20 | 3.54 | 0.23 | 7.20(-3) | 2.7 |
| YN1 | 0.0162 | 405 | 11.01 | 4195 | 45715 | 1.38 | 1.73 | 3.15 | 9.45 | 7.86 | 5.41 | 3.74 | 0.09 | 1.00(-2) | 2.5 |
| YN2 | 0.0162 | 405 | 11.01 | 4195 | 45715 | 1.38 | 1.73 | 3.15 | 9.45 | 7.86 | 5.41 | 3.74 | 0.09 | 1.00(-2) | 2.5 |
| YN3 | 0.0162 | 405 | 11.01 | 4195 | 45715 | 1.38 | 1.73 | 3.15 | 9.45 | 7.86 | 5.41 | 3.74 | 0.09 | 1.00(-2) | 2.5 |
3.2 Piston-driven explosions
The mesa simulations were stopped when the maximum infall core velocity reached 1000 km s-1. At that time, we remapped the mesa model into v1d (Livne, 1993; Dessart et al., 2010b, a). The model was resampled onto a grid with a mass resolution of M⊙ at the base, increasing to 10-2 M⊙ at and beyond 2 M⊙. Within a few percent of the stellar surface, the mass resolution is progressively increased to have a surface resolution of M⊙. At the progenitor surface, we go down to a density of g cm-3 but ideally one should use an even lower value in order to have optically thin shells at the outer boundary where the shock breaks out.
The explosion is in all cases triggered by moving a piston at 10,000 km s-1 at the inner boundary, which we place at the location where the entropy rises outward from the center to 4 kB baryon-1 (see, e.g., Ugliano et al. 2012). This location is typically in the outer part of the Si-rich shell, just below the O-rich shell, and located around 1.55 M⊙ in these models. Because the explosion energy is low in our SN 2008bk models, some fallback of the order of 0.01 M⊙ may occur.
The explosion models were done iteratively until we obtained an ejecta in homologous expansion with the desired i mass of 0.009 M⊙ and total energy of 2.51050 erg (Pignata, 2013). Iteration is needed because the i mass is sensitive to the piston properties (location, speed) and to the magnitude of fallback. The asymptotic ejecta energy also depends on fallback.
In most of our simulations, we enforce a chemical mixing using a boxcar algorithm (see Dessart et al. 2012 for discussion) that affects all species. We also explore the impact of mixing only i (and substituting it with H to keep the mass fraction normalised to unity at each depth). Three levels of mixing are enforced, increasing from model YN1 to YN2 and YN3. These simulations and additional information on the mixed composition profiles are presented in Section 5.3.
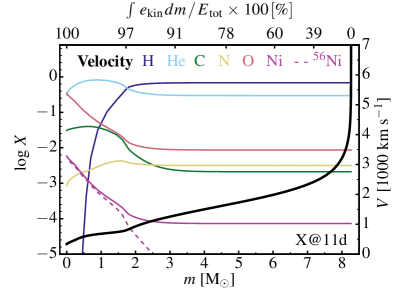
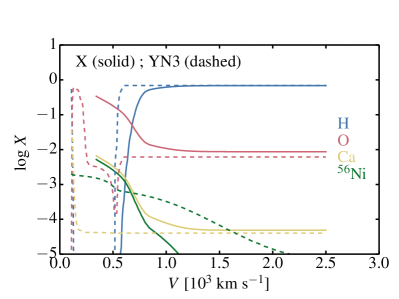
The ejecta properties of our model set are given in Table 1. We also show the composition profile for model X in mass and velocity space in Fig. 2.
| Model | i0 | (H) | |||||||||||
|---|---|---|---|---|---|---|---|---|---|---|---|---|---|
| [1050 erg] | [M⊙] | [d] | [erg s-1] | [erg s-1] | [mag] | [mag] | [mag] | [mag] | [km s-1] | [km s-1] | [km s-1] | [km s-1] | |
| (15 d) | (50 d) | (15 d) | (50 d) | (15 d) | (50 d) | (15 d) | (50 d) | (15 d) | (50 d) | ||||
| X | 2.5 | 8.57(-3) | 120 | 4.36(41) | 4.46(41) | –15.46 | –15.50 | –0.01 | 2.11 | 4833 | 2334 | 5362 | 4208 |
| XR1 | 2.6 | 8.19(-3) | 115 | 5.32(41) | 5.13(41) | –15.60 | –15.67 | –0.33 | 1.96 | 4854 | 2468 | 5344 | 4251 |
| XR2 | 2.7 | 9.00(-3) | 115 | 6.33(41) | 5.92(41) | –15.70 | –15.84 | –0.56 | 1.79 | 4685 | 2612 | 4887 | 3979 |
| X | 2.5 | 8.57(-3) | 120 | 4.36(41) | 4.46(41) | –15.46 | –15.50 | –0.01 | 2.11 | 4833 | 2334 | 5362 | 4208 |
| XM | 2.7 | 7.20(-3) | 120 | 4.23(41) | 4.53(41) | –15.43 | –15.51 | –0.01 | 2.10 | 4731 | 2323 | 5126 | 4101 |
| YN1 | 2.5 | 1.00(-2) | 140 | 3.16(41) | 3.81(41) | –15.16 | –15.30 | 0.41 | 2.29 | 4534 | 2177 | 5057 | 4197 |
| YN2 | 2.5 | 1.00(-2) | 140 | 3.15(41) | 3.81(41) | –15.16 | –15.30 | 0.41 | 2.31 | 4530 | 2182 | 5072 | 4200 |
| YN3 | 2.5 | 1.00(-2) | 140 | 3.13(41) | 3.75(41) | –15.16 | –15.27 | 0.44 | 2.49 | 4519 | 2194 | 5042 | 4555 |
3.3 Radiative-transfer modelling
When the ejecta reach homologous expansion, we remap each model into the nLTE time-dependent radiative-transfer code cmfgen (Hillier & Miller, 1998; Dessart & Hillier, 2005b, 2008; Hillier & Dessart, 2012; Dessart et al., 2013) to compute the subsequent evolution of the gas and the radiation until nebular times. The code computes the gas and radiation properties by solving iteratively the statistical equilibrium equations, the gas-energy equation, and the first two moments of the radiative transfer equation. Time-dependent terms are included in all equations. Non-thermal processes and thermal heating associated with radioactive decay are included. For each converged model, the code produces a spectrum with a sub-Å resolution that covers from the far-UV to the far-IR and from which one can extract the bolometric luminosity and various photometric magnitudes. It is thus the same tool that produces multi-band light curves and spectra. We can directly compare the multi-band light curves computed by cmfgen with the observed ones, constraining the reddening from the colour and spectral information.
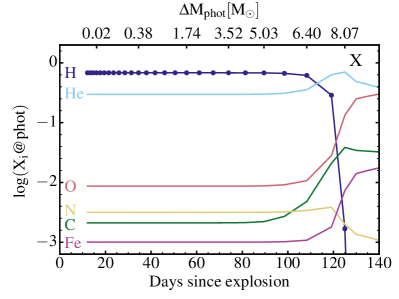
All time sequences with cmfgen are started at 11 d. The entire progenitor H-rich envelope is in homologous expansion by then, but not the slow moving He-core material. So, by enforcing homologous expansion, we modify slightly the velocity of the He-core material, i.e. in regions moving with 700-800 km s-1 (see Fig. 2). Homology requires that we reset the time to , which causes a shift to an earlier time by 0.5 d. This new time differs from the time elapsed since explosive nucleosynthesis took place, making the i and o masses incompatible. In practice, the o mass is overestimated by 10%, so the effect is minor. For consistency, we quote for each model an initial i masse inferred from the ejecta o mass at nebular times.
The cmfgen simulations use 100 grid points, which are placed to adequately resolve the variations in optical depth. This is an asset over a radiation hydrodynamics code like v1d, which uses a grid tied to the Lagrangian mass. With this choice, our cmfgen simulations resolve well the (moving) recombination fronts associated with H and He (see Dessart & Hillier 2010).
The numerical setup is comparable to that of Dessart et al. (2013). We use the same model atoms, with updates to the atomic data (in particular for Fe and Co) as described in Dessart et al. (2014). We treat the following ions: H i, He i- ii, C i- iv, N i- iii, O i-v, Ne i- iii, Na i, Mg i- iii, Si i- iv, S i- iv, Ar i- iii, K i, Ca i- iv, Sc i- iii, Ti ii- iii, Cr ii- iv, Fe i-vi, Co ii-vi, and Ni ii-vi.
We include only the radioactive decay from i and o – no other unstable isotope is considered in the present calculations.
In one instance, we recompute the model X at one time step with the addition of Ba ii in order to test the impact of that ion on the spectrum at the end of the photospheric phase (Section 4.2).
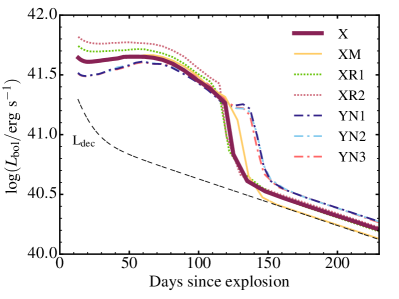
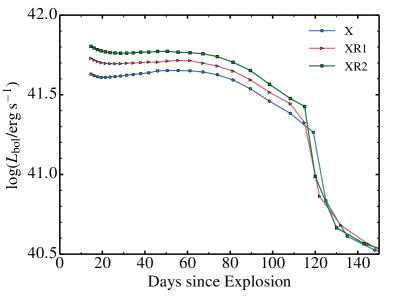
We show the bolometric light curve for all models in Fig. 3. The maximum “plateau” luminosity is in the range 10 erg s-1, and the plateau duration is in the range 120–140 d. Each model will be discussed in turn in the following sections, starting with a detailed presentation of model X, our best-match model to the observations of SN 2008bk. A summary of the results is presented in Table 2.
4 Properties of our best-match model to the observations of SN 2008bk
Model X stems from a 12 M⊙ main-sequence star evolved at solar metallicity and dying with a pre-SN radius of 502 R⊙. The resulting SN ejecta is 8.29 M⊙, with a kinetic energy of 2.51050 erg and 0.0086 M⊙ of i. These parameters do not yield a perfect match to observations of SN 2008bk and therefore do not correspond exactly to the progenitor and the ejecta of SN 2008bk, but they produce a reasonable match to the observations. In this section, we present the photometric and spectroscopic properties of model X. We also discuss the possible origin of the discrepancies and how they may be reduced to provide a better match.
4.1 Photometric properties
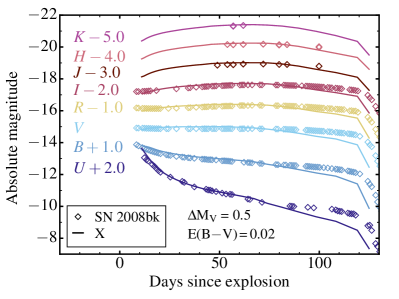
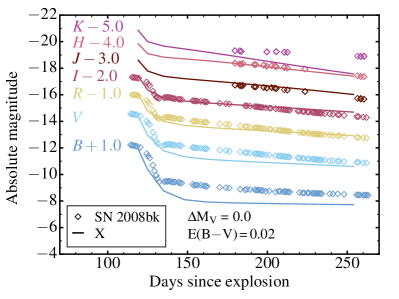
Figure 4 compares the optical () and near-IR () light curves of model X with the observations of SN 2008bk. A global magnitude offset (equivalent to a shift in distance modulus) has been applied because model X is somewhat too bright during the photospheric phase (the offset is of 0.5 mag, equivalent to a 60% overestimate in luminosity), and somewhat too faint during the nebular phase.
The overestimate of the plateau brightness suggests that model X is somewhat too energetic and/or its progenitor radius is somewhat too large (Section 5.1). The Cepheid-based distance to the galaxy hosting SN 2008bk is unlikely to be a sizeable source of error, but the adopted reddening may be underestimated. If we adopt a reddening 0.1 mag, the match to the colour evolution is somewhat degraded but the absolute offset is then reduced from 0.5 to 0.2 mag. At nebular times, model X is under-luminous in the and bands, but it matches satisfactorily the redder bands — most of the flux falls in the range 5000-10000 Å at nebular times. As we discuss in Section 5.3, the mixing has a large impact on the SN optical colors at nebular times. However, given the reasonable match to the filter bands where most of the flux falls (within the range 5000-10000 Å), the 0.0086 M⊙ mass of i in model X is satisfactory (given the adopted distance/reddening).
Leaving the color mismatch aside, Fig. 4 shows that the multi-band light curve of model X matches adequately the multi-band light curve evolution from the -band to the near-IR. The match to the steep drop in the band suggests the small progenitor radius of 502 R⊙ is roughly adequate, something that arises in the mesa simulation of the progenitor star from the adoption of an enhanced mixing-length parameter for convection (Dessart et al., 2013). As we discuss in Section 5.1, a change of 10-20% in progenitor radius has a visible impact on the colour evolution.
During the photospheric phase, the SN radiation is comparable to a blackbody modified by the effect of scattering, atmospheric extension, and line-blanketing, and it is mostly influenced by the global parameters of the progenitor star and explosion, namely , , and . These aspects seem to be properly modelled here. However, at nebular times (right panel of Fig. 4), the spectrum is less directly connected to , , and . Instead, it becomes primarily influenced by heating from radioactive decay and cooling from line emission. The spectrum is then more directly sensitive to chemical composition and mixing. It is therefore not surprising that model X can match better the photospheric phase than the nebular phase of SN 2008bk (see Section 5.3 for discussion).
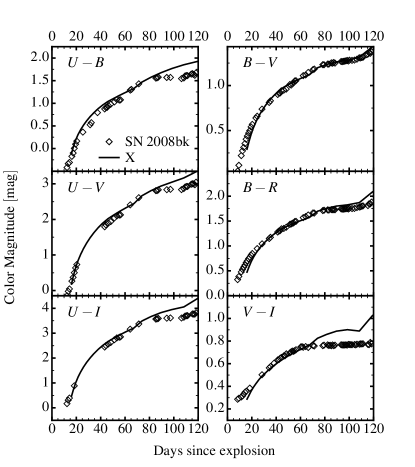
The colour evolution of model X during the photospheric phase is also in good agreement with the observations of SN 2008bk (Fig. 5). In Type II SNe, the color evolution is monotonic and follows the progressive decrease of the photospheric temperature (Fig. 6; see also Table 3), from the high temperature conditions at shock breakout until the recombination phase where the photospheric temperature is set by the recombination temperature of hydrogen. This phase starts in model X at 20–30 d and is associated with a flattening of the evolution of , which levels off at 5500 K — is then of the order of 1015 cm. This is in contrast to i powered SNe (e.g., SNe Ia, Ib, and Ic), in which decay heating leads to a non-monotonic evolution of the colour during the photospheric phase. A 0.1 mag colour offset appears at the end of the high-brightness phase (the model is too red), in particular for () — this is also visible in Fig. 4. This small offset may be related to the adopted mixing between the He-core and the H-rich envelope (which is treated crudely in our approach), an overestimate of line blanketing (perhaps connected to a problem with the atomic data, e.g., with Fe i; see next section), or a problem with the data reduction of the -band photometry (Pignata, priv. communication).
Compared to models of standard SNe II-P computed in the past with the same approach, model X is underluminous, with a typical bolometric luminosity of 1.1108 L⊙. For comparison, the 1.21051 erg s15 model of Dessart & Hillier (2011) had a plateau luminosity of 6108 L⊙ and the more compact progenitor model MLT3 of Dessart et al. (2013) had a plateau luminosity of 4108 L⊙. Both had the same photospheric temperature of 5500 K at the recombination epoch. Instead, model X differs from these more energetic explosions by a much reduced photospheric radius. Model X has a radius of 1015 cm, a factor of 2–3 times smaller than models s15 and MLT3.
Another interesting feature, shared by models X and the higher energy variants s15 and MLT3, is that at 50 d after explosion, the photosphere has not receded by more than 1 M⊙ below the progenitor surface (see also, e.g., Falk & Arnett 1977). This implies that when intrinsically polarised continuum radiation is observed soon after explosion in a SN II-P (Leonard et al., 2012b), the outermost ejecta layers have to be asymmetric.
The photospheric phase (i.e., when the ejecta Rosseland-mean or electron-scattering optical depth exceeds 2/3), or the high-brightness phase, correspond to epochs when the spectrum forms in the H-rich ejecta layers (see, e.g., Kasen & Woosley 2009, Dessart & Hillier 2011). Both the optical depth and the brightness plummet when the photosphere recedes into the layers rich in helium and intermediate-mass elements (regions that were formally part of the highly-bound compact He core), at velocities below 1000 km s-1 in model X (see details in Table 3 and illustrations in Fig. 6).
| Age | ||||||
|---|---|---|---|---|---|---|
| [d] | [cm] | [km s-1] | [K] | [M⊙] | [108 L⊙] | |
| 12.10 | 26324 | 5.36(14) | 5124 | 8000 | 5.66(-3) | 1.25 |
| 13.31 | 21746 | 5.78(14) | 5028 | 7526 | 7.45(-3) | 1.18 |
| 14.64 | 17968 | 6.17(14) | 4878 | 7040 | 1.06(-2) | 1.15 |
| 16.10 | 14841 | 6.53(14) | 4694 | 6671 | 1.55(-2) | 1.12 |
| 17.71 | 12231 | 6.87(14) | 4489 | 6403 | 2.33(-2) | 1.10 |
| 19.48 | 10067 | 7.20(14) | 4276 | 6203 | 3.56(-2) | 1.09 |
| 21.43 | 8274 | 7.53(14) | 4064 | 6055 | 5.48(-2) | 1.09 |
| 23.57 | 6803 | 7.84(14) | 3851 | 5946 | 8.42(-2) | 1.09 |
| 25.93 | 5584 | 8.15(14) | 3638 | 5856 | 1.26(-1) | 1.09 |
| 28.52 | 4568 | 8.44(14) | 3427 | 5723 | 1.86(-1) | 1.09 |
| 31.37 | 3711 | 8.73(14) | 3221 | 5726 | 2.69(-1) | 1.10 |
| 34.51 | 2973 | 9.00(14) | 3020 | 5675 | 3.82(-1) | 1.10 |
| 37.96 | 2335 | 9.28(14) | 2828 | 5633 | 5.33(-1) | 1.12 |
| 41.76 | 1818 | 9.55(14) | 2646 | 5597 | 7.35(-1) | 1.13 |
| 45.94 | 1416 | 9.83(14) | 2476 | 5573 | 9.97(-1) | 1.16 |
| 50.53 | 1100 | 1.01(15) | 2316 | 5546 | 1.33 | 1.16 |
| 55.58 | 857 | 1.04(15) | 2158 | 5508 | 1.74 | 1.16 |
| 61.14 | 671 | 1.06(15) | 2002 | 5472 | 2.24 | 1.16 |
| 67.25 | 521 | 1.07(15) | 1845 | 5431 | 2.84 | 1.13 |
| 73.98 | 395 | 1.08(15) | 1683 | 5388 | 3.52 | 1.09 |
| 81.38 | 288 | 1.06(15) | 1514 | 5338 | 4.26 | 1.01 |
| 89.52 | 195 | 1.03(15) | 1330 | 5281 | 5.03 | 0.885 |
| 98.47 | 114 | 9.58(14) | 1126 | 5260 | 5.78 | 0.737 |
| 108.30 | 45 | 8.32(14) | 889 | 5332 | 6.40 | 0.619 |
| 119.10 | 4.1 | 6.86(14) | 666 | 5544 | 7.46 | 0.470 |
| 125.00 | 1.2 | 4.91(14) | 455 | 4775 | 8.07 | 0.173 |
4.2 Spectroscopic properties
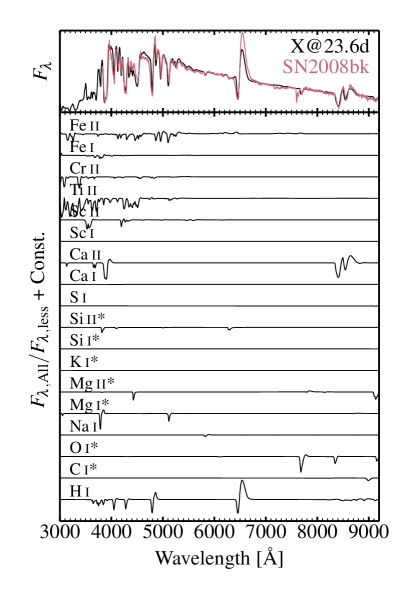
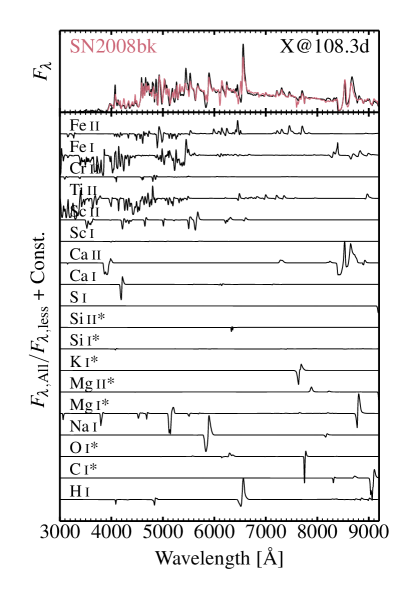
Figure 7 shows a comparison of the spectroscopic observations of SN 2008bk with model X at multiple epochs during the photospheric phase. The nebular phase will be discussed in Section 5.3 and in a separate study. Here, we have corrected the model for reddening, redshift, and distance to directly compare to the observations. As before for the multi-band light curves at early times, we apply a global scaling of the model that corresponds to a magnitude offset of 0.5 mag (the model is 70% too luminous for our adopted distance and reddening — see discussion in the previous section). Figure 15 shows the bound-bound transitions that influence the photospheric spectra at 23.6 and 108.3 d.
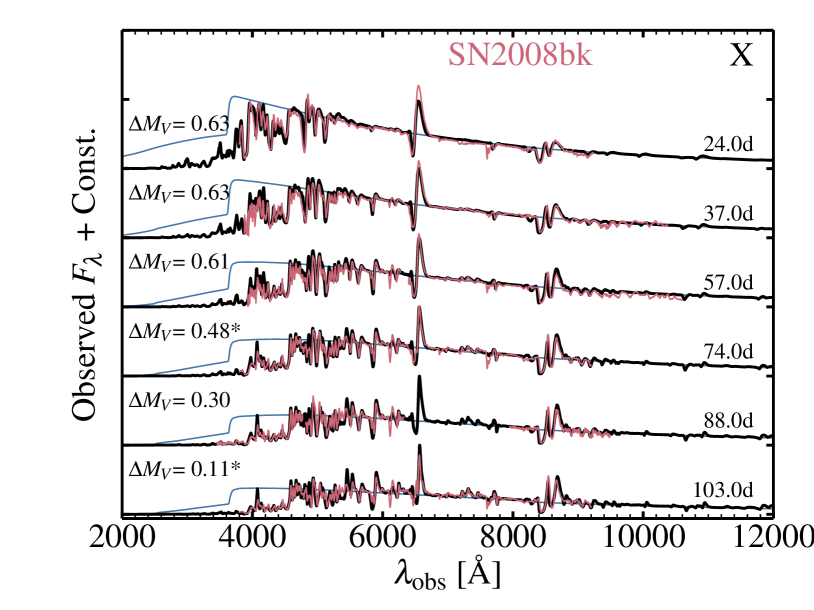
While the photometric observations of SN 2008bk started within a week of explosion, the spectroscopic monitoring started only three weeks after explosion. The SN has entered the recombination phase (see Fig. 6), the spectral energy distribution is already quite red, and we see clear signs of line blanketing (Fe ii and Ti ii) in the optical. This is made more obvious by comparing the synthetic spectrum (black) with the continuum flux from the model (blue; the continuum flux is computed, in a post-processing step, by including only the bound-free and free-free processes in the formal solution of the radiative transfer equation). Line blanketing suppresses strongly the flux shortward of 5000 Å, although one clearly sees that the continuum flux is not strong below the Balmer edge, as expected for a cool photosphere (Table 3 and Fig. 3). Similarly, He i lines have already vanished and Na i D (rather than He i 5875 Å) is already present in the first spectrum. We see H i Balmer lines (and in particular H) together with Ca ii H&K, the Ca ii near-IR triplet, O i 7773.4 Å, and a trace of Si ii 6355 Å.
The spectrum evolves slowly through the photospheric phase. Line blanketing strengthens as the photospheric temperature progressively drops and the line profiles become increasingly narrow as the photosphere recedes into deeper/slower ejecta layers (Table 3). The photospheric velocity of model X is 2000 km s-1 halfway through the plateau phase, about 10-20% too large for SN 2008bk, but 50% lower than for a standard SN II-P like SN 1999em (Dessart & Hillier, 2006; Utrobin, 2007; Pignata, 2013; Bersten et al., 2011; Dessart et al., 2013). As we approach the end of the plateau, the ionization level at the photosphere decreases so ions with a lower ionization potential start contributing. We see the strengthening of lines from Fe i and Sc ii, as well as from Fe ii in the red part of the optical.
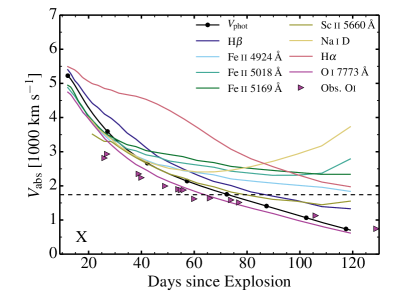
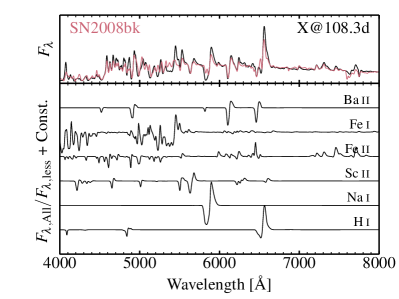
Figure 8 illustrates the evolution of the velocity at maximum absorption in strong optical lines of H i, Fe ii, Sc ii, Na i, and O i. We see that the line that matches best the evolution of the photosphere (shown in black) is O i 7773.4 Å. Fe ii 5169 Å, which is often used for estimating , tends to overestimate it in the second half of the plateau, while it underestimates it at early times (see discussion in Dessart & Hillier 2005a). Compared to SN 2008bk, the expansion rate of the model X ejecta is too large by 10–20%. The overestimate of the velocity at maximum absorption by model X is in the same sense as for the luminosity; our model X is slightly over-energetic for its mass and radius.
4.3 Ba ii lines and the structure seen in H
The spectral morphology is markedly different from standard SNe II; line profiles are narrower and suffer much less overlap with neighbouring features. At the end of the photospheric phase the H profile in SN 2008bk shows a complex structure, which is absent in model X (Fig. 7). This may be a signature of asphericity in the inner ejecta, which our 1-D approach cannot capture. But a simpler alternative is the contamination from Ba ii lines. This seems likely since we strongly underestimate the strength of the feature at 6150 Å, which may stem primarily from Ba ii 6141.7 Å. Ba was not included in any time sequence here because it is an s-process element not treated in our mesa simulations.
Most low-luminosity SNe II-P exhibit a structured H profile at the end of the photospheric phase, while standard SNe II-P tend not to (see Fig. 6 of Roy et al. 2011). To investigate whether Ba ii is at the origin of this complex structure, we recomputed model X at one time step with Ba ii included. Because we did not have Ba in the time-dependent cmfgen model, we used Sc ii to set the Ba ii departure coefficients at the previous time step. We also initialise the Ba abundance in the H-rich envelope and in the inner ejecta to the same values as those obtained in the detailed kepler model s15iso presented in Dessart & Hillier (2011) — our adopted Ba mass fraction in the H-rich envelope is 1.3210-8. As shown in Fig. 9, with the inclusion of Ba ii in the model atom, we now reproduce the observed feature at 6150 Å, and we also obtain a much more structured H line profile, although the model profile does not match exactly the observations. We also predict a weaker Ba ii line overlapping with Na i D: this line has a double dip in the observations but the model shows just one broad absorption, perhaps because the model overestimates the range of velocities over which Na i D forms. The expansion rate in model X is slightly larger than needed for SN 2008bk (see also Fig. 8), so the broader lines of the model tend to overestimate line overlap and erase the structure in the H region.
We surmise that the complex appearance of the H region at the end of the photospheric phase in low-luminosity SNe II is due to Ba ii 6496.9 Å. In standard SNe II the higher expansion rate at the base of the H-rich envelope causes the contributions of Ba ii 6496.9 Å and H to merge into a single spectral feature. In addition to the influence of Ba ii, interaction with the progenitor RSG wind (ignored in our model) may influence at such late times the H and H line profile morphology through the formation of a ‘high-velocity’ absorption notch (Chugai et al., 2007). It is however unclear whether the effect would apply for our model X since its low mass RSG progenitor should have a low wind mass loss rate.
4.4 Additional remarks
Leaving aside the discrepancies associated with the neglect of Ba ii, Fig. 7 shows that model X reproduces closely the observed spectra of SN 2008bk — no tuning is done to the composition either initially (we just adopt the composition of the mesa model evolved at solar metallicity) or in the course of the cmfgen time sequence. Our model seems to overestimate the absorption at 5400 Å associated with Fe i lines (see appendix), perhaps because of problems with the atomic data (the strength of Fe ii lines seems adequate). The features around 9000 Å–1 m seen in the observations of SN 2008bk at 35 and 55 d are not predicted by our models — these are perhaps observational artefacts (e.g., second order contamination when using a dichroic).
5 Sensitivity to progenitor and explosion properties
In this section, we study the impact of slight changes in the progenitor radius, chemical mixing, and ejecta mass on the resulting photometric and spectroscopic predictions. In the process, we build physical error bars for the properties of the progenitor and explosion associated with SN 2008bk.
5.1 Radius
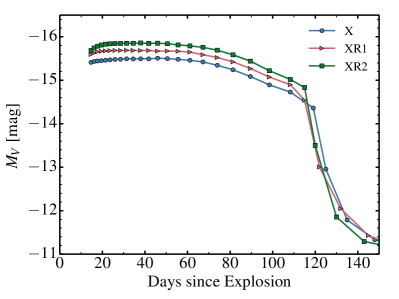
To test the influence of a change in progenitor radius, we use the same approach as in Dessart et al. (2013). In practice, we vary the efficiency of convection within the MLT formalism in mesa, by tuning the parameter from 3 (model X), to 2.5 (model XR1), and 2.0 (model XR2). As decreases, the RSG star model at death increases in radius, from 502 (X), to 581 (XR1), and 661 R⊙ (XR2). The main effect of a change in the RSG progenitor radius is to mitigate the cooling of the ejecta as it expands. The larger the progenitor star, the weaker the cooling of the ejecta. Here, to isolate the influence of a change in , models X, XR1, and XR2 are exploded to produce ejecta with about the same kinetic energy at infinity ( 2.6 1050 erg) and about the same i mass (0.008–0.009 M⊙) — see Table 1 for details.
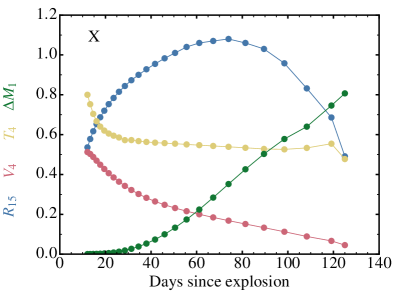
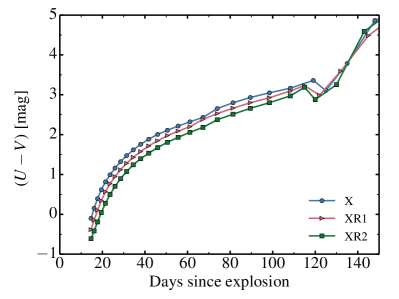
Figure 10 shows the bolometric luminosity, the absolute -band and the light curve for models X, XR1, and XR2. A larger progenitor radius yields a larger bolometric luminosity, a greater -band brightness, and a bluer colour throughout the photospheric phase. It does not affect the length of the plateau phase. For the bolometric luminosity, the offset is roughly constant during the photospheric phase and corresponds to an increase of 15% (for an increase of 16% in ) between models X and XR1, and an increase of 15% (for an increase of 14% in ) between models XR1 and XR2. The offset of about 0.2 mag in -band magnitude between X and XR1, and between XR1 and XR2, is also roughly constant past 30 d after explosion — the offset is reduced at earlier times in part because of the different colours of the model early on. The colour is systematically bluer for the more extended progenitor star, and the more so at earlier times. The offset in is about 0.2 mag between each model for most of the photospheric phase, but it decreases near the end. Consequently, changes in progenitor radii may introduce a scatter in the intrinsic colour of SNe II-P.
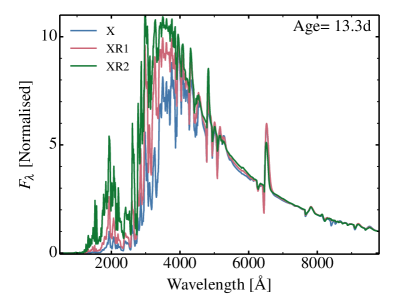
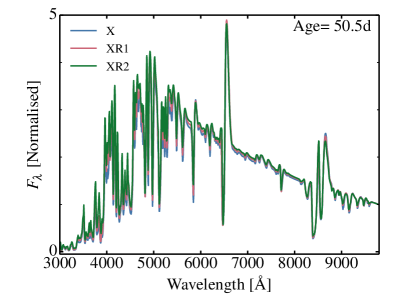
Figure 11 compares the synthetic spectra for models X, XR1, and XR2 at 13.3 d and 50.5 d after explosion. We normalise the models at 9800 Å to better reveal the relative variation in flux across the UV and optical. The colour shift discussed above is visible in the spectra at early times. The bluer spectrum of model XR2 at a given post-explosion epoch is suggestive of a higher photospheric temperature and ionisation. For example, the Ca ii near-IR triplet is hardly visible in model XR2 at 13.3 d, but readily visible as a weak absorption feature in model X in which the transition to the recombination phase is more advanced. As apparent, a change of only 15% in the progenitor radius causes a significant difference in colours at early times (this offset may be missed without the correct explosion time since a larger progenitor radius merely shifts the colour to later in time). The spectral offset between models X, XR1, and XR2 is however smaller than obtained between the models MLT1 and MLT3 of Dessart et al. (2013), which resulted from the explosion of RSG stars with a much larger difference in surface radius (1100 and 500 R⊙, respectively). Modulations in intrinsic colour may stem from diversity in progenitor radii, although in observations, such variations can also originate from reddening.
Model X is brighter than SN 2008bk by 0.5 mag during the photospheric phase. Given the results for models XR1 and XR2, a reduction in radius by 15% would make it fainter by 0.2 mag — this could arise from the adoption of a lower metallicity, like for model Y. But a greater reduction would be needed to cancel the present offset and this would likely impact the colour. However, the colour of model X matches that of SN 2008bk, and confirms the need for a rather compact RSG progenitor star, as advocated by Dessart et al. (2013) for SNe II-P in general (see also González-Gaitán et al. 2015). To reconcile model X with the observations (brightness and expansion rate inferred from line profile widths) would likely require a lower ejecta kinetic energy (or an increase in ejecta mass). A 10-20% increase in the distance to SN 2008bk would reduce the offset, just like an increase in reddening from 0.02 to 0.1 mag.
5.2 Mass
In this section, we discuss the impact of a different ejecta mass on the resulting SN radiation. We compare our best-match model X with model XM, which starts on the main sequence with the same initial conditions (mass, metallicity, etc.) but evolved with a smaller mass loss rate (see Section 3). This influences primarily the RSG phase and the impact is limited to the H-rich envelope mass, which is 1 M⊙ greater in model XM — both models have the same He-core mass. The corresponding SN ejecta reflect this difference (see Table 1). In practice, the explosion models X and XM differ slightly in explosion energy so that the is about the same for both.
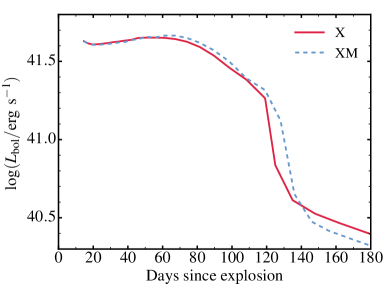
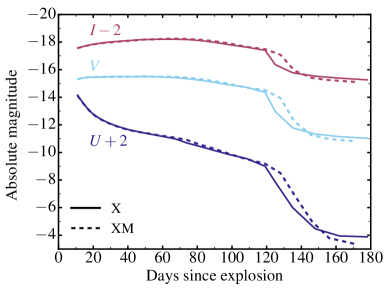
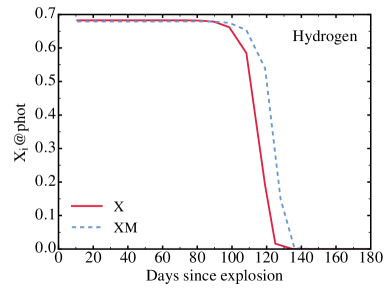
Figure 12 shows the resulting bolometric light curve, the light curves, and the variation of the H mass fraction at the photosphere. The light curves are essentially identical for models X and XM, except for the longer duration of the high-brightness phase in model XM. Here, an offset in ejecta mass of 1 M⊙ (which is tied to a difference in the progenitor H-envelope mass) extends the photospheric phase by 10 d.111We do not show a spectral comparison because both models are essentially identical at all epochs apart from the timing of the transition to the nebular phase. The bottom panel of Fig. 12 emphasises how the high-brightness phase coincides with the epochs during which the photosphere is located within the layers that were formerly part of the low-density H-rich progenitor envelope.
As the photosphere moves into the layers that were formerly in the highly-bound high-density He core, the luminosity plummets. In our model X, when the optical depth at the base of the H-rich layers drops to 1, the total electron-scattering optical depth across the deeper layers (from the former He core) is only 10 and it drops to 1 within a week. This whole transition occurs during the fall off from the plateau. The light curve transition can be modulated by mixing of H and He. However, the properties of the highly bound slow-moving He-core material are hard to constrain from the light curve since the corresponding ejecta regions have a low/moderate optical depth at the end of the plateau phase.
5.3 Mixing
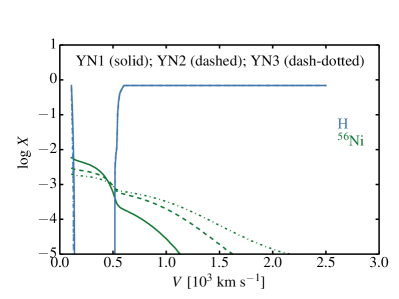
We now discuss mixing in order to test how our implementation affects our results. We use two approaches that are crude representations of the process of mixing as simulated in core-collapse SNe (Fryxell et al., 1991; Wongwathanarat et al., 2015). In the first approach, we step through each ejecta mass shell and mix all mass shells within the range [, ] with 0.4 M⊙ — this is the usual way we proceed (Dessart et al., 2012). The advantage is that it is straightforward to implement. This mixing is carried out during the v1d simulation, at 10,000 s after the explosion was triggered (and thus about one day before shock breakout). This mixing is both macroscopic (material is shuffled in mass/velocity space) and microscopic (each 1-D/spherical mass shell on the cmfgen grid is homogeneous). This is the mixing done in models X, XR1, XR2, and XM.
In the second approach only i is mixed; all other species are essentially left as in the original mesa model except for hydrogen. In practice, after mixing i, regions where the sum of mass fractions is below unity, hydrogen is added, while in regions where the sum of mass fractions is above unity (typically by 1%), all species’ mass fractions are scaled so that the total is unity. This causes the spike in the H mass fraction in the innermost shells of models YN1, YN2, and YN3 because the i mass fraction was close to unity in those layers prior to mixing (Fig. 13). This mixing approach is used in models YN1, YN2, and YN3, which differ in the values of used. In this order, we have used 0.5, 1.0, and 1.5 M⊙. We show the composition for a selection of species in the top row of Fig. 13.
This exercise is instructive because our various models all derive from a 12 M⊙ main sequence star, with similar H-rich envelope and He-core properties. Yet, these different levels of mixing produce drastic variations at nebular times, as we discuss now.
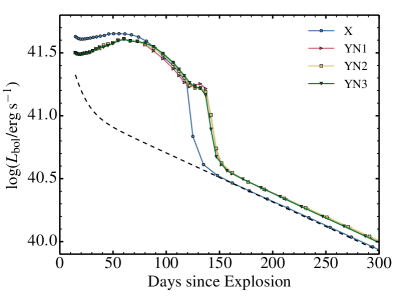
The middle-left panel of Fig. 13 shows the bolometric luminosity for models X and YN1/YN2/YN3. During the photospheric phase, the early-time luminosity is higher in model X because of the large progenitor radius (502 compared to 405 R⊙) and the higher ratio . The lower ejecta mass of model X (8.29 compared to 9.45 M⊙) produces a shorter plateau length by 20 d (all four models have the same ejecta kinetic energy of erg). Interestingly, the three models YN1/YN2/YN3 show a similar bump at the end of the plateau phase, despite their different levels of i mixing. Model X, which has a similar level of i mixing as model YN1, does not show a bump. This bump is controlled by the mixing of other species, and in particular how H and He are mixed in velocity/mass space at the He-core edge (see, e.g., Utrobin 2007). In model X, all species are mixed and this tends to soften the changes in composition in the inner ejecta, which the photosphere probes at the end of the plateau phase. H is important here because it is the main electron donor so that different levels of H mixing can modulate the evolution of the optical depth at the end of the plateau phase (and modulate the recession of the photosphere and the variation in luminosity).
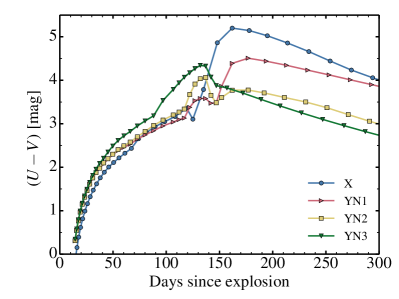
The middle-right panel of Fig. 13 shows the evolution of the colour for the four models. The more extended model X is bluer during the photospheric phase, but redder at nebular epochs. Model YN3 with the strongest mixing is the redder of all four models during the photospheric phase – the extra heating does not compensate for the increased opacity from metals, but it is the bluer of all models at nebular times. The drastic change is seen when the models transition to the nebular phase. Model X becomes exceedingly red, while models YN1, YN2, and YN3 remain systematically bluer, the more so the larger the mixing of i.
The broad-band fluxes of Type II SNe do not depend on the temperature in the same way at nebular times as during the photospheric phase, when the escaping radiation has roughly the properties of a blackbody. At nebular times, the SN radiates the energy deposited by radioactive decay through strong emission lines, many of which being forbidden. Here, temperature and ionisation of the gas control which lines cool the ejecta. Then, depending on the location of these transitions in wavelength space, one can produce different colours, even if the bolometric luminosity (which is set by the amount of decay energy absorbed by the gas) is the same between models.
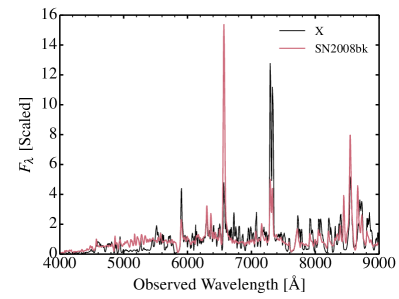
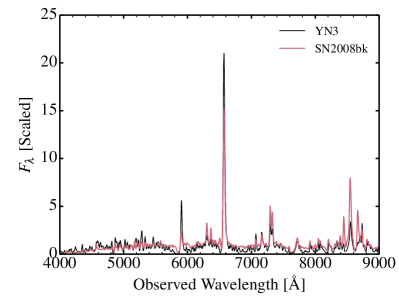
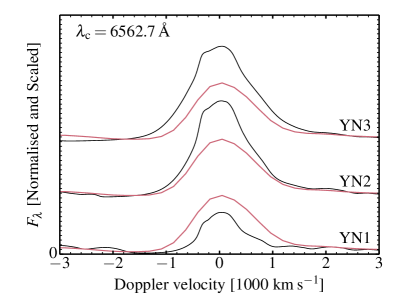
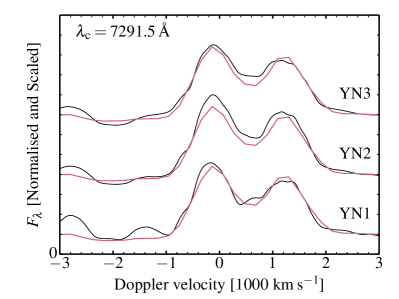
In the bottom row of Fig. 13, we show a comparison of model X (left) and model YN3 (right) with the observations of SN 2008bk at 282 d after explosion (the models and observations have been normalised at 6310 Å to better reveal the relative offsets in flux). Model X follows roughly the observed spectral energy distribution, but it underestimates the flux in the 5000 Å region and overestimates it in the red part of the optical. Model X has cooler and more recombined H-rich shells (e.g., with dominance of Fe i) than model YN3 (with dominance of Fe ii). More importantly, it strongly overestimates the Ca ii 7300 Å doublet and underestimates the strength of H. In contrast, model YN3, which has the same amount of i and a similar core composition as model X, has a completely different nebular spectrum. Model YN3 matches well the Ca ii 7300 Å doublet and the Ca ii 8500 Å triplet and overestimates the strength of H by about a factor of two (model YN1, characterised by a weaker i mixing, slightly underestimates the strength of H). The half-width-at-half-maximum is 500 km s-1 for H (this velocity corresponds to the innermost H-rich layers in the ejecta) and is about 350 km s-1 for the Ca ii 7300 Å doublet (this velocity corresponds to the He-rich ejecta regions). In both cases, the line forms over a range of velocities. For H, model YN3 strongly overestimates the extent of the absorption trough — model YN1 with a weaker i mixing has a narrower trough that matches closer the observations (Fig. 14). The different levels of mixing affect the H widths, but not Ca ii 7300 Å — the i mixing affects more the ionisation of H i than that of Ca ii in the outer ejecta.
This short exploration on mixing highlights the complications it introduces even for ejecta that have the same overall composition, mass, and energetics. How the different elements are distributed at both the microscopic and macroscopic level is a fundamental aspect of the problem (Fryxell et al., 1991; Jerkstrand et al., 2012; Wongwathanarat et al., 2015), and it depends both on the composition prior to explosion as well on the impact of the explosion on this distribution. We will come back to the issue of mixing for nebular phase spectra in a future study.
6 Conclusions
We have presented the results of numerical simulations that aim at understanding the properties of the ejecta/radiation associated with SN 2008bk, as well as the progenitor star at its origin. We have focused on a single mass of 12 M⊙ for the progenitor, and have evolved this model with mesa at solar metallicity but with different parameterisations for mass loss and convection in order to produce RSG stars at death that cover a range of final masses and surface radii. These models were then exploded with the radiation hydrodynamics code v1d to produce ejecta with various explosion energies and i mass. Finally, starting at a post-explosion time of 10 d, we have evolved these ejecta with the nLTE radiative transfer code cmfgen, building multi-band light curves and multi-epoch spectra that can be directly compared to observations.
Our model X, which closely matches SN 2008bk, corresponds to a star with an initial mass of 12 M⊙, a final mass of 9.88 M⊙, an H-rich envelope mass of 6.7 M⊙ a final surface radius of 502 R⊙. The associated ejecta has a mass of 8.29 M⊙, a kinetic energy of 2.5 1050 erg and 0.0086 M⊙ of i. Provided we introduce a 0.5 mag offset, model X follows closely the multi-band optical and near-IR light curves of SN 2008bk, including the colour evolution (e.g., the sharp drop in the band and the near-constant evolution of the band magnitude) and the plateau duration. Model X reproduces well the spectral evolution of SN 2008bk (provided we renormalise the spectra to cancel the 0.5 mag offset in brightness), the progressive reddening of the spectra as the photospheric temperature drops and line blanketing strengthens, the reduction in line widths as the photosphere recedes to deeper/slower ejecta layers. The early colour evolution and reddening of the spectra is best matched with an explosion date of MJD 54546.0. We find that model X yields lines that are 10-20% too broad — it typically overestimates the expansion rate by 10–20%. Our model X is therefore somewhat too energetic for SN 2008bk. A lower explosion energy could reduce the offset in line widths and brightness. The offset in luminosity could be reduced by invoking a larger reddening (perhaps up to 0.1 mag) to SN 2008bk. The uncertainty in the Cepheid-based distance to the host of SN 2008bk is probably small. Given all the uncertainties involved, these offsets are reasonably small to suggest that model X is a sensible representation of SN 2008bk.
Our model of SN 2008bk is a low-energy counterpart of the models for “standard” SNe II-P like 1999em. The mechanisms that control their evolution are the same for both — in our approach we merely reduce the energy injection to produce a model for SN 2008bk rather than one for SN 1999em. However, the lower expansion rate in SN 2008bk allows a much better inspection of the line profile fits. Interestingly, in low-luminosity SNe II, the H line systematically develops a complex structure at the end of the plateau phase. This structure is most likely not a signature of asymmetry, but instead caused by overlap with the strong Ba ii 6496.9 Å line. This conclusion is reinforced by the good match obtained to the isolated line of Ba ii 6141.7 Å in SN 2008bk.
We have performed additional models to gauge the sensitivity of our results to changes in progenitor/explosion parameters. A 15% increase in the progenitor surface radius leads to a 15% increase in plateau luminosity and a 0.2 mag brightening of the -band magnitude, but does not affect the length of the photospheric phase. An increase in ejecta mass of 1 M⊙ hardly affects the results for model X, except for the lengthening of the photospheric phase by 10.0 d.
In our simplistic approach, chemical mixing has little impact on the SN radiation throughout most of the plateau phase. Early on, increased mixing causes extra line blanketing and produces redder optical colours. In our models where only i is mixed outwards (but no mixing is applied to H and He), the light curve develops a 15-d long ledge before dropping from the plateau. Mixing of H with He smoothes that transition, most likely because it allows a much smoother evolution of the electron-scattering optical depth, which controls the release of radiative energy stored in the ejecta (and the rate of recession of the photosphere). However, the most drastic impact of mixing in our models is seen at the nebular times. Depending on how we perform the mixing, we can completely quench H, boost Ca ii 7300 Å, or mitigate the temperature and ionisation state of the gas to alter the SN colours. Because of all these complications, we defer the modelling of the nebular-phase spectra of SN 2008bk.
7 Acknowledgements
Sergey Lisakov is supported by the Erasmus Mundus Joint Doctorate Program by Grants Number 2013-1471 from the agency EACEA of the European Commission. LD acknowledges financial support from the Agence Nationale de la Recherche grant ANR-2011-Blanc-SIMI-5-6-007-01. DJH acknowledges support from NASA theory grant NNX14AB41G.
References
- Anderson et al. (2014) Anderson, J. P., González-Gaitán, S., Hamuy, M., Gutiérrez, C. P., Stritzinger, M. D., Olivares E., F., Phillips, M. M., Schulze, S., Antezana, R., Bolt, L., Campillay, A., Castellón, S., Contreras, C., de Jaeger, T., Folatelli, G., Förster, F., Freedman, W. L., González, L., Hsiao, E., Krzemiński, W., Krisciunas, K., Maza, J., McCarthy, P., Morrell, N. I., Persson, S. E., Roth, M., Salgado, F., Suntzeff, N. B., & Thomas-Osip, J. 2014, ApJ, 786, 67
- Benetti et al. (2001) Benetti, S., Turatto, M., Balberg, S., Zampieri, L., Shapiro, S. L., Cappellaro, E., Nomoto, K., Nakamura, T., Mazzali, P. A., & Patat, F. 2001, MNRAS, 322, 361
- Bersten et al. (2011) Bersten, M. C., Benvenuto, O., & Hamuy, M. 2011, ApJ, 729, 61
- Chugai et al. (2007) Chugai, N. N., Chevalier, R. A., & Utrobin, V. P. 2007, ApJ, 662, 1136
- Dessart & Hillier (2005a) Dessart, L. & Hillier, D. J. 2005a, A&A, 439, 671
- Dessart & Hillier (2005b) —. 2005b, A&A, 437, 667
- Dessart & Hillier (2006) —. 2006, A&A, 447, 691
- Dessart & Hillier (2008) —. 2008, MNRAS, 383, 57
- Dessart & Hillier (2010) —. 2010, MNRAS, 405, 2141
- Dessart & Hillier (2011) —. 2011, MNRAS, 410, 1739
- Dessart et al. (2014) Dessart, L., Hillier, D. J., Blondin, S., & Khokhlov, A. 2014, MNRAS, 441, 3249
- Dessart et al. (2012) Dessart, L., Hillier, D. J., Li, C., & Woosley, S. 2012, MNRAS, 424, 2139
- Dessart et al. (2013) Dessart, L., Hillier, D. J., Waldman, R., & Livne, E. 2013, MNRAS, 433, 1745
- Dessart et al. (2010a) Dessart, L., Livne, E., & Waldman, R. 2010a, MNRAS, 408, 827
- Dessart et al. (2010b) —. 2010b, MNRAS, 405, 2113
- Falk & Arnett (1977) Falk, S. W. & Arnett, W. D. 1977, ApJS, 33, 515
- Faran et al. (2014a) Faran, T., Poznanski, D., Filippenko, A. V., Chornock, R., Foley, R. J., Ganeshalingam, M., Leonard, D. C., Li, W., Modjaz, M., Nakar, E., Serduke, F. J. D., & Silverman, J. M. 2014a, MNRAS, 442, 844
- Faran et al. (2014b) Faran, T., Poznanski, D., Filippenko, A. V., Chornock, R., Foley, R. J., Ganeshalingam, M., Leonard, D. C., Li, W., Modjaz, M., Serduke, F. J. D., & Silverman, J. M. 2014b, MNRAS, 445, 554
- Fryxell et al. (1991) Fryxell, B., Arnett, D., & Mueller, E. 1991, ApJ, 367, 619
- Galbany et al. (2015) Galbany, L., Hamuy, M., Phillips, M. M., Suntzeff, N. B., Maza, J., de Jaeger, T., Moraga, T., González-Gaitán, S., Krisciunas, K., Morrell, N. I., Thomas-Osip, J., Krzeminski, W., González, L., Antezana, R., Wischnjewski, M., McCarthy, P., Anderson, J. P., Gutiérrez, C. P., Stritzinger, M., Folatelli, G., Anguita, C., Galaz, G., Green, E. M., Impey, C., Kim, Y.-C., Kirhakos, S., Malkan, M. A., Mulchaey, J. S., Phillips, A. C., Pizzella, A., Prosser, C. F., Schmidt, B. P., Schommer, R. A., Sherry, W., Strolger, L.-G., Wells, L. A., & Williger, G. M. 2015, ArXiv:1511.08402
- González-Gaitán et al. (2015) González-Gaitán, S., Tominaga, N., Molina, J., Galbany, L., Bufano, F., Anderson, J. P., Gutierrez, C., Förster, F., Pignata, G., Bersten, M., Howell, D. A., Sullivan, M., Carlberg, R., de Jaeger, T., Hamuy, M., Baklanov, P. V., & Blinnikov, S. I. 2015, MNRAS, 451, 2212
- Grassberg et al. (1971) Grassberg, E. K., Imshennik, V. S., & Nadyozhin, D. K. 1971, Astrophysics and Space Science, 10, 28
- Hamuy (2003) Hamuy, M. 2003, ApJ, 582, 905
- Hillier & Dessart (2012) Hillier, D. J. & Dessart, L. 2012, MNRAS, 424, 252
- Hillier & Miller (1998) Hillier, D. J. & Miller, D. L. 1998, ApJ, 496, 407
- Jerkstrand et al. (2012) Jerkstrand, A., Fransson, C., Maguire, K., Smartt, S., Ergon, M., & Spyromilio, J. 2012, A&A, 546, A28
- Kasen & Woosley (2009) Kasen, D. & Woosley, S. E. 2009, ApJ, 703, 2205
- Leonard et al. (2012a) Leonard, D. C., Dessart, L., Hillier, D. J., & Pignata, G. 2012a, in American Institute of Physics Conference Series, Vol. 1429, American Institute of Physics Conference Series, ed. J. L. Hoffman, J. Bjorkman, & B. Whitney, 204–207
- Leonard et al. (2002) Leonard, D. C., Filippenko, A. V., Gates, E. L., Li, W., Eastman, R. G., Barth, A. J., Bus, S. J., Chornock, R., Coil, A. L., Frink, S., Grady, C. A., Harris, A. W., Malkan, M. A., Matheson, T., Quirrenbach, A., & Treffers, R. R. 2002, PASP, 114, 35
- Leonard et al. (2012b) Leonard, D. C., Pignata, G., Dessart, L., Hillier, D., Horst, C., Fedrow, J. M., & Brewer, L. 2012b, The Astronomer’s Telegram, 4033
- Li et al. (2006) Li, W., Van Dyk, S. D., Filippenko, A. V., Cuillandre, J.-C., Jha, S., Bloom, J. S., Riess, A. G., & Livio, M. 2006, ApJ, 641, 1060
- Livne (1993) Livne, E. 1993, ApJ, 412, 634
- Maguire et al. (2012) Maguire, K., Jerkstrand, A., Smartt, S. J., Fransson, C., Pastorello, A., Benetti, S., Valenti, S., Bufano, F., & Leloudas, G. 2012, MNRAS, 420, 3451
- Mattila et al. (2008) Mattila, S., Smartt, S. J., Eldridge, J. J., Maund, J. R., Crockett, R. M., & Danziger, I. J. 2008, ApJL, 688, L91
- Maund et al. (2014) Maund, J. R., Mattila, S., Ramirez-Ruiz, E., & Eldridge, J. J. 2014, MNRAS, 438, 1577
- Maund et al. (2005) Maund, J. R., Smartt, S. J., & Danziger, I. J. 2005, MNRAS, 364, L33
- Pastorello et al. (2004) Pastorello, A., Zampieri, L., Turatto, M., Cappellaro, E., Meikle, W. P. S., Benetti, S., Branch, D., Baron, E., Patat, F., Armstrong, M., Altavilla, G., Salvo, M., & Riello, M. 2004, MNRAS, 347, 74
- Paxton et al. (2011) Paxton, B., Bildsten, L., Dotter, A., Herwig, F., Lesaffre, P., & Timmes, F. 2011, ApJS, 192, 3
- Paxton et al. (2013) Paxton, B., Cantiello, M., Arras, P., Bildsten, L., Brown, E. F., Dotter, A., Mankovich, C., Montgomery, M. H., Stello, D., Timmes, F. X., & Townsend, R. 2013, ApJS, 208, 4
- Paxton et al. (2015) Paxton, B., Marchant, P., Schwab, J., Bauer, E. B., Bildsten, L., Cantiello, M., Dessart, L., Farmer, R., Hu, H., Langer, N., Townsend, R. H. D., Townsley, D. M., & Timmes, F. X. 2015, ApJS, 220, 15
- Pietrzyński et al. (2010) Pietrzyński, G., Gieren, W., Hamuy, M., Pignata, G., Soszyński, I., Udalski, A., Walker, A., Fouqué, P., Bresolin, F., Kudritzki, R.-P., Garcia-Varela, A., Szewczyk, O., Szymański, M., Kubiak, M., & Wyrzykowski, Ł. 2010, AJ, 140, 1475
- Pignata (2013) Pignata, G. 2013, in Massive Stars: From alpha to Omega, 176
- Roy et al. (2011) Roy, R., Kumar, B., Benetti, S., Pastorello, A., Yuan, F., Brown, P. J., Immler, S., Fatkhullin, T. A., Moskvitin, A. S., Maund, J., Akerlof, C. W., Wheeler, J. C., Sokolov, V. V., Quimby, R. M., Bufano, F., Kumar, B., Misra, K., Pandey, S. B., Elias-Rosa, N., Roming, P. W. A., & Sagar, R. 2011, ApJ, 736, 76
- Sanders et al. (2015) Sanders, N. E., Soderberg, A. M., Gezari, S., Betancourt, M., Chornock, R., Berger, E., Foley, R. J., Challis, P., Drout, M., Kirshner, R. P., Lunnan, R., Marion, G. H., Margutti, R., McKinnon, R., Milisavljevic, D., Narayan, G., Rest, A., Kankare, E., Mattila, S., Smartt, S. J., Huber, M. E., Burgett, W. S., Draper, P. W., Hodapp, K. W., Kaiser, N., Kudritzki, R. P., Magnier, E. A., Metcalfe, N., Morgan, J. S., Price, P. A., Tonry, J. L., Wainscoat, R. J., & Waters, C. 2015, ApJ, 799, 208
- Schlegel et al. (1998) Schlegel, D. J., Finkbeiner, D. P., & Davis, M. 1998, ApJ, 500, 525
- Smartt (2009) Smartt, S. J. 2009, ARA&A, 47, 63
- Smith et al. (2011) Smith, N., Li, W., Filippenko, A. V., & Chornock, R. 2011, MNRAS, 412, 1522
- Spiro et al. (2014) Spiro, S., Pastorello, A., Pumo, M. L., Zampieri, L., Turatto, M., Smartt, S. J., Benetti, S., Cappellaro, E., Valenti, S., Agnoletto, I., Altavilla, G., Aoki, T., Brocato, E., Corsini, E. M., Di Cianno, A., Elias-Rosa, N., Hamuy, M., Enya, K., Fiaschi, M., Folatelli, G., Desidera, S., Harutyunyan, A., Howell, D. A., Kawka, A., Kobayashi, Y., Leibundgut, B., Minezaki, T., Navasardyan, H., Nomoto, K., Mattila, S., Pietrinferni, A., Pignata, G., Raimondo, G., Salvo, M., Schmidt, B. P., Sollerman, J., Spyromilio, J., Taubenberger, S., Valentini, G., Vennes, S., & Yoshii, Y. 2014, MNRAS, 439, 2873
- Turatto et al. (1998) Turatto, M., Mazzali, P. A., Young, T. R., Nomoto, K., Iwamoto, K., Benetti, S., Cappellaro, E., Danziger, I. J., de Mello, D. F., Phillips, M. M., Suntzeff, N. B., Clocchiatti, A., Piemonte, A., Leibundgut, B., Covarrubias, R., Maza, J., & Sollerman, J. 1998, ApJL, 498, L129
- Ugliano et al. (2012) Ugliano, M., Janka, H.-T., Marek, A., & Arcones, A. 2012, ApJ, 757, 69
- Utrobin (2007) Utrobin, V. P. 2007, A&A, 461, 233
- Utrobin et al. (2007) Utrobin, V. P., Chugai, N. N., & Pastorello, A. 2007, A&A, 475, 973
- Van Dyk (2013) Van Dyk, S. D. 2013, AJ, 146, 24
- Van Dyk et al. (2012) Van Dyk, S. D., Davidge, T. J., Elias-Rosa, N., Taubenberger, S., Li, W., Levesque, E. M., Howerton, S., Pignata, G., Morrell, N., Hamuy, M., & Filippenko, A. V. 2012, AJ, 143, 19
- Wongwathanarat et al. (2015) Wongwathanarat, A., Mueller, E., & Janka, H.-T. 2015, A&A, 577, A48
- Zampieri (2007) Zampieri, L. 2007, in American Institute of Physics Conference Series, Vol. 924, The Multicolored Landscape of Compact Objects and Their Explosive Origins, ed. T. di Salvo, G. L. Israel, L. Piersant, L. Burderi, G. Matt, A. Tornambe, & M. T. Menna, 358–365
- Zampieri et al. (2003) Zampieri, L., Pastorello, A., Turatto, M., Cappellaro, E., Benetti, S., Altavilla, G., Mazzali, P., & Hamuy, M. 2003, MNRAS, 338, 711
Appendix A Line identifications for model X at early and late times in the photospheric phase