XID+ a new prior-based extraction tool for Herschel-SPIRE maps
Abstract
We present XID+ a new generation of software for prior-based photometry extraction in the Herschel SPIRE maps. Based on a Bayesian framework, XID+ allows the inclusion of prior information and gives access to the full posterior probability distribution of fluxes. XID+ is developed within the Herschel Extragalactic Legacy Project (HELP) and is available at https://github.com/H-E-L-P/XID_plus.
1Aix Marseille Univ, CNRS, LAM, Laboratoire d’Astrophysique de Marseille, Marseille, France; yannick.roehlly@lam.fr
2Astronomy Centre, Department of Physics and Astronomy, University of Sussex, Falmer, Brighton BN1 9QH, UK
1 The Context
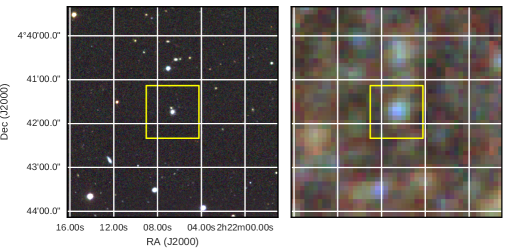
ESA’s Herschel Space Laboratory (Pilbratt et al. 2010) has given us an unprecedented view of the far-infrared sky. To take most advantage of its data, one must nevertheless beat the confusion due to the large beam size of it instruments, as illustrated in figure 1.
The Herschel Extragalactic Legacy Project (HELP) is a European Research Executive Agency funded project that aims to capitalise on the distant Universe surveys made by Herschel. To overcome the confusion problem, HELP has developed XID+ (Hurley et al. 2016), a new software to perform prior based source extraction on confused images. XID+ is being used on maps from Herschel SPIRE and PACS instruments as well as on Spitzer MIPS maps.
2 Using Bayesian Methods Gives Access to Full Posterior Probability
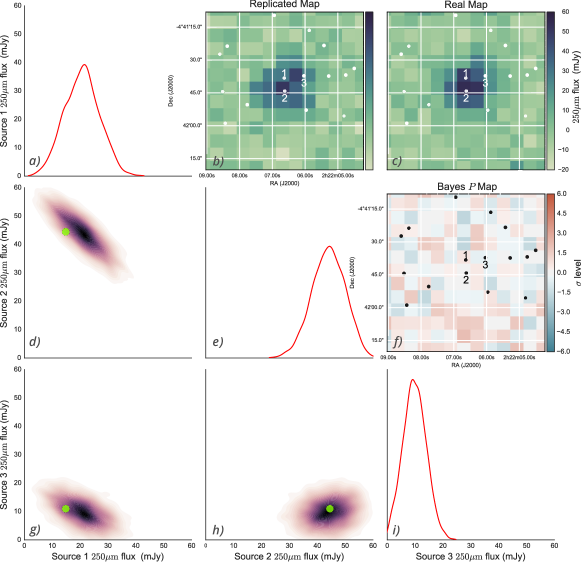
One way to overcome the confusion is to use information from resolved observations, at other wavelengths, that give the positions of known sources. XID+ uses Bayesian inference methods implemented within the Stan framework (Carpenter et al. 2016) to use this information to compute fluxes. Compared to maximum likelihood methods, this gives access to the full posterior probability of the flux distribution as illustrated in figure 2.
-
•
c) is the actual SPIRE map;
-
•
d), g) and h) are the joint probability distributions of the fluxes for each source pair;
-
•
a), e) and i) are the marginalised probability distributions of each source flux;
-
•
b) is the replicated map corresponding to the green dots on the joint distributions.
3 -Value Maps
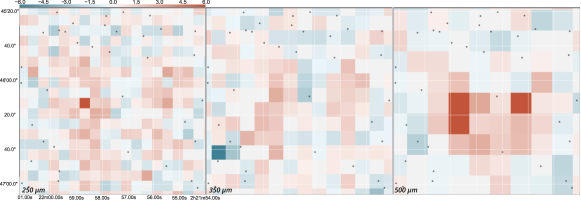
One interesting output of XID+ is the p-value map. It indicates how well the real map is explained by the model and shows unexpected excesses or lacks in fluxes. Figure 3 shows a zone with an unexplained excess in the SPIRE filter that may reveal some interesting objects not present in the original catalogues.
4 Adding More Prior Information
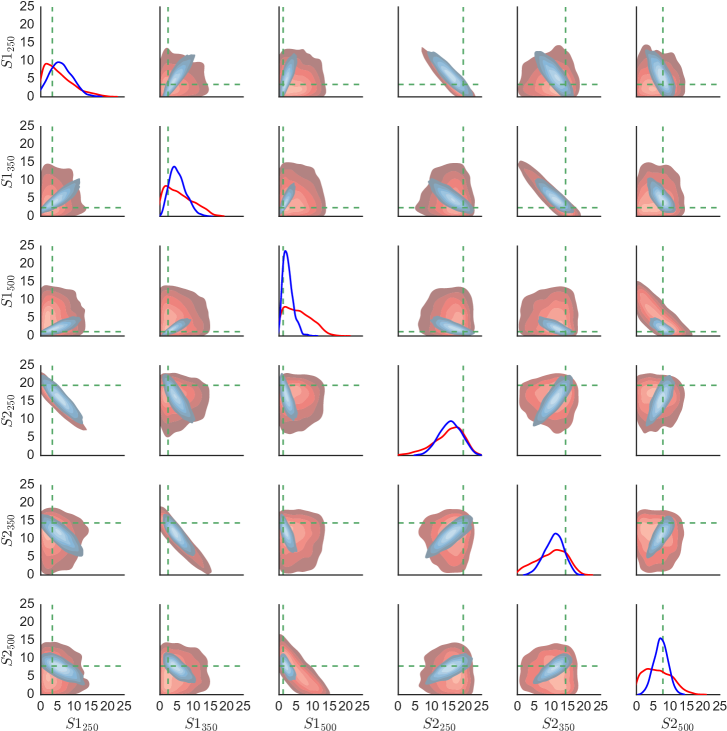
The use of a Bayesian framework makes it possible to add new prior information. For instance, we can use our prior knowledge on redshifts, combined with some simple spectral energy distributions (SEDs) to better constrain the fluxes by eliminating impossible combinations. This is illustrated by figure 4: the red (lighter grey in black and white) probability density functions (PDFs) are those that don’t use the redshift and SEDs as prior, the blue (darker grey) are those that use it.
Acknowledgments
The research leading to these results has received funding
from the European Union Seventh Framework Programme FP7/2007–2013/ under
grant agreement 607254. This publication reflects only the author’s
view and the European Union is not responsible for any use that may be made
of the information contained therein.
This research made use of Astropy, a community-developed core Python package
for Astronomy (Astropy Collaboration 2013). This research made use of APLpy,
an open-source plotting package for Python hosted at
http://aplpy.github.com.
References
- Astropy Collaboration (2013) Astropy Collaboration 2013, A&A, 558, A33. 1307.6212
- Carpenter et al. (2016) Carpenter, B., Gelman, A., Hoffman, M., Lee, D., Goodrich, B., Betancourt, M., Brubaker, M. A., Guo, J., Li, P., & Riddell, A. 2016, J Stat Softw
- Hurley et al. (2016) Hurley, P. D., Oliver, S., Betancourt, M., Clarke, C., Cowley, W. I., Duivenvoorden, S., Farrah, D., Griffin, M., Lacey, C., Le Floc’h, E., Papadopoulos, A., Sargent, M., Scudder, J. M., Vaccari, M., Valtchanov, I., & Wang, L. 2016, MNRAS. 1606.05770
- Pilbratt et al. (2010) Pilbratt, G. L., Riedinger, J. R., Passvogel, T., Crone, G., Doyle, D., Gageur, U., Heras, A. M., Jewell, C., Metcalfe, L., Ott, S., & Schmidt, M. 2010, A&A, 518, L1. 1005.5331