CHEERS Results from NGC 3393, II:
Investigating the Extended Narrow Line Region using Deep Chandra Observations and Hubble Narrow Line Imaging
Abstract
The CHandra Extended Emission Line Region Survey (CHEERS) is an X-ray study of nearby active galactic nuclei (AGN) designed to take full advantage of Chandra’s unique angular resolution by spatially resolving feedback signatures and effects. In the second paper of a series on CHEERS target NGC 3393, we examine deep high-resolution Chandra images and compare them with Hubble narrow line images of [O III], [S II] and H, as well as previously-unpublished mid-ultraviolet (MUV) images. The X-ray provide unprecedented evidence that the S-shaped arms which envelope the nuclear radio outflows extend only () across. The high-resolution multiwavelength data suggest that the ENLR is a complex multi-phase structure in the circumnuclear ISM. Its ionization structure is highly stratified with respect to outflow-driven bubbles in the bicone and varies dramatically on scales of pc. Multiple findings show likely contributions from shocks to the feedback in regions where radio outflows from the AGN most directly influence the ISM. These findings include H evidence for gas compression and extended MUV emission, and are in agreement with existing STIS kinematics. Extended filamentary structure in the X-rays and optical suggests the presence of an undetected plasma component, whose existence could be tested with deeper radio observations.
1 Introduction
Active Galactic Nuclei (AGN) are well-known to play an important role in the evolution of galaxies, where a supermassive black hole (SMBH) central engine converts gravitational energy into radiative or kinetic energy. Kinematic outflows such as radio-emitting jets, or conically-shaped regions of highly ionized gas extending from the AGN itself have been associated with these nuclei. The ionization cones emit brightly in narrow emission lines from species across the electromagnetic spectrum such as [O III], or at higher photon energies such as in X-rays (see, e.g. Heckman & Best 2014; Netzer 2015, for recent reviews).
This AGN Narrow Line Region (NLR) provides a major tool for studying the interaction of the AGN with its host galaxy on scales of hundreds of pc to kpc or more. At larger scales (few kpc) and in the absence of large-scale jets, we may see Extended Emission Line Regions (EELRs) where line excitation is dominated by a photoionizing spectrum emitted from the accretion disk surrounding the SMBH itself, and these EELRs may provide clues into the radiative history of the AGN on timescales of the light-crossing time of the galaxy (Keel et al. 2012, 2015). However, the common presence of small-scale jets may complicate this picture, transferring accretion-powered kinematic energy into the surrounding gas and thereby stimulating X-ray or optical emission (Wang et al. 2011b, a, c; Paggi et al. 2012; Keel et al. 2015; Sartori et al. 2016) on scales of the Extended Narrow Line Region (ENLR) or smaller. Such small-scale outflows may be related to similar phenomena observed with regularity in stellar-mass black holes, whereby the accretion state switches between radiative and kinematic modes dependent in part upon the current Eddington fraction (e.g. Fender et al. 2004).
The processes forming the NLR and ENLR provide a particularly important window through which to understand AGN feedback, the process by which an AGN regulates its accretion rate from surrounding gas via radiative and kinematic processes (see Fabian 2012, for a review). Via such feedback processes, the AGN can heat or eject its fuel supply, thereby reducing its accretion rate, and possibly starve itself completely.
The difficulty involved in modeling the ENLR implies considerable complexity. In order to tease out the relative contributions of different feedback processes and the different states of ENLR gaseous media, we have undertaken a CHandra survey of Extended Emission line Regions in nearby Seyfert galaxies (CHEERS). Using Chandra X-ray data of sufficient signal-to-noise to take advantage of Chandra’s sub-pixel resolving capability coupled with narrow-line Hubble images, we are able to distinguish X-ray and optical line-emitting regions on scales of pc, in order to distinguish between photo-ionized and shocked feedback regimes.
This work builds upon the study of NGC 4151 by Wang et al. (2011b, a, c), and that of Mkn 573 by Paggi et al. (2012). In both cases, comparison of Chandra, Hubble and VLA images led to the identification of spatially resolved photoionized regions and collisional gas between its jet radio lobes and optical arcs. Here, we investigate the galaxy NGC 3393 (catalog ) in the second paper of a series on that object (Maksym et al. 2016).
At , NGC 3393 is a nearby, bright ( de Vaucouleurs et al. 1991) Seyfert 2 galaxy. Like Mkn 573, NGC 3393 has prominent S-shaped emission line arcs associated with a triple-lobed radio source within kpc-scale ionization cones (Cooke et al. 2000). NGC 3393 is also Compton thick, as supported by observations from BeppoSAX (Maiolino et al. 1998), XMM-Newton (Guainazzi et al. 2005), the Swift Burst Alert Telescope (Burlon et al. 2011, ), and NuSTAR (Koss et al. 2015).
Cooke et al. (2000) previously used Hubble pre-COSTAR narrow filter optical imaging of [O III] and H+[N II], as well as Hubble Faint Object Spectrograph (FOS) and ground-based spectroscopy, and VLA radio data, to identify the S-shaped arcs in NGC 3393 and to study the galaxy’s extended narrow line emission. They determined the predominant method of ENLR excitation was likely to be photoionization, but could not rule out a role for shocks.
Subsequent resolved X-ray studies using Chandra (Bianchi et al. 2006; Levenson et al. 2006) determined that the soft X-rays associated with the AGN are extended on scales of kpc and show strong morphological correlation with the extended [O III] features. Bianchi et al. (2006) suggest this correlation points to origins of a single photoionized medium giving rise to the [O III] and X-rays. This correlation is supported by Koss et al. (2015), who find that deeper CHEERS observations and zeroth-order Chandra imaging support prior associations between [O III], X-rays, and radio emission.
In Maksym et al. (2016), we used continuum-subtracted HST narrow-line observations to demonstrate that the ENLR of NGC 3393 was predominantly Seyfert-like with a LINER cocoon surrounding the nuclear bicone-and-jets structure. Here, we produce a more extensive analysis of the HST narrow-line observations, complemented by X-ray images which take advantage of Chandra’s mirror resolution. We directly compare the spatial distribution of [O III], [S II] and H using the CHEERS post-COSTAR data, and expand upon previous work by Cooke et al. (2000) and Koss et al. (2015) by using [O III]/H and [S II]/H ratio maps to distinguish regions of relative ion species dominance. These line ratio maps are of interest because [O III]/H typically indicates photoionization, while [S II]/H is a common indicator of shocks or enhanced density, and hence kinematic feedback.
The CHEERS WFC3 data are deeper than the narrow line images used by Cooke et al. (2000) and do not require deconvolution, allowing more detailed investigation into the narrow line morphology. Koss et al. (2015) note a general correspondence between O III and X-ray emission, as well as the expected role of the radio jets in shaping the ENLR, but here we examine the ENLR X-ray morphology in greater detail, examining the physical origin of ENLR substructure. Such inquiry is enabled by our use of EMC2 Bayesian deconvolution (Esch et al. 2004; Karovska et al. 2005, 2007, see Fig. 1) with respect to the X-ray images, as well as our analysis of the S II images, which were not used by Cooke et al. (2000) or Koss et al. (2015).
In §2, we summarize the origin and processing of our HST, Chandra and VLA observations of NGC 3393. In §3, we describe the methods we use to obtain deconvolved X-ray images and narrow line image maps from processed data. In §4, we examine and compare the relative morphologies of the resulting narrow-line, X-ray and radio images, particularly with respect to the inner kpc of the galaxy. In §5, we discuss the physical implications of the multi-wavelength morphology in the NLR and ENLR and examine the physical implications for the origins of this emission. In §6, we summarize our results and the implications for future research.
Throughout this paper, we adopt concordant cosmological parameters111Distances are calculated according to http://www.astro.ucla.edu/ wright/CosmoCalc.html of km-1 sec-1 Mpc-1, =0.3 and =0.7. All coordinates are J2000. In all figures, celestial North is up and color scales are logarithmic (unless otherwise noted). For distance evaluation we use the Theureau et al. (1998) determination of redshift from observations of the 21-cm neutral hydrogen emission line, such that NGC 3393 is at distance Mpc with linear scale .
2 Observations and Data Reduction
2.1 ACIS/Chandra Data
| Obsid | Obs Date | Exposure (ks) | Grating | Net Countsa | Net Countsa |
| 0.32 keV | 210 keV | ||||
| 04868 | 2004 Feb 28 | 29.33 | NONE | ||
| 12290 | 2011 Mar 12 | 69.16 | NONE | ||
| Imaging | … | 98.49 | NONE | ||
| 13967 | 2012 Feb 29 | 176.78 | HETG | ||
| 14403 | 2012 Mar 06 | 77.72 | HETG | ||
| 14404 | 2012 Apr 02 | 56.68 | HETG | ||
| 13968 | 2012 Apr 08 | 28.06 | HETG | ||
| Gratings | … | 339.24 | HETG | ||
| Merged | 437.73 | MERGE |
NGC 3393 was observed by the Chandra Advanced CCD Imaging Spectrometer (ACIS) six times (See Table 1); of these observations, four used the High Energy Transmission Grating (HETG). The two imaging observations were centered on the back-illuminated S3 chip of the ACIS-S array: once on 2004 February 28 for 29 ks (obsid 4868) and once on 2011 March 12 for 69 ks (obsid 12290). Obsid 12290 was performed as part of the CHEERS survey. The source was also observed four times with the High Energy Transmission Grating (HETG), on 2012 February 29 (obsid 13967), 2012 March 06 (obsid 14403), 2012 April 02 (obsid 14404), and 2012 April 08 (obsid 13968). The observations performed using the grating produce a zeroth-order image which is functionally similar to imaging observations, and we include these observations in some of our analysis. We retrieved the data from the Chandra Data Archive222http://cda.harvard.edu/chaser and reduced them using the Chandra Interactive Analysis of Observations package (CIAO; Fruscione et al. 2006) version 4.7, and version 4.6.8 of the Chandra Calibration Data Base (CALDB). In order to take better advantage of the angular resolution of the Chandra High Resolution Mirror Assembly (HRMA), which has but is undersampled by the native ACIS pixels, we reprocessed the data using the ACIS Energy-Dependent Subpixel Event Repositioning algorithm (EDSER; Li et al. 2003). EDSER removes the artificially-introduced position blurring of the ACIS pipeline and instead takes advantage of event charge patterns and aspect dithering to improve event position estimates, and has been used reliably in many cases (e.g. Harris et al. 2004; Wang et al. 2011b; Paggi et al. 2012).
We used the CIAO tool wavdetect to identify point sources in the field-of-view, which we exclude from analysis of extended emission. Examining only source-free regions, we excluded periods of high background by using the deflare CIAO tool to identify field count rates in excess of above the quiescent level (though in practice these ‘flaring periods’ were negligible). To determine the significance of pileup, we generated a pileup map using the pileup_map tool. Pileup is minor, reaching within of the nucleus. We corrected astrometry relative to the longest imaging observation (obsid 12290) by using wcs_match to compare source lists across observations, then adjusted the aspect and event file astrometry using CIAO tools reproject_aspect and wcs_update.
In order to identify and examine fainter features, we created merged event files using merge_obs. The Point Spread Function (PSF) for zeroth-order images using ACIS-HETG images is not as well understood at subpixel scales as for non-grating images. We therefore generate separate merged event files and images for pure imaging and zeroth-order imaging observations and treat the pure imaging observations as our primary dataset. We note, however, that we observe good agreement between pure imaging and zeroth-order imaging observations on scales of , as allowed by the limits of photon statistics.
2.2 Optical/UV/IR Data
| Dataset | Obs Date | Exposure (s) | Instrument | Filter | Note |
|---|---|---|---|---|---|
| 5730 | 1994 Nov 22 | 260 | WFPC2 | F218W | MUV |
| IBIG06010 | 2011 Nov 11 | 147 | WFC3/IR | F110W | |
| IBIG06020 | 2011 Nov 11 | 422 | WFC3/IR | F160W | |
| IBIG06030 | 2011 Nov 11 | 1230 | WFC3/UVIS | F336W | NUV |
| IBIG06040 | 2011 Nov 11 | 444 | WFC3/UVIS | F438W | B-band |
| IBIG06050 | 2011 Nov 11 | 2040 | WFC3/UVIS | F814W | I-band |
| IBLY01011 | 2011 May 16 | 566 | WFC3/UVIS | FQ508N | [O III] |
| IBLY01021 | 2011 May 17 | 466 | WFC3/UVIS | F665N | H+[N II] |
| IBLY01GWQ | 2011 May 17 | 208 | WFC3/UVIS | F547M | line continuum |
| IBLY01GXQ | 2011 May 17 | 208 | WFC3/UVIS | F621M | line continuum |
| IBLY01GYQ | 2011 May 17 | 314 | WFC3/UVIS | F673N | [S II] |
To compare the spatial distribution of X-ray emission from NGC 3393 with optical emission, we also obtained HST images from the Hubble Legacy Archive333http://hla.stsci.edu/hlaview.html. NGC 3393 has been extensively observed by HST, but in particular we examined CHEERS data (program 12365, PI: Wang) obtained using WFC3 in the UVIS mode. CHEERS observations were taken on 2011 May 16 and 17 in filters FQ508N, F665N, F547M, F621M, and F673N for 566s, 466s, 208s, 208s and 314s respectively (see Table 2).
The quad filter FQ508N covers a narrow Å range around [O III]Å at the redshift of NGC 3393 and is cleanly separated from other prominent emission lines (notably [O III]Å). F665N spans Å around redshifted H,, and includes [N II]. F673N covers Å around the redshifted [S II]6716,6731 doublet. Measurements for the [O III] continuum are taken from the F547M band, while the continuum of H+[N II] and [S II] is inferred from F621M, both of which we expect to be relatively free of prominent emission lines. We also use the 2011 November 11 observations taken for HST program 12185 (PI: Greene) in F336W (NUV), F438W (B-band), F814W (I-band), F110W (m) and F160W (m), and older but previously unpublished HST WFPC2 images taken on 1994 November 22 using F218W (PI: Baldwin).
We processed the HST images according to the same techniques described in Maksym et al. (2016), using the standard HST data processing package AstroDrizzle (Gonzaga & et al. 2012) for Pyraf installed through the version 1.5.1 release of Ureka444http://ssb.stsci.edu/ureka/. As before, we were unable to correct the images for charge transfer efficiency (CTE).
Spitzer 3.5m IRAC data were observed under Program #10098, PI: Stern, and are taken from the Spitzer Heritage Archive555http://sha.ipac.caltech.edu/applications/Spitzer/SHA/.
2.3 Radio Data
| Obs Date | Frequency (GHz) | Resolution (″) |
|---|---|---|
| 1991 Oct 11 | 1.51 | 2.77 |
| 1991 Oct 11 | 4.89 | 0.83 |
| 1991 Oct 11 | 8.46 | 0.50 |
| 1992 Nov 29 | 1.45 | 1.79 |
| 1992 Nov 29 | 4.89 | 0.50 |
| 1992 Nov 29 | 8.46 | 0.29 |
| 1993 Feb 4 | 4.89 | 1.04 |
To analyze radio emission from NGC 3393, we obtained VLA images from the NRAO Science Data Archive666https://archive.nrao.edu/archive/archiveimage.html. NGC 3393 has been observed by the VLA at 1.51 GHz, 4.89 GHz and 8.46 GHz on 1991 October 11, at 1.45 GHz, 4.89 GHz and 8.46 GHz on 1992 November 29, and at 4.89 GHz on 1993 February 4. The angular resolution of these images ranges between for 8.46 GHz on 1992 November 29 and for 1.51 GHz on 1991 October 11. These observations are summarized in Table 3.
We examine the 1.51 GHz image and see that the central nuclear structure is marginally resolved, with no evidence for extended structure at which might otherwise be “resolved out” at higher resolutions. Other observations show compact northeastern and southwestern radio lobes at from the nucleus. We will henceforth exclusively use the 8.46 GHz images with resolution, since we are primarily interested in structural morphology of the circumnuclear region, and all other images lack additional structural information due to lack of resolution or elongation of the beam PSF.
3 Image Analysis
3.1 Chandra PSF Modeling and Image Deconvolution
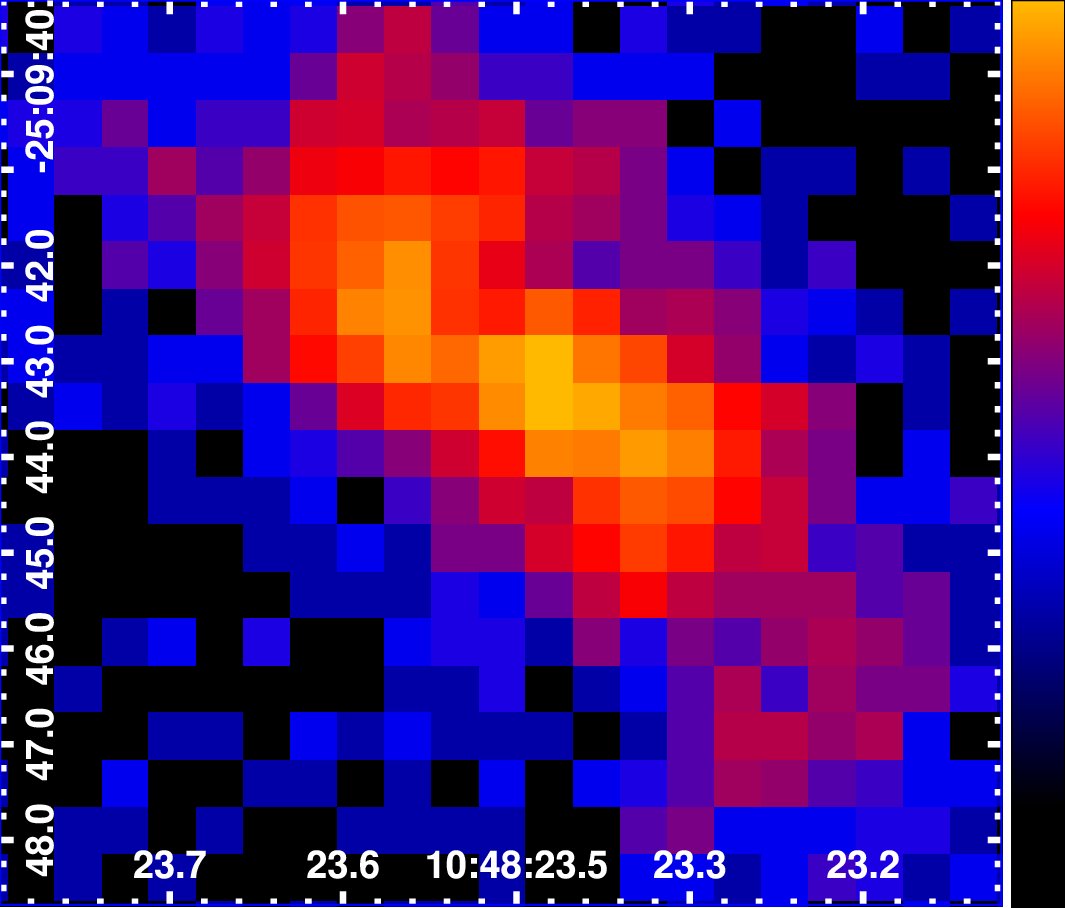
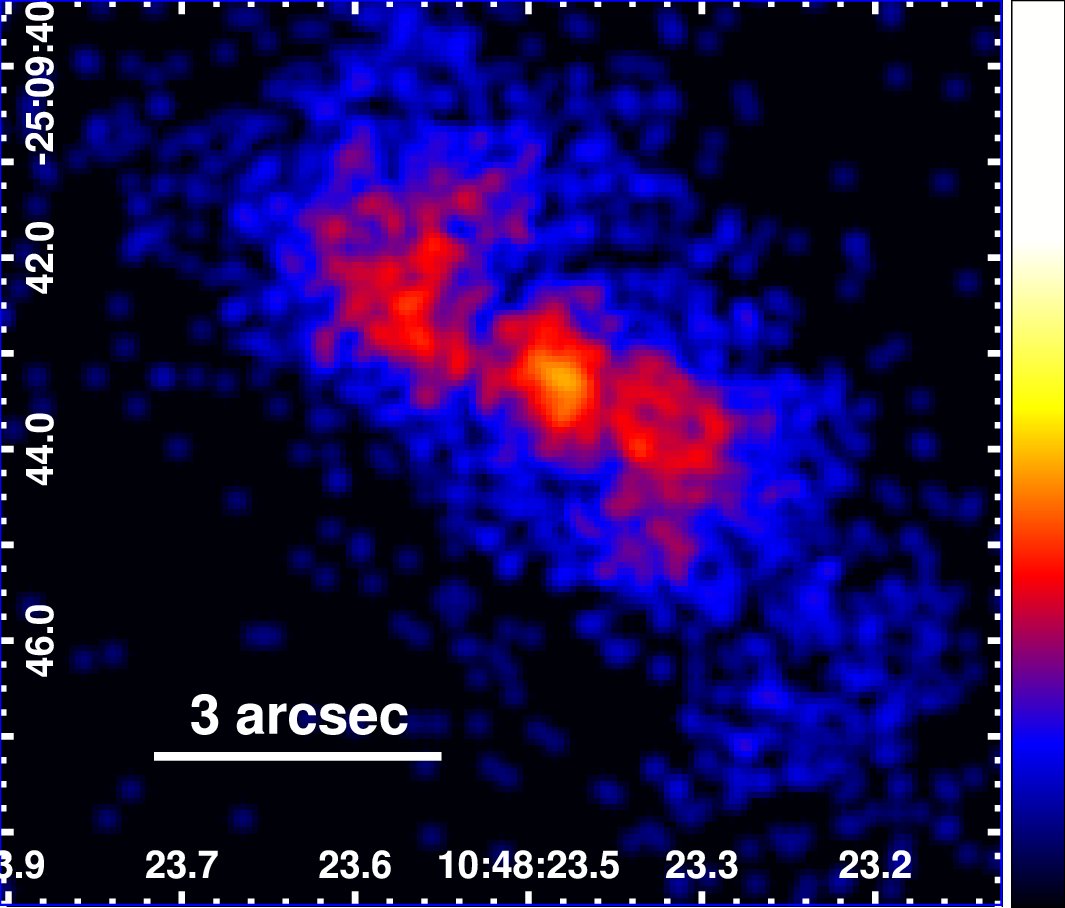
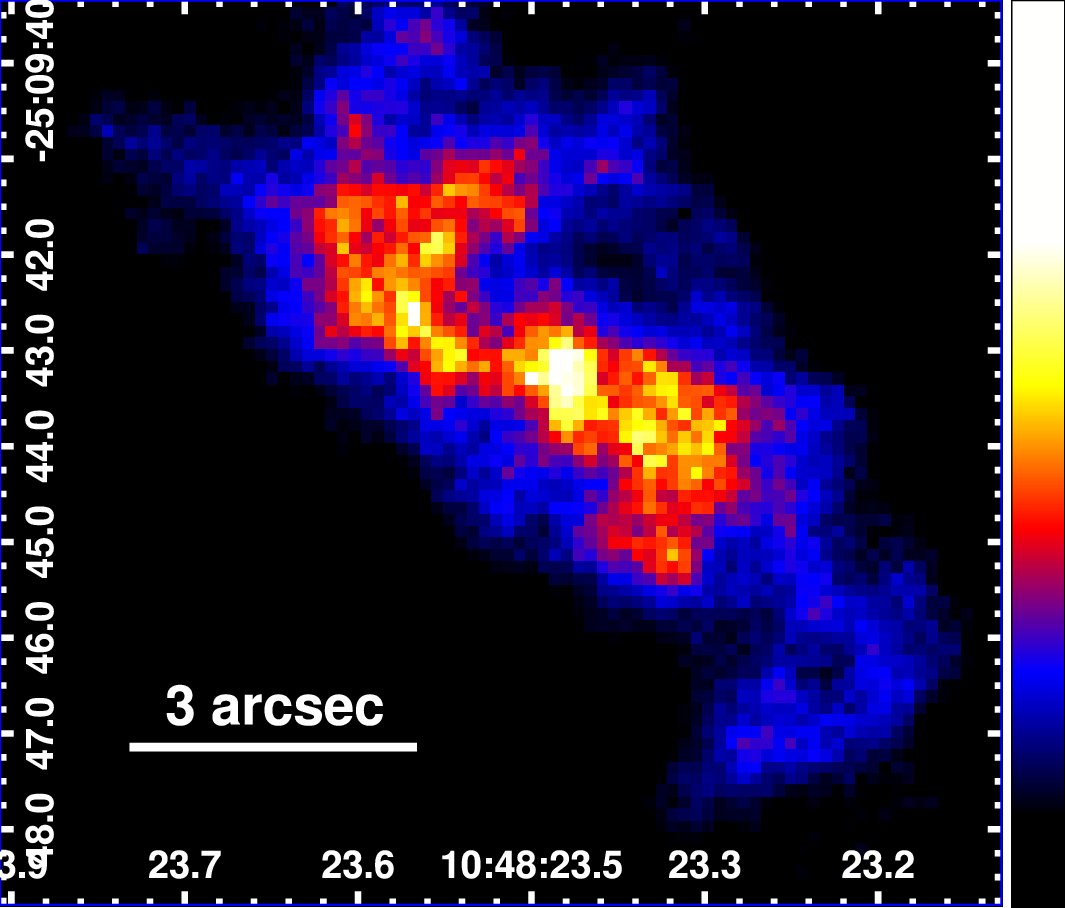
Following standard Chandra science threads777http://cxc.harvard.edu/ciao/threads/prep_chart/, we simulated the point spread function (PSF) of the imaging observations (obsids 4868 and 12290) using the Chandra Ray Tracer (ChaRT888http://cxc.harvard.edu/chart/ v2; Carter et al. 2003), taking into account source spectrum, off-axis angle, and aspect solution. We then used MARX (Davis et al. 2012) to generate a PSF image from the raytraced simulation.
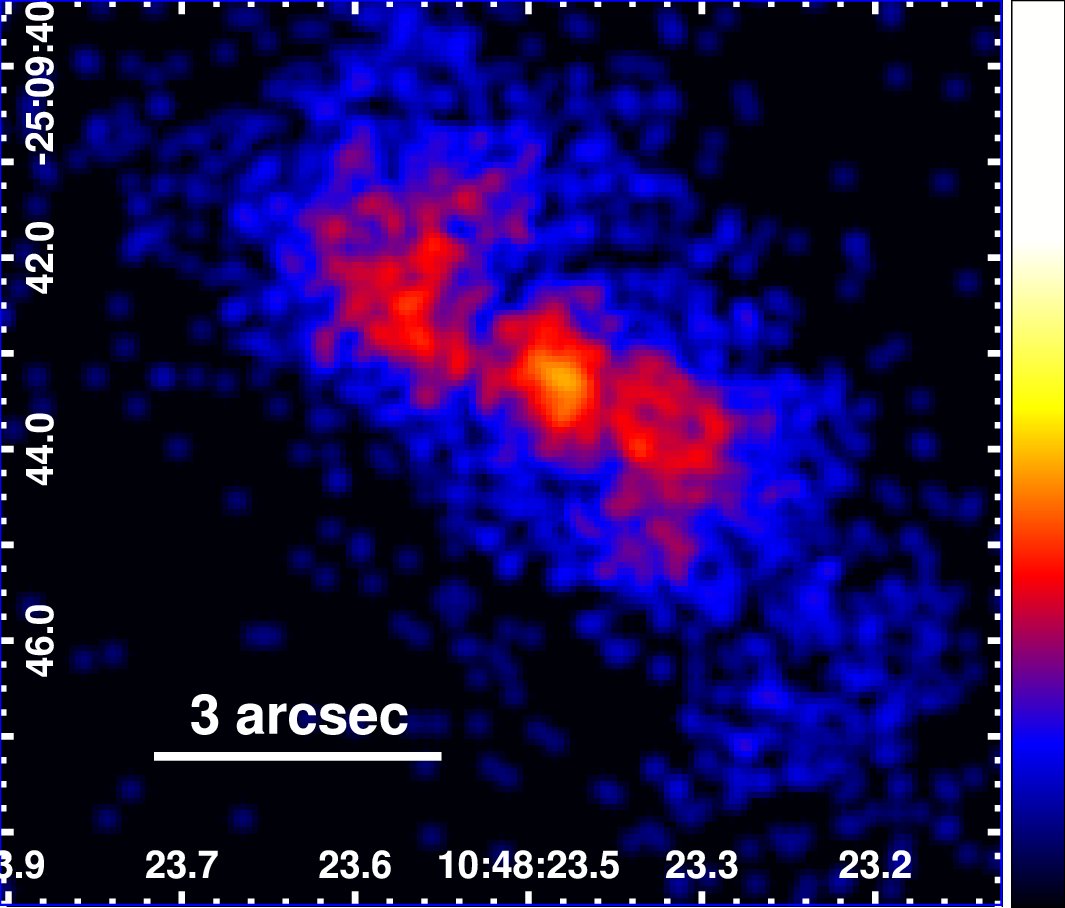
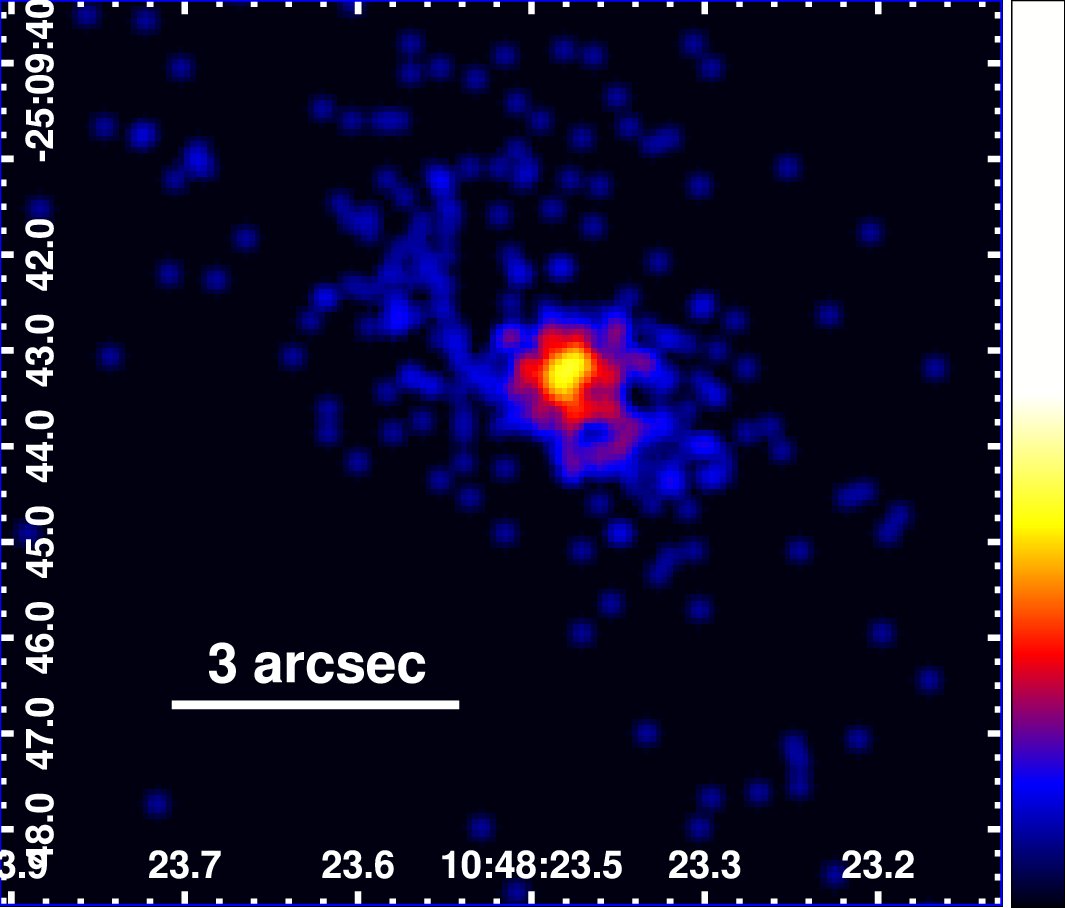
We deconvolved the X-ray image using the Expectation through Markov Chain Monte Carlo (EMC2; Esch et al. 2004; Karovska et al. 2005, 2007) algorithm. We used the longest imaging observation (obsid 12290) in order to avoid systematic effects due to combining different PSFs in deconvolution. Grating zeroth order images were not used for deconvolution because the PSF is not reliable on relevant scales in this mode. We achieved the best-significance results from EMC2 using an input image with subpixel spatial binning at 1/4 of the native pixel size () using a broad band (keV) for obsid 12290, excluding only high and low energies with typically poor ACIS signal-to-noise levels. For comparison, we display the broad keV image of NGC 3393 in Fig. 1 binned at native ACIS pixel size, as well as a smoothed image binned to 1/8 native pixel size, and the broad image deconvolved at 1/4 native pixel size using EMC2. Although 1/8 pixel scale oversamples the Chandra PSF, the 1/4 pixel scale is the practical limit for deconvolution given the counting statistics of the data.
3.2 Hubble Narrow Line Mapping
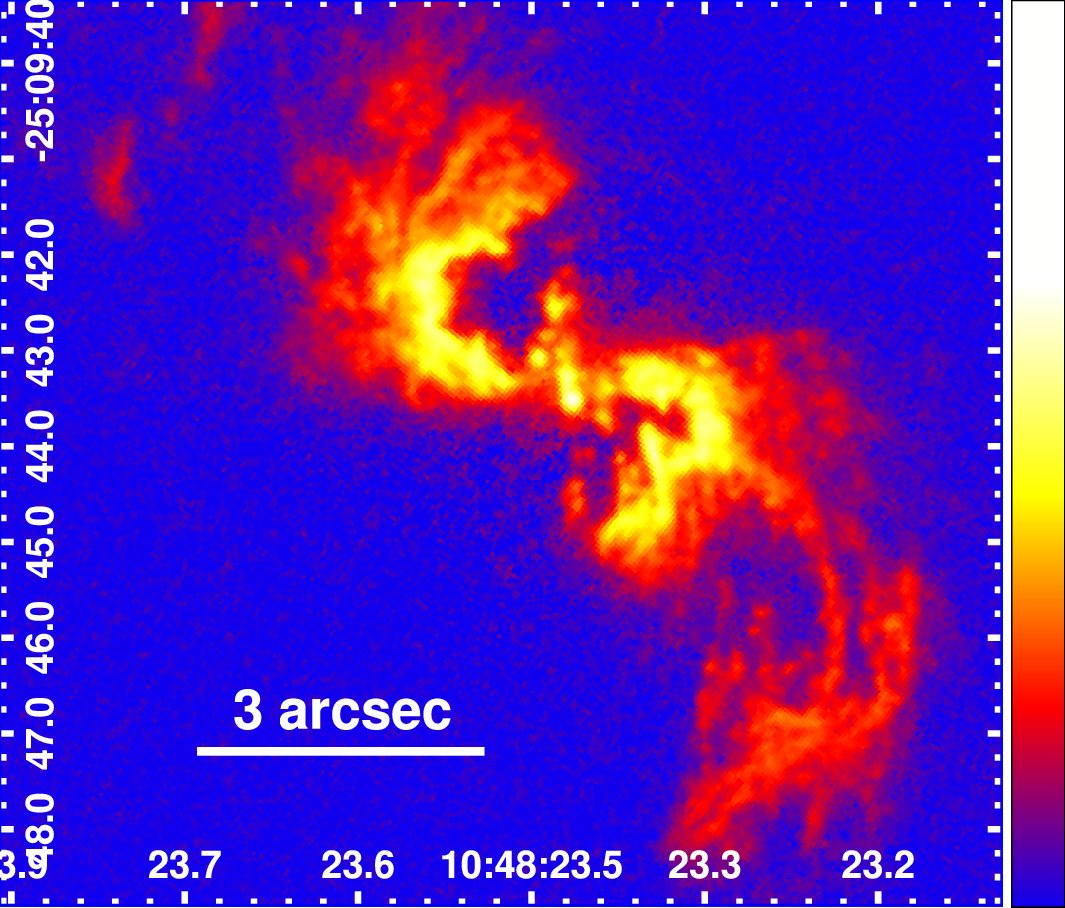
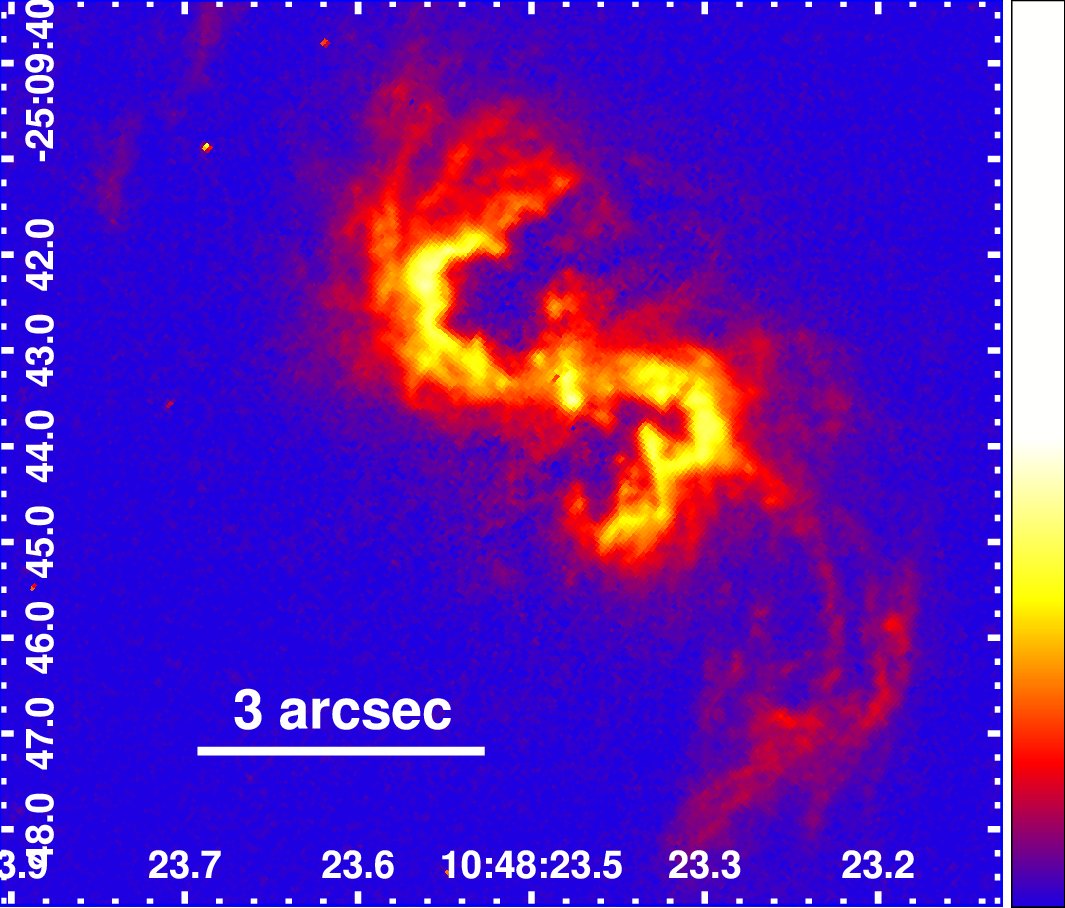
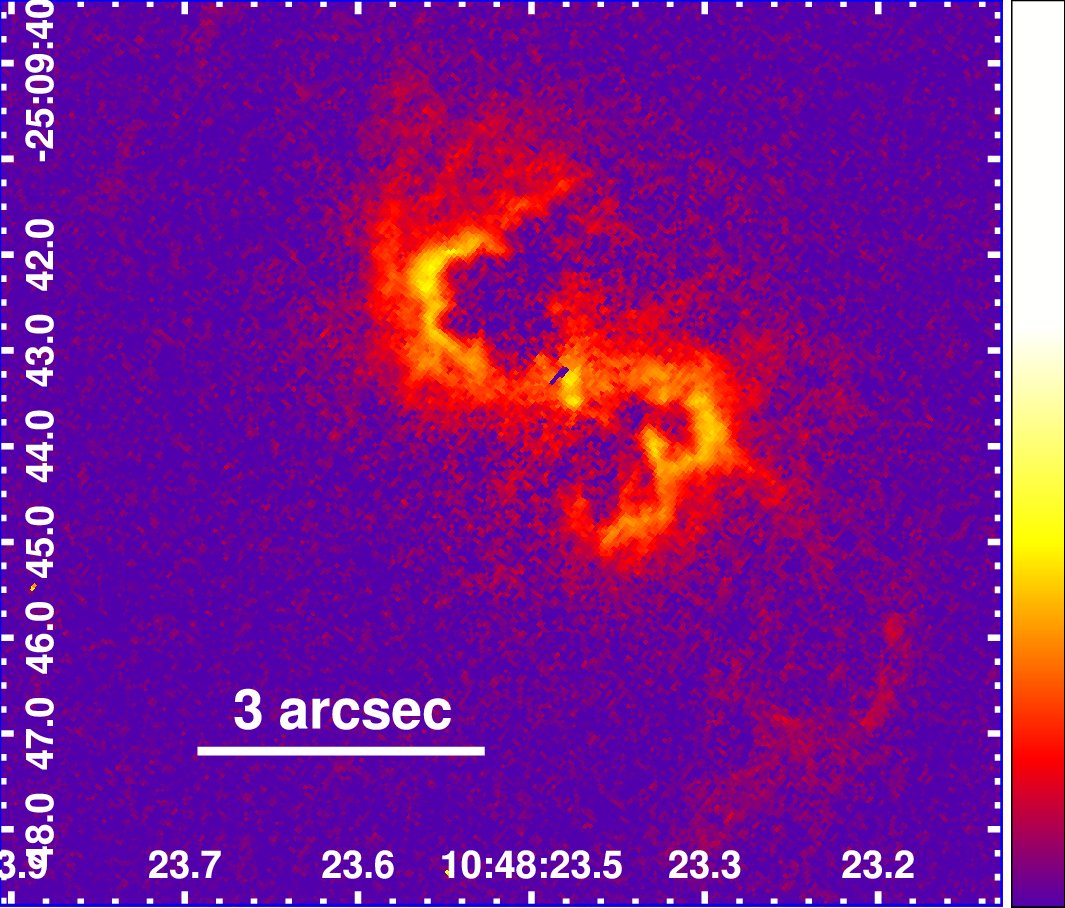
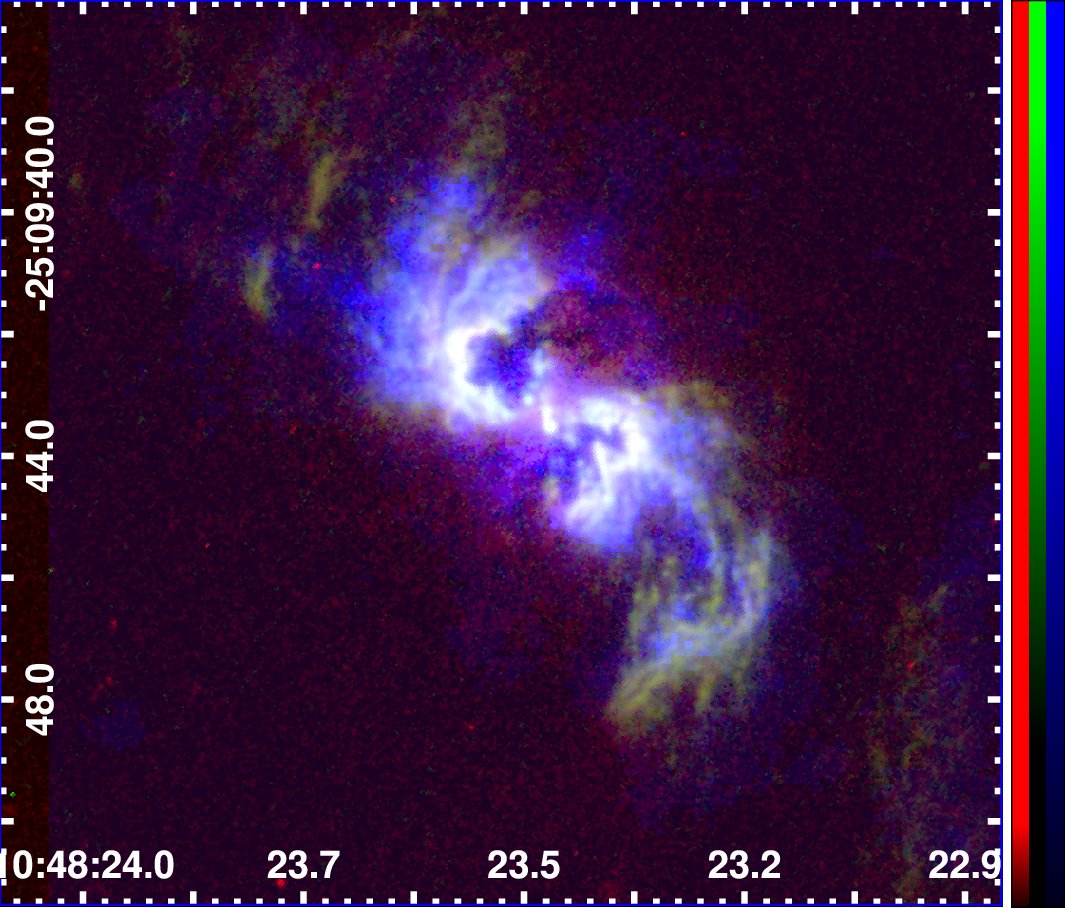
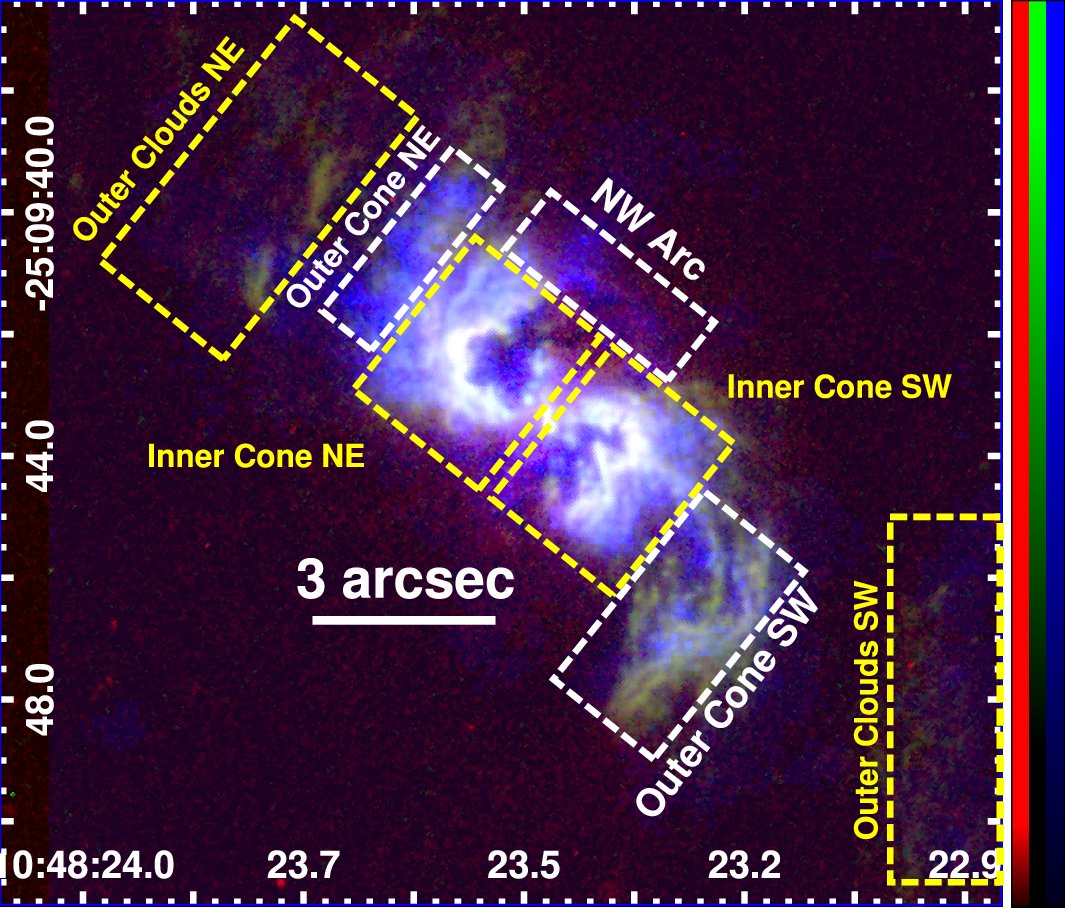
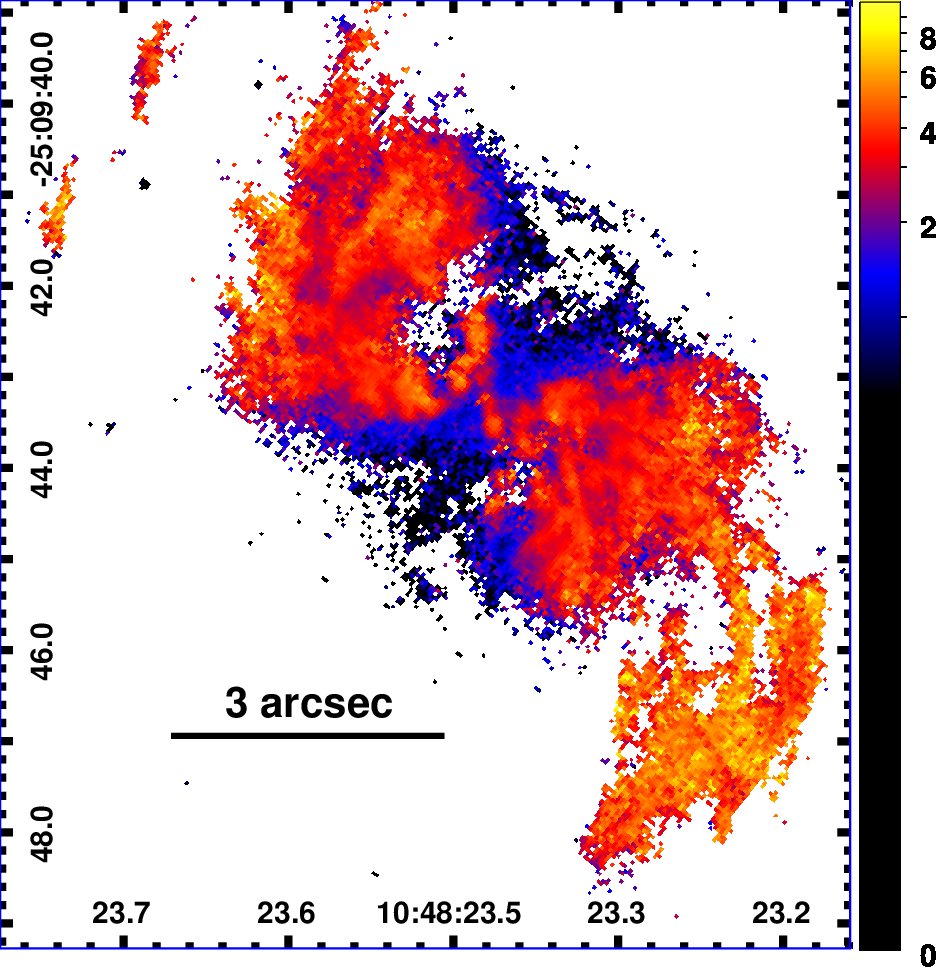
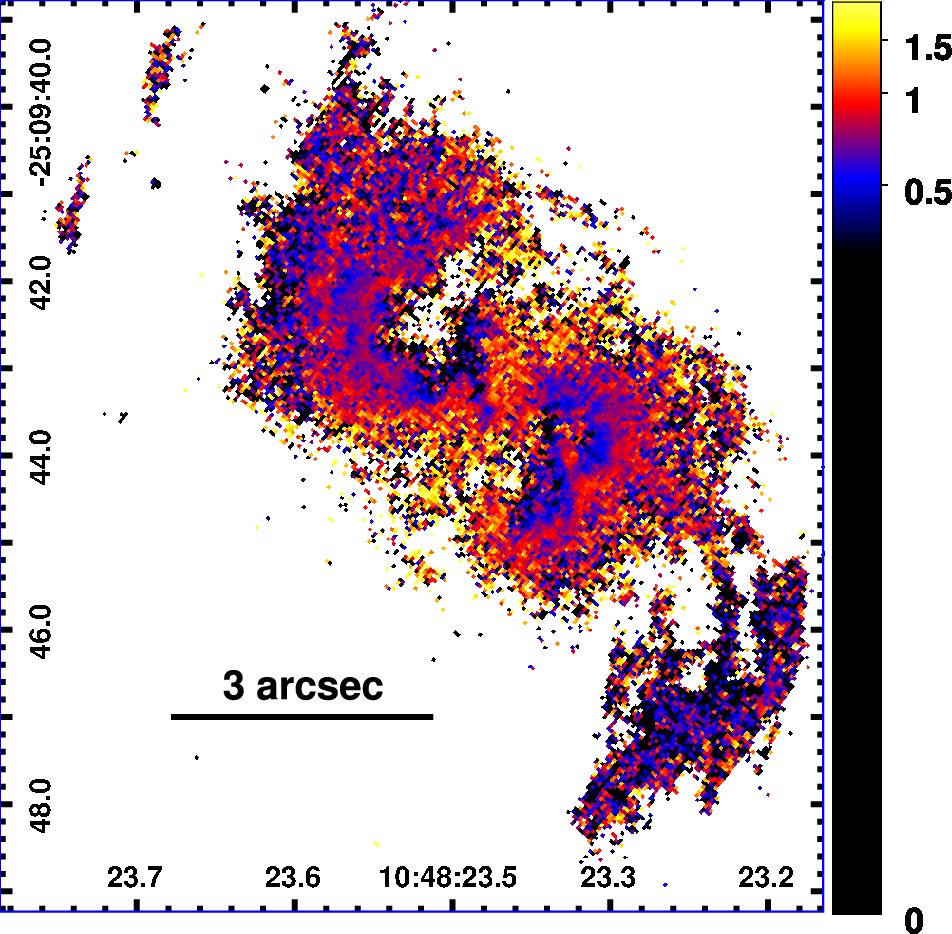
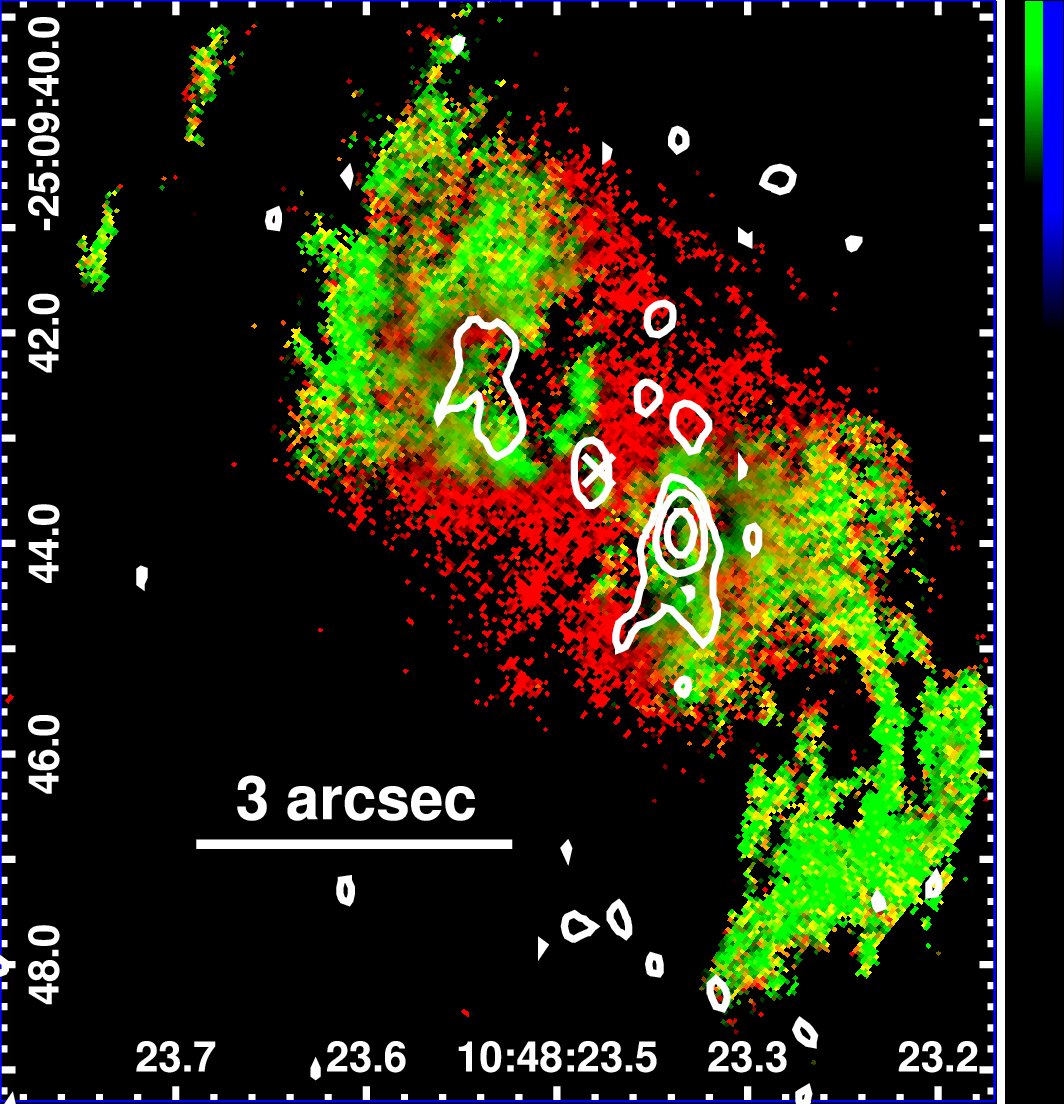
We produced continuum-subtracted emission line maps of [O III]Å, H, and [S II] 6716,6731 from the HST narrow line filter observations (Table 2) using the same methods described in Maksym et al. (2016). The final continuum-subtracted line surface brightness images are displayed in Fig. 2. In Fig. 3, we display a 3-color map of H, [O III], and the deconvolved keV emission. In order to map the relative strengths of [O III], H , and [S II]6716,6731, we produce ratio maps of [O III]/H and [S II]/H using dmimgcalc. These line ratio maps are shown in Fig. 4 and discussed in §4.1. Typical uncertainties in the low flux limit are for (H,[O III],[S II]).
4 Results
4.1 Optical/UV/IR Morphology

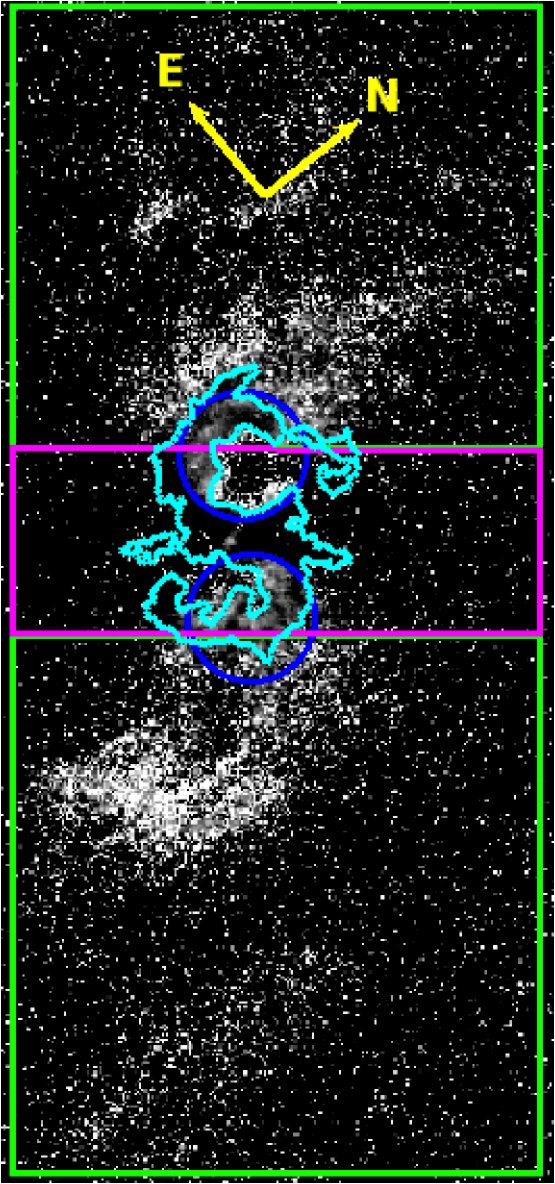
For the purpose of clarity, we sub-divide the central ENLR into multiple spatial regions, shown in Fig. 3. In particular, we refer to the ionization cone as having northeastern (NE) and southwestern (SW) directions, each of which is sub-divided into inner and outer portions. The NE and SW ionization cones are also associated with narrow-line outer clouds at in either direction.
In order to investigate the physical origins of these structures and their relations to ionizing radiation from the AGN and kinematic feedback from the jets, we also compare the line ratio maps for [O III]/H and [S II]/H of the H-bright regions in Fig. 4.
In Fig. 5, we show a large scale map and disk for context in the galaxy structure, using Spitzer 3.6 m (IR; starlight), [O III], and F336W (NUV; young stars unobscured by dust). With different scaling, [O III] from the outer clouds SW appears associated with the outer edge of the central F336W and F438W stellar structure, indicating a possible association with dust or a gap.
From larger () to smaller () scales, the [O III]/H and [S II]/H maps are strikingly complementary. This morphology becomes clearer when we overlay the line ratio maps directly in Fig. 6. Regions of enhanced [S II]/H typically occupy regions of weak [O III]/H, and vice-versa.
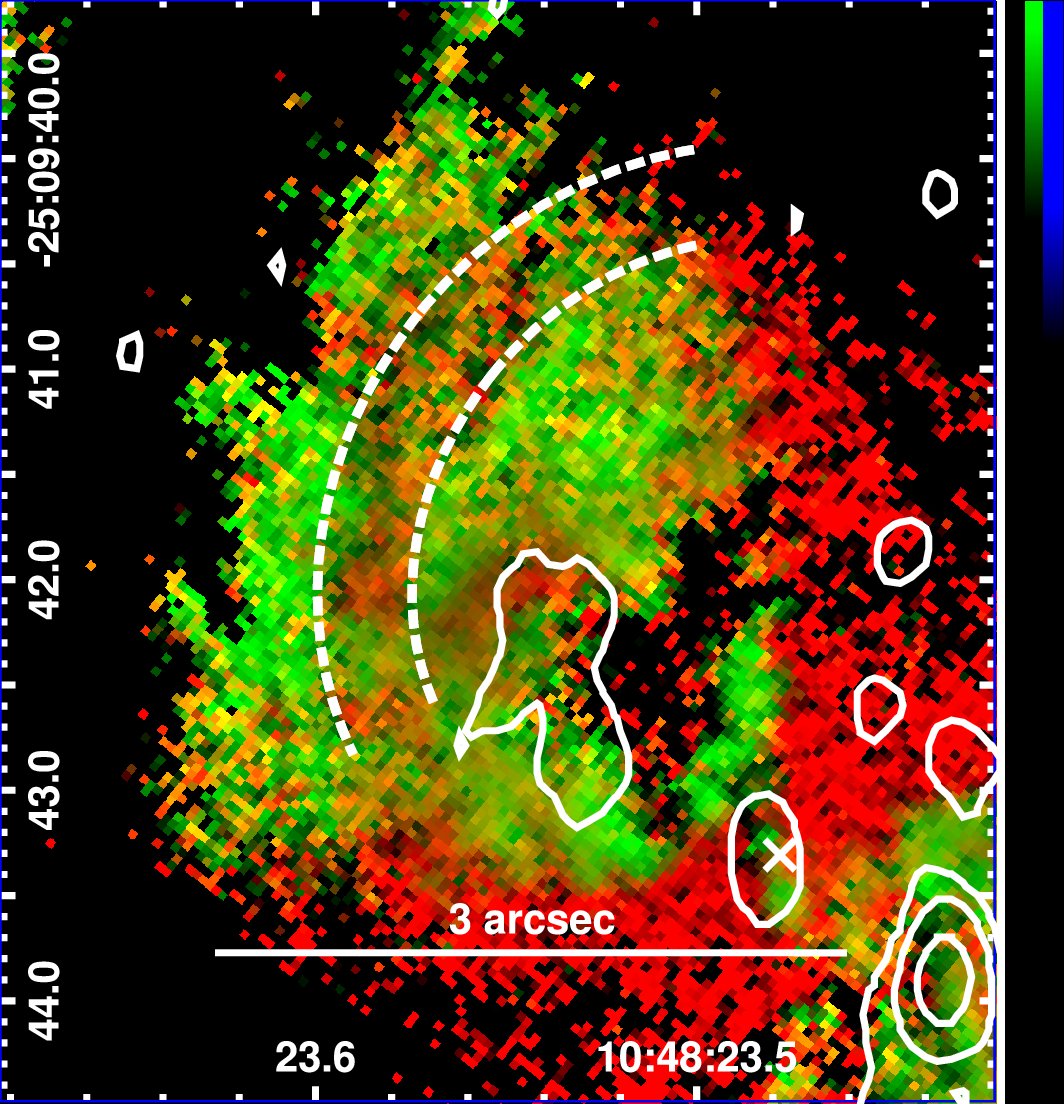
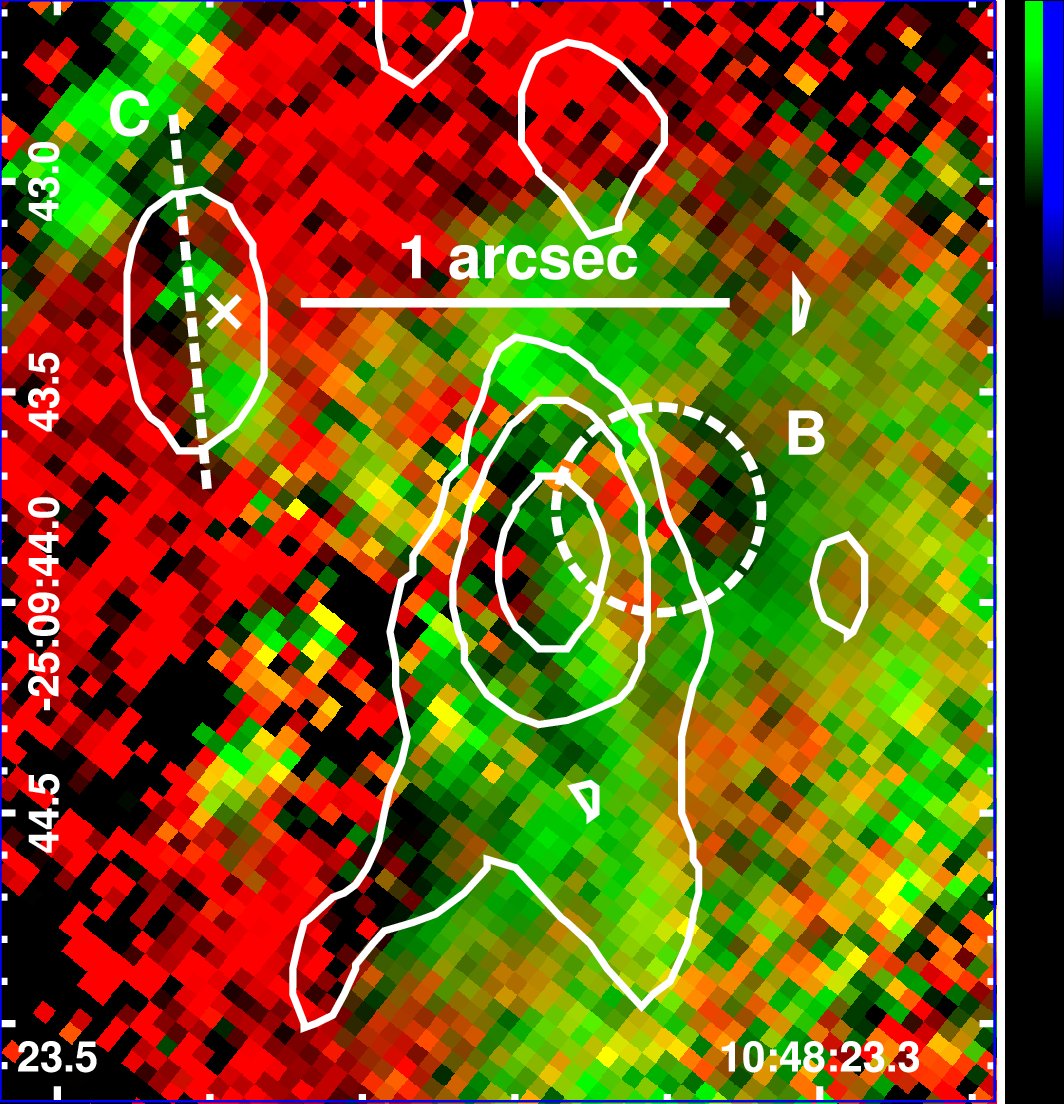
The high [S II]/H region has an hourglass-shaped cocoon morphology which encloses the regions of enhanced [O III]/H. Instead, high [O III]/H, which measures excitation, is largely confined to the ionization cones. Regions with strong [S II]/H and weak [O III]/H include the central cross-cone region, the regions immediately outside the inner cones, and a second, larger ridge along the NE arm.
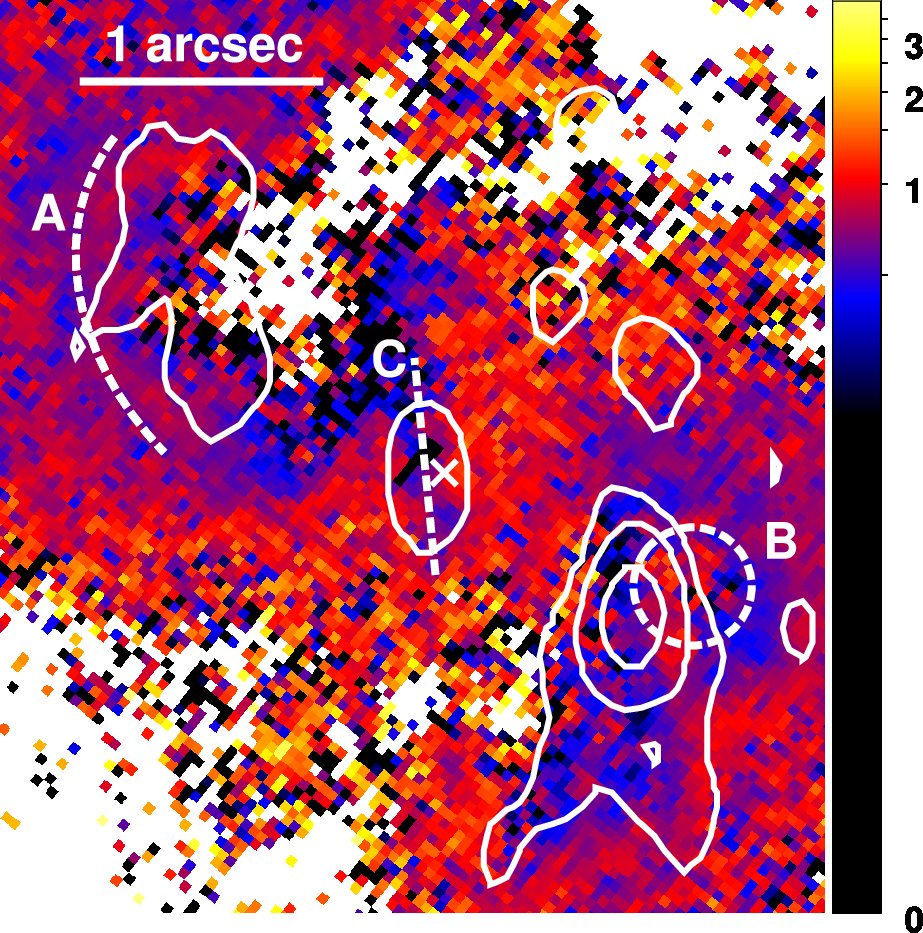
Although several prominent knots of enhanced [O III]/H are near the nucleus, average [O III]/H becomes stronger at larger radii (Fig. 7), particularly in the outer cones (defined in Fig. 3). Regions with strong [O III]/H and weak [S II]/H include the outer ionization cones and outer clouds, as well as a high-ionization north-south region (marked C in Fig. 4) at the nucleus.
The edges of the inner cones which transition to the outer cones tend to be strong in both [O III]/H and [S II]/H.
Both [S II]/H and [O III]/H exhibit low-strength cavities inside the inner cones. Filamentary structures of strong [O III]/H dominate the edges of these cavities (Fig. 6). Regions with strong [O III]/H and strong [S II]/H include the transitions between the inner and outer cones.
The S-shape in NGC 3393 is defined by the fact that each bubble appears bounded by narrow line emission on its far and counter-clockwise sides, but has a gap on its clockwise side where the emission is faint (taking the galactic nucleus as the origin in radial coordinates). On the bright ridge of the SW arm in a strip measured 136 east of north ( in length, spanning in azimuth), we find typical [S II] surface brightness, within 1.7″ of the nucleus. At 137 west of north from the nucleus, we find , with no detection over a gap. For a segment oriented east of north connecting the NE arm to the SE end of the gap, we find , with no detection over a gap. For the same angle along the bright ridge of the outer cone NE, we find , as in the SW arm. Examining nearby circular regions with , we determine an upper limit of at significance. The counter-clockwise sides of both bubbles therefore emit [S II] times brighter than the clockwise sides. The clockwise edge of the cocoon has fainter [S II], however, with typical in the areas of largest [S II]/H () immediately outside the ionization cones.

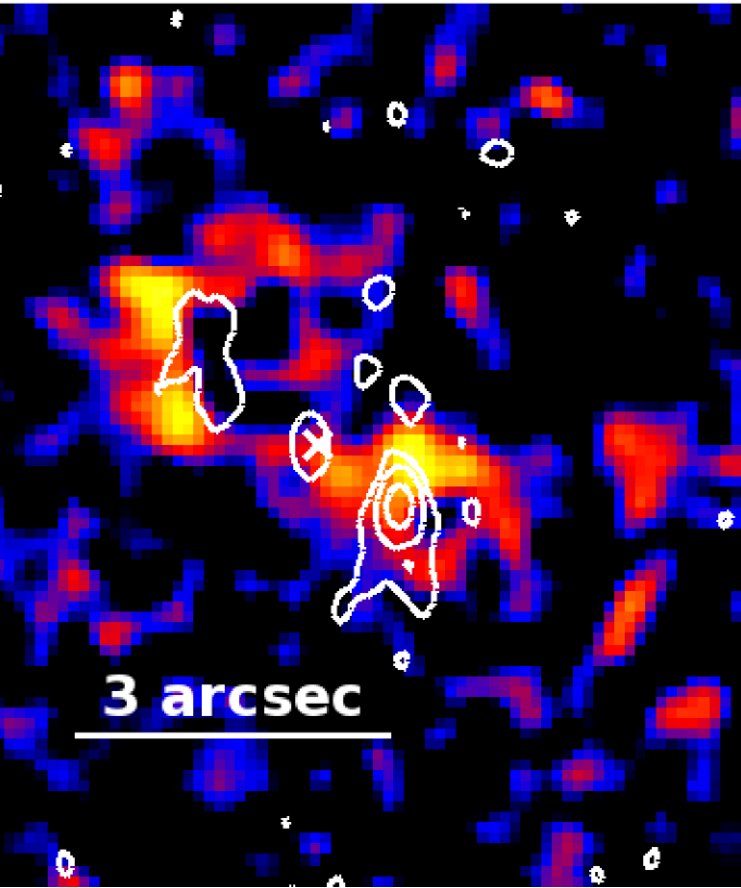
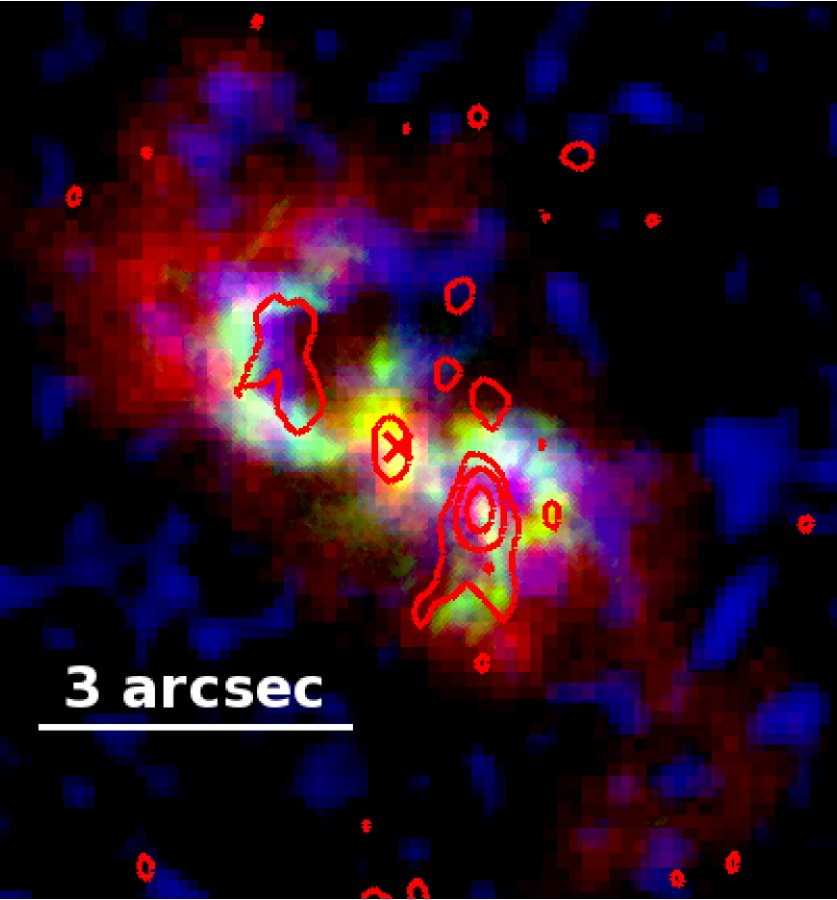
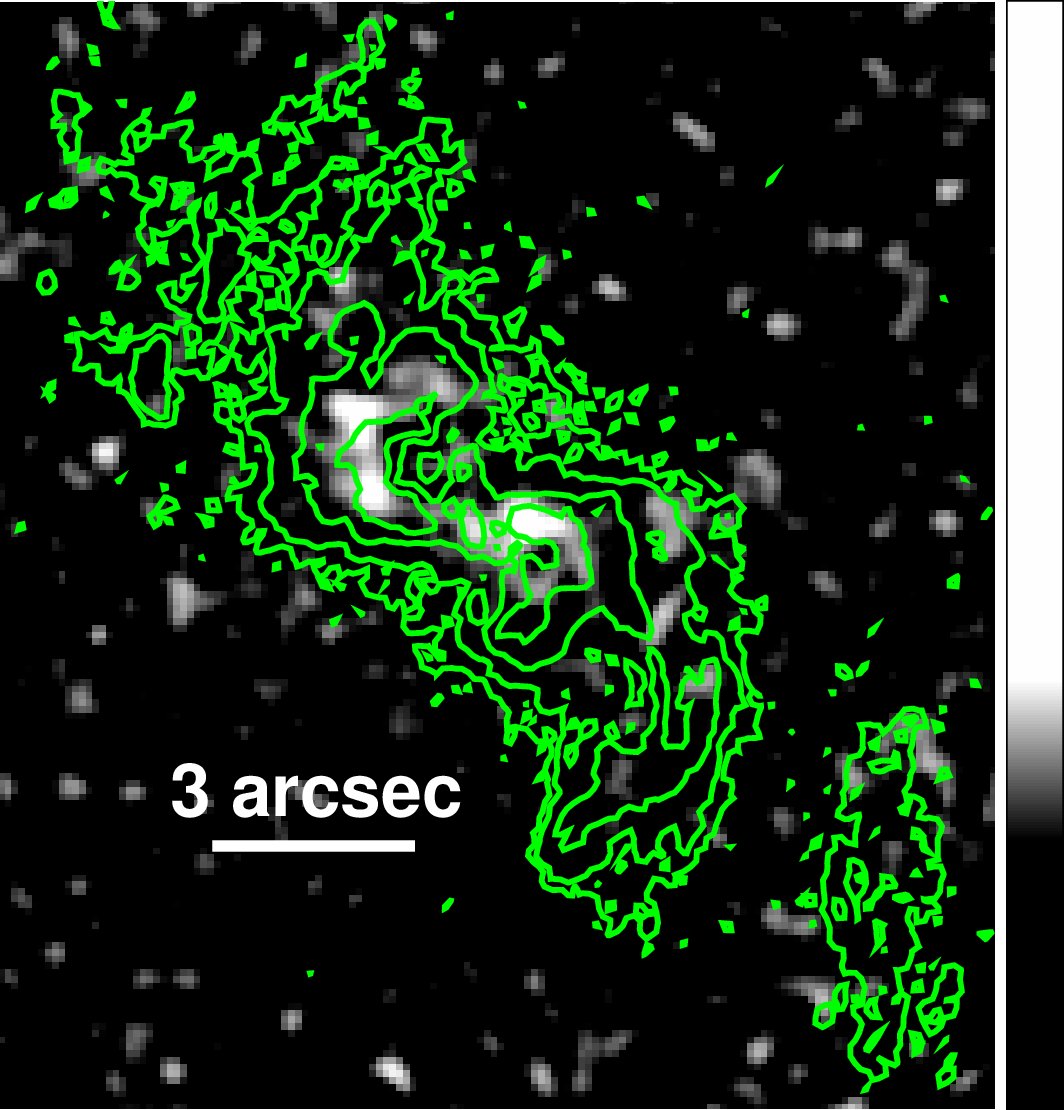
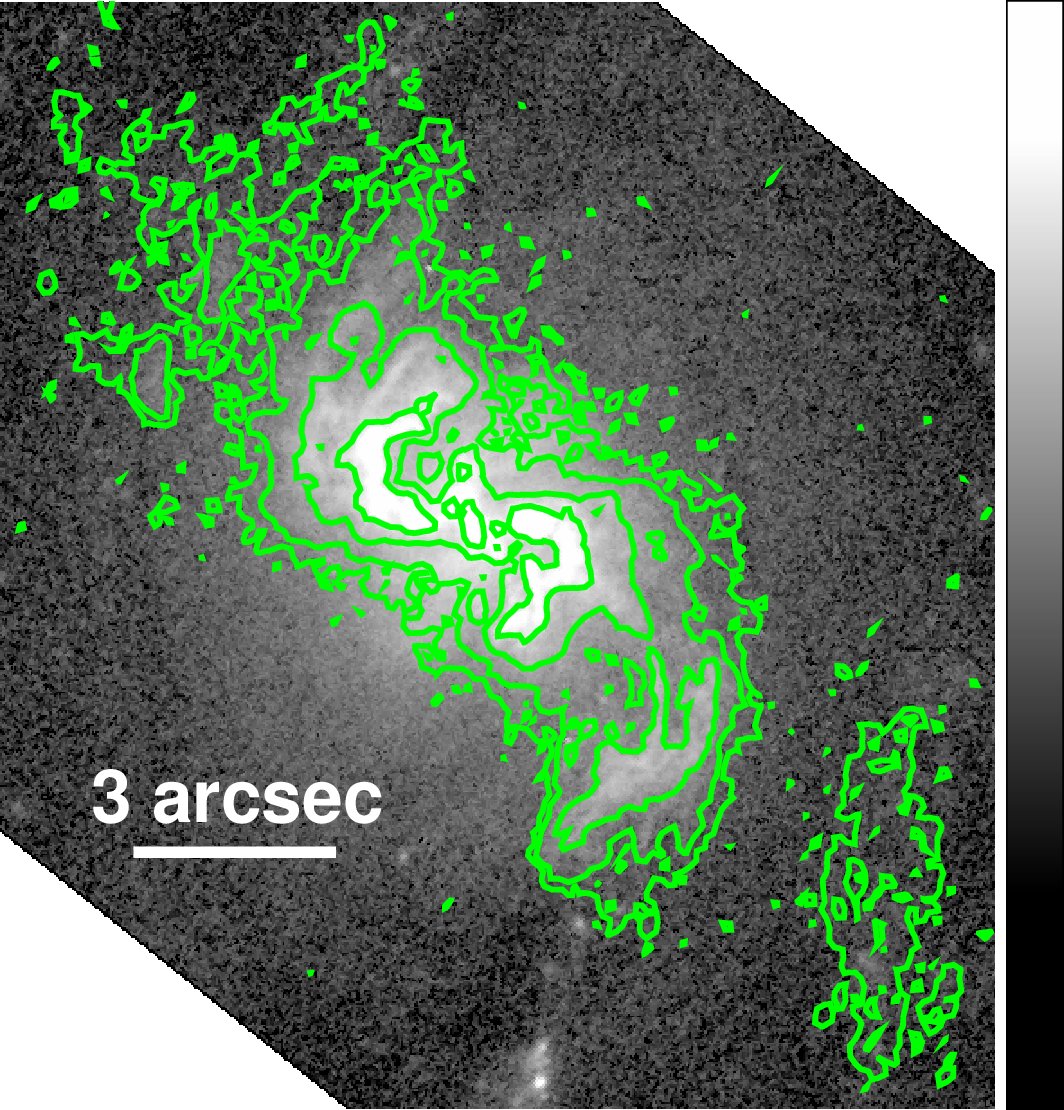
In Fig. 8, we show the F218W and F336W UV images. Extracting F218W flux from circles of , we identify mid-UV (MUV) emission from both the NE and SW arms. Each arm is detected as a structure with integrated flux at significance above the observed background, and roughly coincides with emission seen in NUV and H. This confirms the Koss et al. (2015) finding that F336W emission is correlated with narrow line emission, and we also observe that the extended F218W emission is similarly correlated with narrow line emission (see Fig. 9). Some of the MUV emission in both the NE and SW may be within the bubble rather than directly overlapping the optical arm emission. There is some evidence () of an extended UV filament parallel with the NE arm which continues clockwise beyond the edge of the ionization cones and falls within a relatively low-H region.
HST F218W images clearly show that (as inferred by Cooke et al. 2000 from a detection using the HST FOC) the MUV emission observed with IUE is entirely extended. From the F218W image we measure erg s-1 cm-2 Å-1 in the NE arm and erg s-1 cm-2 Å-1 in the SW arm, consistent with the upper limits set by Cooke et al. (2000). We do not detect a central point source.
4.2 X-ray Morphology
Taking regions of the EMC2-deconvoved image (Fig. 1) which encompass a circular region about the nuclear peak, and contours of and , we find that only of the photons come from the inner . By comparison, of the photons come from the next-brightest , and the remaining of this region come from an area spanning .
The X-ray emission is dominated by the S-shaped arms (Fig. 10), which extend to from the nucleus. These arms run approximately east-west at the nucleus, then curve through nearly and extend almost to the north-south axis. The brightest X-ray emission arises from a ridge thick at several points, and in length, measured along the ridge line. The SW arm encircles a bright knot of X-ray emission with diameter , containing of the deconvolved flux.
At , the NE cone shows multiple sub-arcsecond-scale blobs, and a linear structure which extends from the nucleus at east of north. The SW cone, also at , shows a structure running parallel to the S-shaped arm. At SW of the nucleus (in the outer clouds SW, not shown in Fig. 10; see Fig.3), we see a faint, elongated structure that runs approximately north-south and is apparently separate from the main structure of the SW cone.
At , the northwestern cross-cone shows an arc roughly concentric with the nucleus (NW arc; Fig.10). In the southeastern cross-cone, we see tenuous evidence of a linear feature (spur; Fig. 10) extending approximately southwest and south from the nuclear region.
The inner of the nucleus is dominated by an elongated north-south feature in length which contains the nuclear peak itself.

4.3 Comparison of Optical and X-ray Emission
As is shown in Figs. 1, 2, and 3, there is good correlation on sub-arcsecond scales between X-rays, H and [O III], as has previously been established by Cooke et al. (2000), Bianchi et al. (2006), and Koss et al. (2015). We see the same correlation in [S II] as well, dominated by the flux in the S-shaped arms as in other bands.
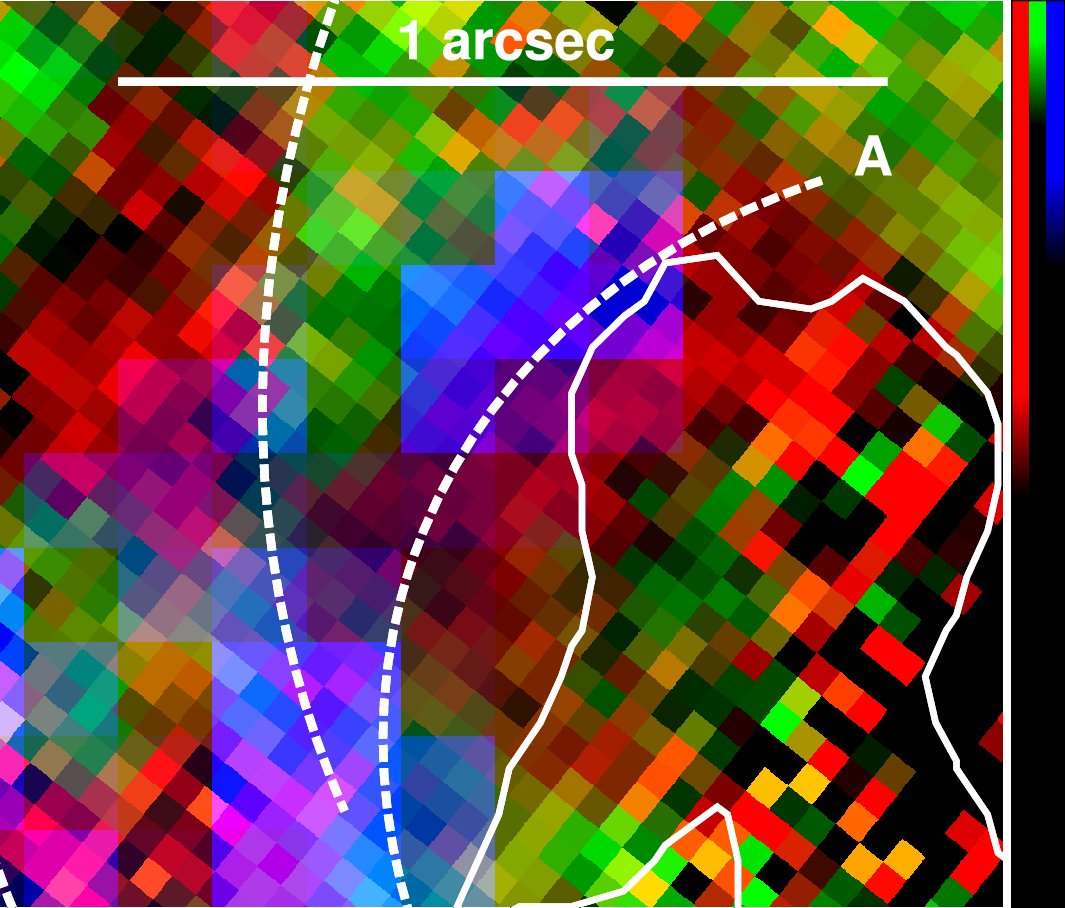
Using the PSF-deconvolved images, we examine the morphology and optical feature correspondence on the smallest scales in the Chandra images, . In order to compare and contrast the morphology of regions with the strongest X-rays, [O III]/H and [S II]/H, we show three-color images in Figs. 11 and 12. Different features become clearer in less complicated figures, or more visible with different color stretches, so we also present two-color images comparing X-rays to [O III]/H and to [S II]/H in Fig. 13.

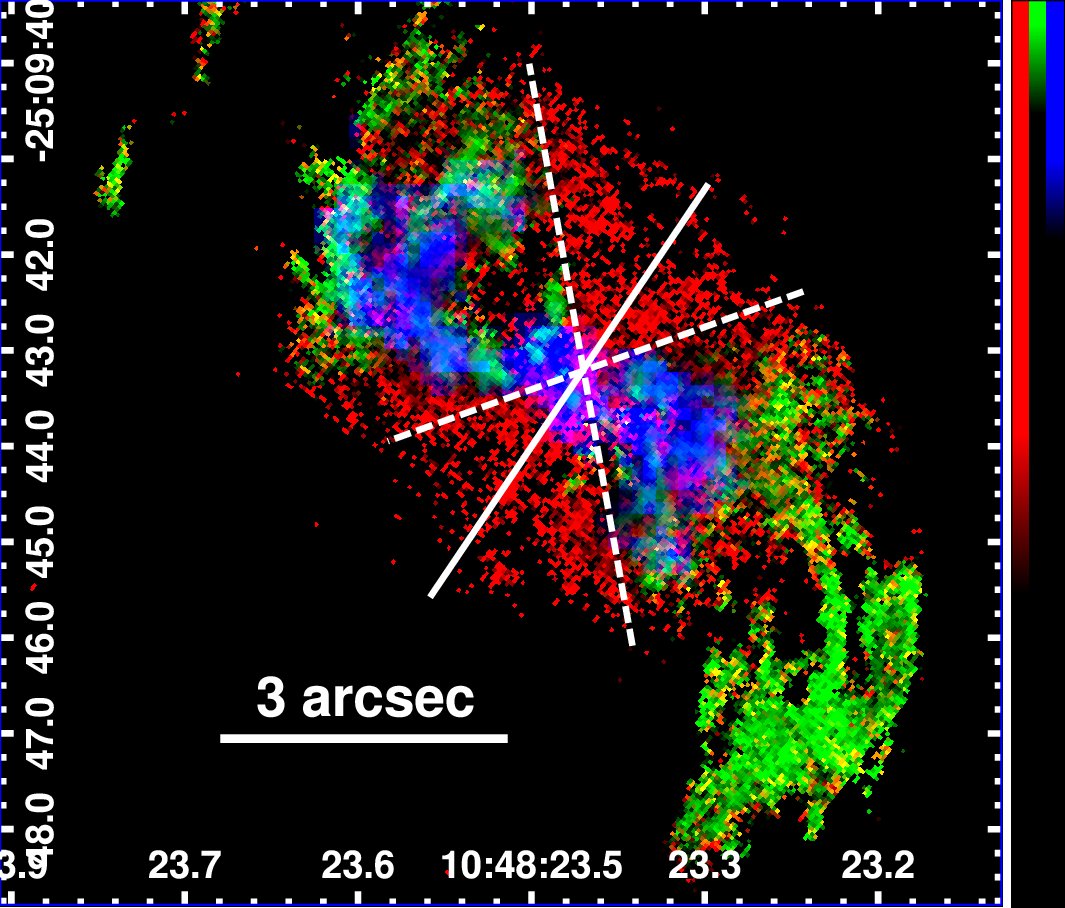
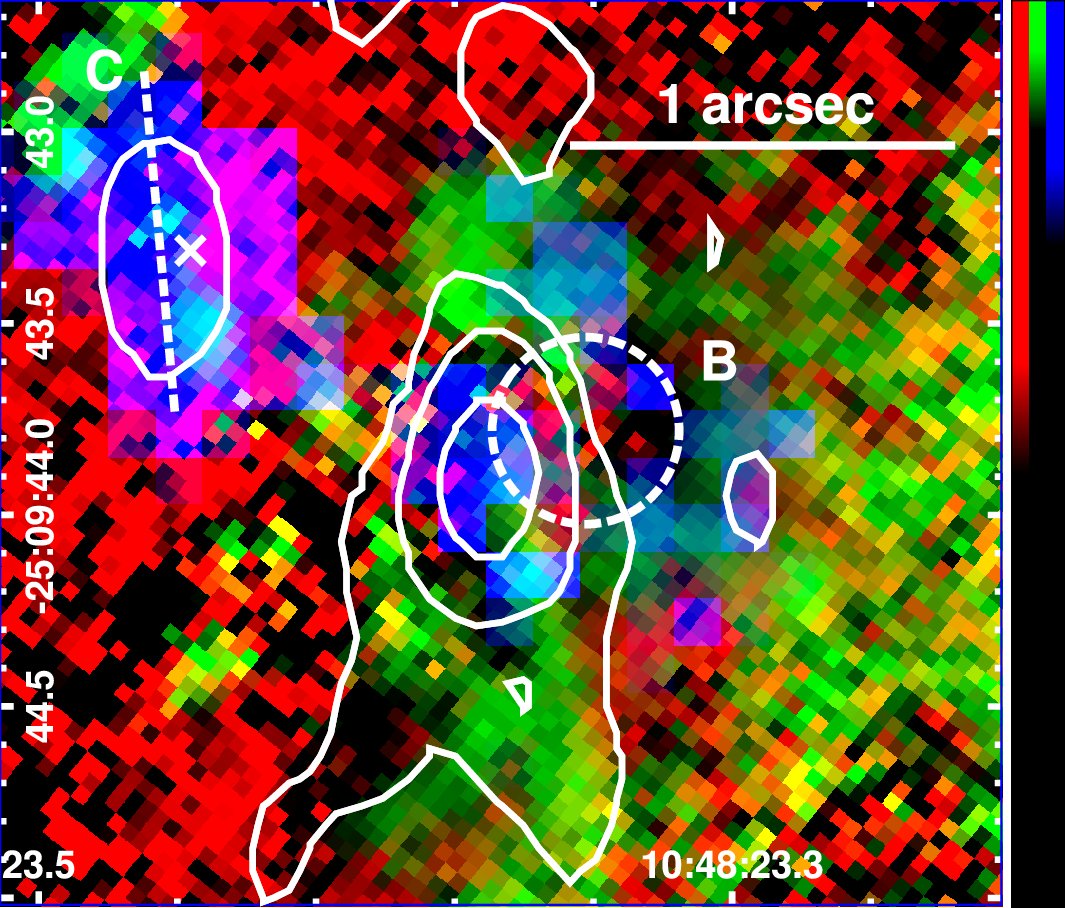
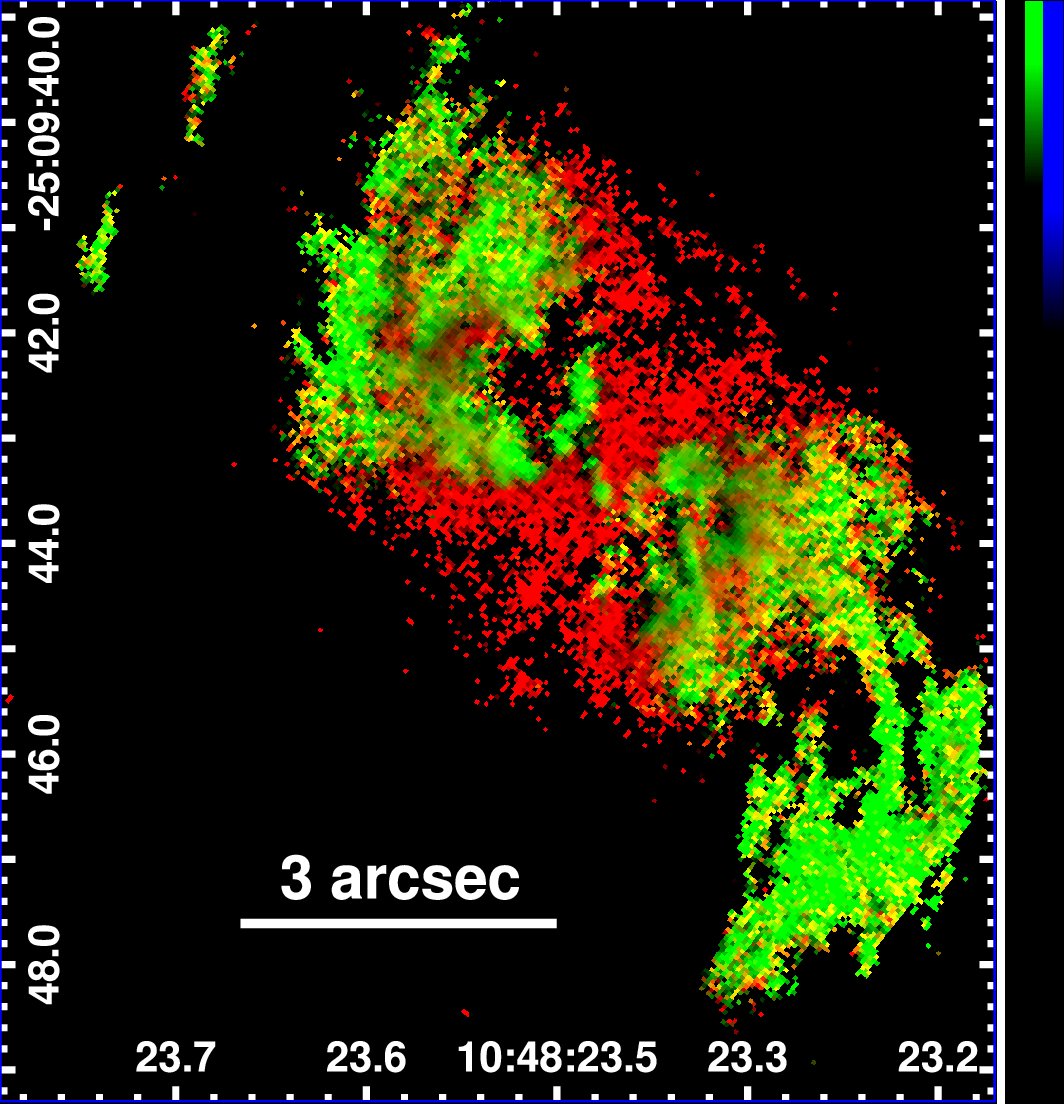
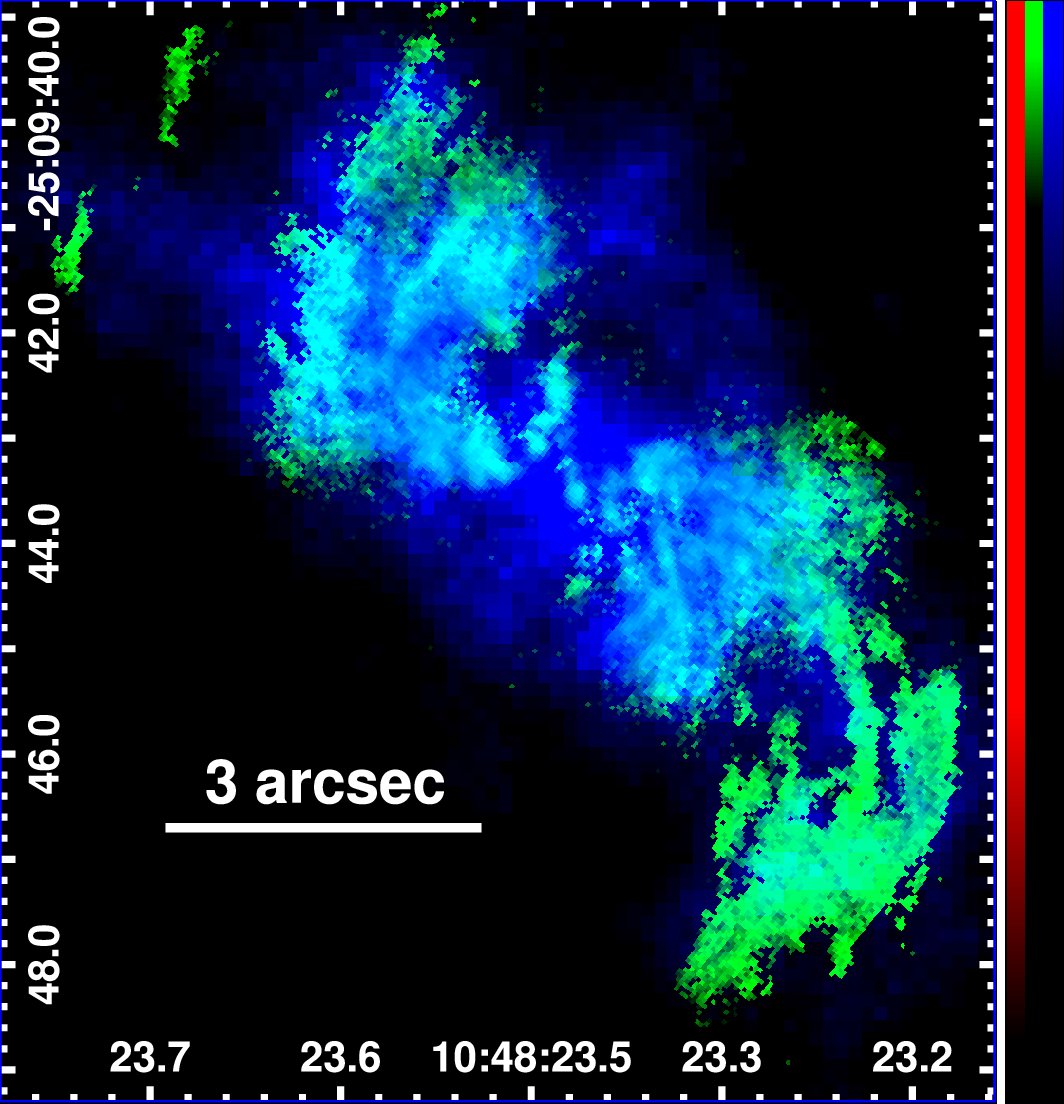
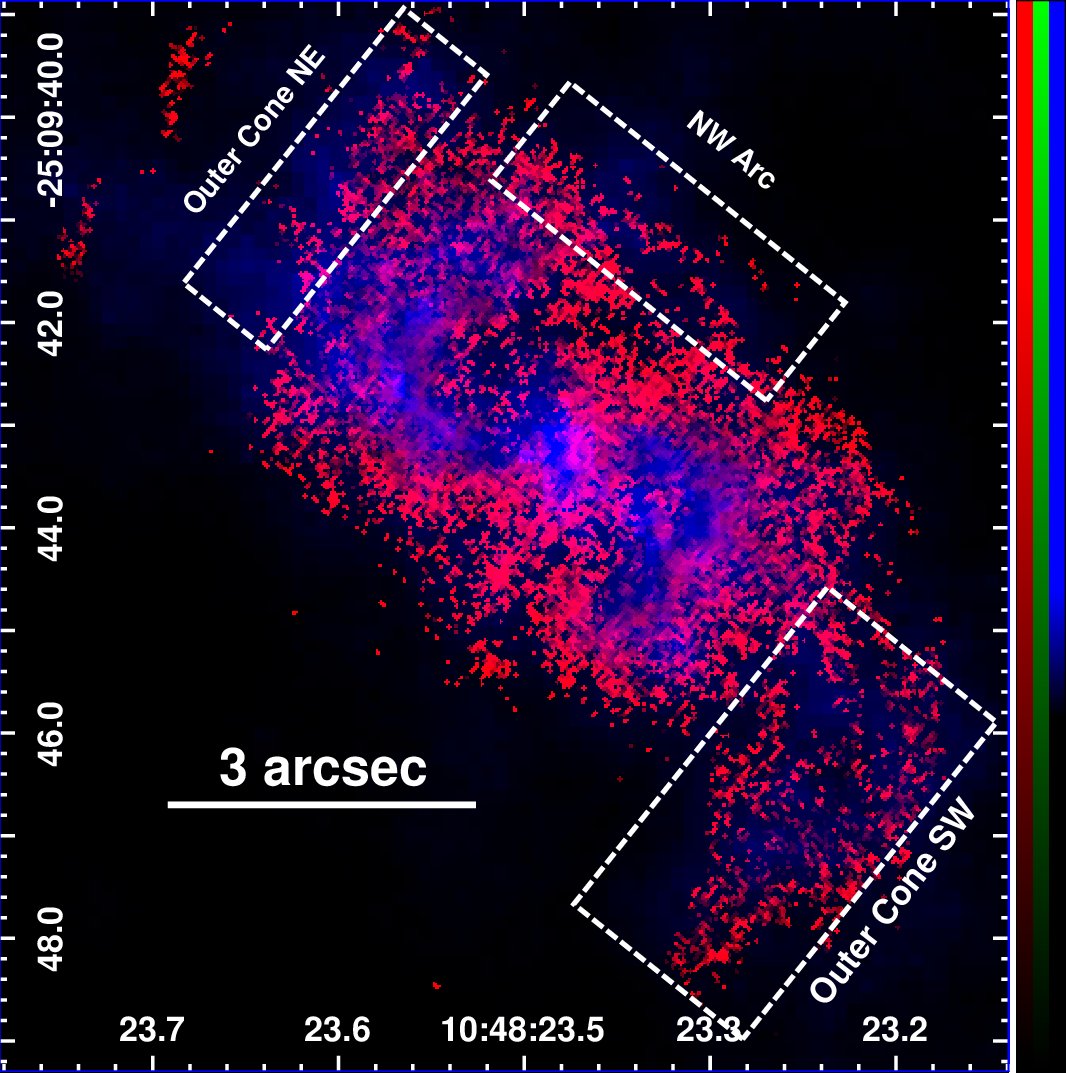
In general, the fainter extended X-ray regions correspond to the entire H-bright region in our optical line ratio maps (see especially Fig. 13 center and right). This larger-scale emission extending to is notably strong in the outer cone SW, where [O III]/H is relatively high, and in the outer cone NE where [O III]/H is strong and H falls under our threshold (). We also observe that the NW arc described in §4.2 at NW of the nuclear ridge C corresponds to a [S II]/H feature which is partially defined by surrounding regions of weak H.
We see that the X-ray spur in the SE cross-cone noted in §4.2 is associated with a [S II]/H spur. The base of this feature (Fig. 12) falls approximately at the position angle of the pc-scale maser disk (; Fig. 12, left) studied by Kondratko et al. (2008).
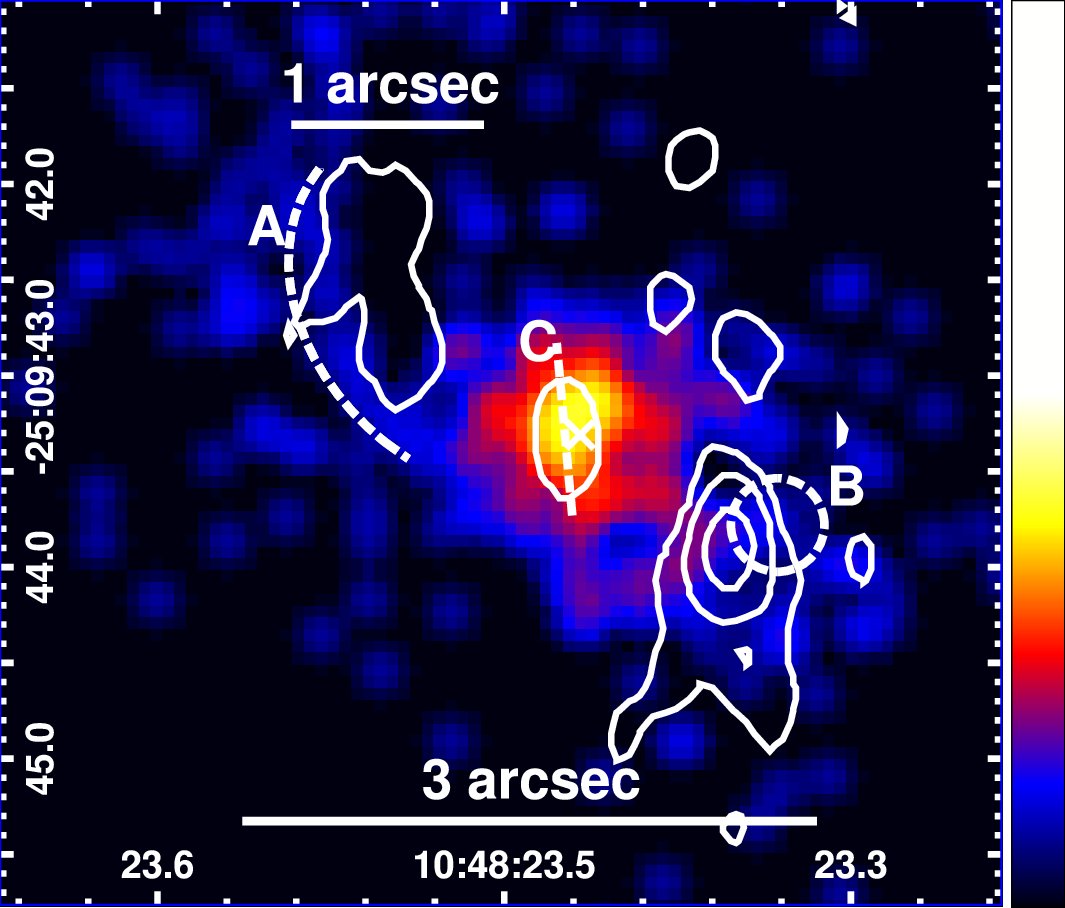
On smaller scales, we examine the correlation between X-rays and the line-emitting S-shaped arms in finer detail. Although these X-ray arms are confined to the ionization cones like [O III]/H, in some cases they trace complementary regions. For example, in Fig. 12, the brightest X-ray emission coincides (like [O III]/H) with the N-S nuclear ridge ‘C’ (Fig. 12, right).
In the ionization cones the X-rays are strongest within , and are strongest in regions of relatively low [O III]/H, whereas [O III]/H dominates the cones at larger radii. Like [S II]/H and [O III]/H, an X-ray curve follows curve A in the NE inner cone (Figs. 12 center, 14, 15), but at a different radius from the NE radio lobe, lying between the [S II]/H and [O III]/H features. At larger radii ( NE of the nucleus), X-rays may also trace the interface between [S II]/H and [O III]/H features along the previously-mentioned [O III]/H gap.


In the SW cone, the brightest X-rays describe a structure that is less well-described as ‘S-shaped’. But the SW cone does contain a clumpy semi-circular structure which surrounds [S II]/H knot B and is present within a cavity of relatively weak [O III]/H (Figs. 12 right, 14, 15). One of these X-ray knots is spatially consistent with the peak of radio emission from the SW radio lobe, and may continue south along a north-south [O III]/H structure associated with a radio filament. The remaining knots occupy a space in the western side of the cavity, between [S II]/H knot B and surrounding [O III]/H structures.
In the outer clouds SW, the [O III] and X-ray emission are aligned but not co-spatial. Rather, the X-ray emission is found NW of the [O III] region (i.e. interior to it). The nearly-cospatial X-ray structure appears to be counter-clockwise along the outer edge of the central F438W stellar structure, described in §4.1.
4.4 Radio Morphology and Comparison to Other Wavelengths
The morphology of the X-ray emission and optical emission are strongly defined in relation to the radio emission. The main radio features consist of the nuclear emission, a NE radio lobe ( from the nucleus), and a brighter SW radio lobe () with two filaments extending south of the SW lobe hotspot. In continuum-subtracted narrow line emission, the S-shaped arms curve around these two radio lobes.
A ridge of enhanced [S II]/H that traces the edge of the NE radio lobe (marked A in Fig. 4), and a knot immediately east of the SW radio lobe (marked B in Fig. 4). In the SW cone, the cavity west of knot B is dominated by extended filaments of radio emission connected to the SW jet lobe. The nuclear radio emission is consistent with the peak of nuclear X-ray emission, and occupies a region of weak [S II]/H corresponding with the nucleus. The nuclear radio emission is cospatial with the only strong [O III]/H region in the inner .
The positions of these radio structures are marked using contours in the three-color X-ray and line ratio images (Figs. 4 and 12), as well as in two-color images which compare [O III]/H vs. [S II]/H (Fig. 6), [O III]/H vs. X-rays (Fig. 14), and [S II]/H vs. X-rays (Fig. 15).
We take a first approach at energy-resolved X-ray morphology by examining smoothed images. We will pursue more detailed energy-resolved X-ray analysis in a subsequent paper. We compare X-ray emission at keV (soft) and keV (hard) using images binned at 1/8 ACIS native pixel resolution and smoothed with a Gaussian kernel with a radius of 3 image pixels, as shown in Fig. 16. X-ray emission is extended in the soft band, but we also see extended emission in the hard band in addition to the hard point source previously studied by Fabbiano et al. (2011) and Koss et al. (2015). Accounting for contamination from the PSF of the central source, we detect hard emission at in each of the ionization cones, assuming two annular wedges covering . In the NE inner cone, we also observe a tenuous hard X-ray ridge associated with ridge A, along with a conspicuous absence of X-ray emission from within the NE radio lobe. Measured at keV to reduce contamination from the AGN PSF, we detect ridge A in a box at above background and find that keV X-ray emission from ridge A must be a factor of brighter than the undetected radio-emitting region at . In the SW inner cone, the extended hard emission appears associated with the SW radio lobe, or between the lobe and the nucleus.
4.5 Regional Diagnostics
4.5.1 BPT Diagrams
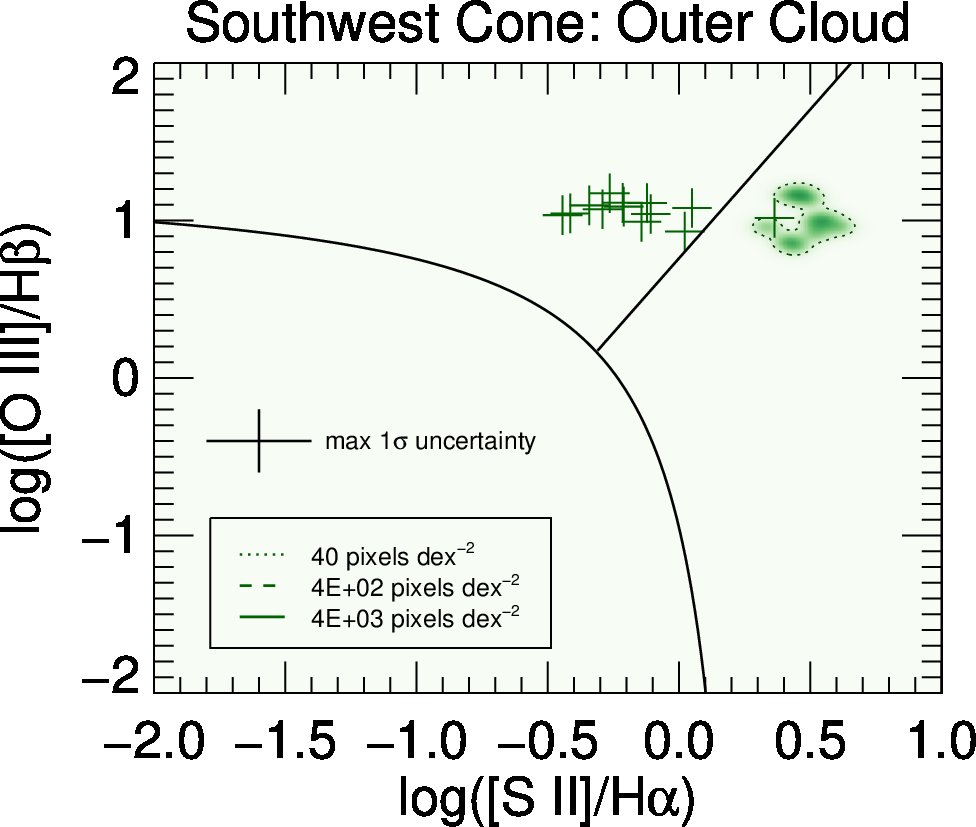
Direct comparison of the relative strengths of multiple narrow emission lines is a well-established method of distinguishing between star formation and different forms of nuclear black hole activity as competing processes for the origin of those emission lines. Such diagnostics have an empirical basis (Baldwin et al. 1981) and have been supported by various subsequent theoretical models (e.g. Evans & Dopita 1985; Kewley et al. 2001). Although this is typically used to distinguish the dominant forms of emission in different galaxies, it can also be used (as in Cooke et al. 2000, for NGC 3393 with ground-based spectra) to examine the role of AGN photoionization in different portions of a single galaxy. In Fig. 17, we plot a BPT (Baldwin et al. 1981) diagram, using [O III]/H on the vertical axis vs. [S II]/H for each WFC3 pixel in the central . Since we do not have direct measurements of H in our line emission maps, we assume H/H, as is typical in AGN. In order to distinguish between emission characteristic of star formation, Seyfert galaxies, and Low Ionization Nuclear Emission Regions (LINERs), we use the Kewley et al. (2006) formalism for BPT diagrams based on [O III] and [S II], using the ratio map images we created from the WFC3 data.
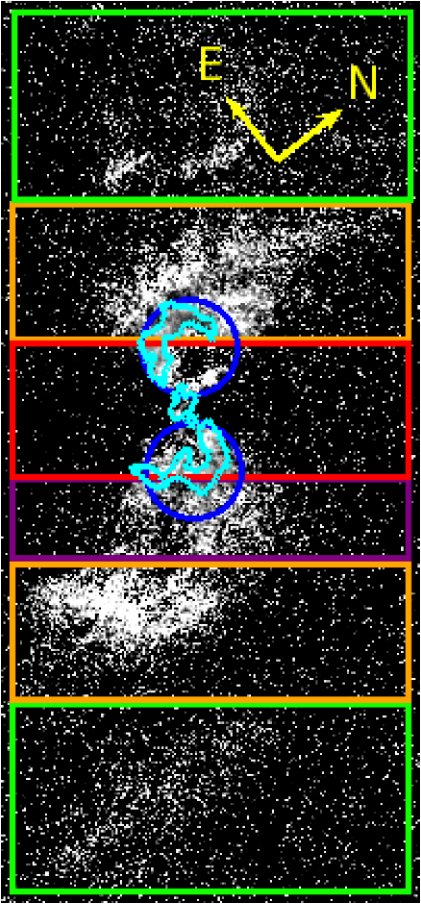
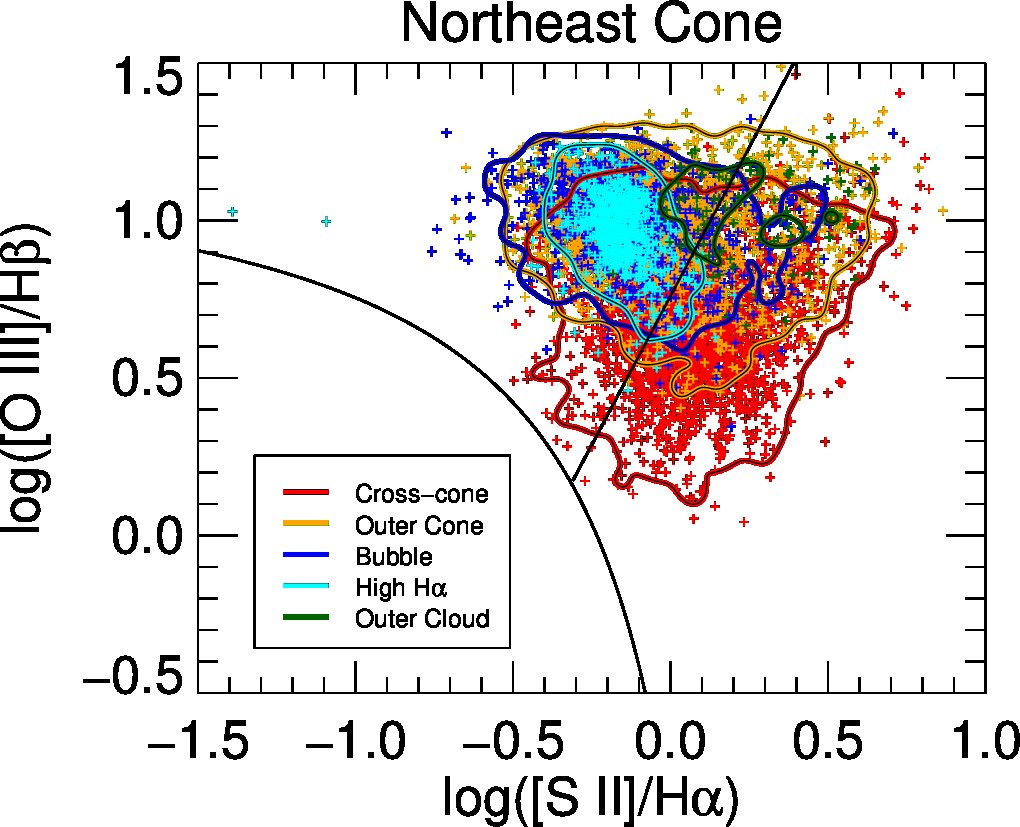
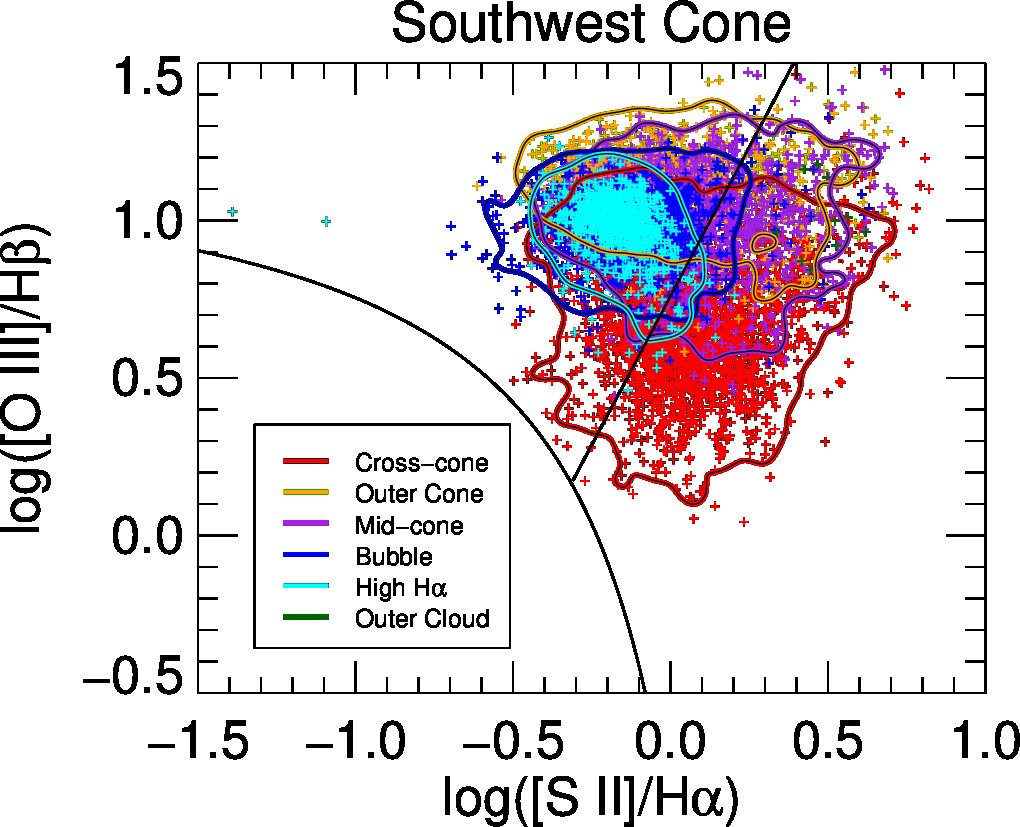
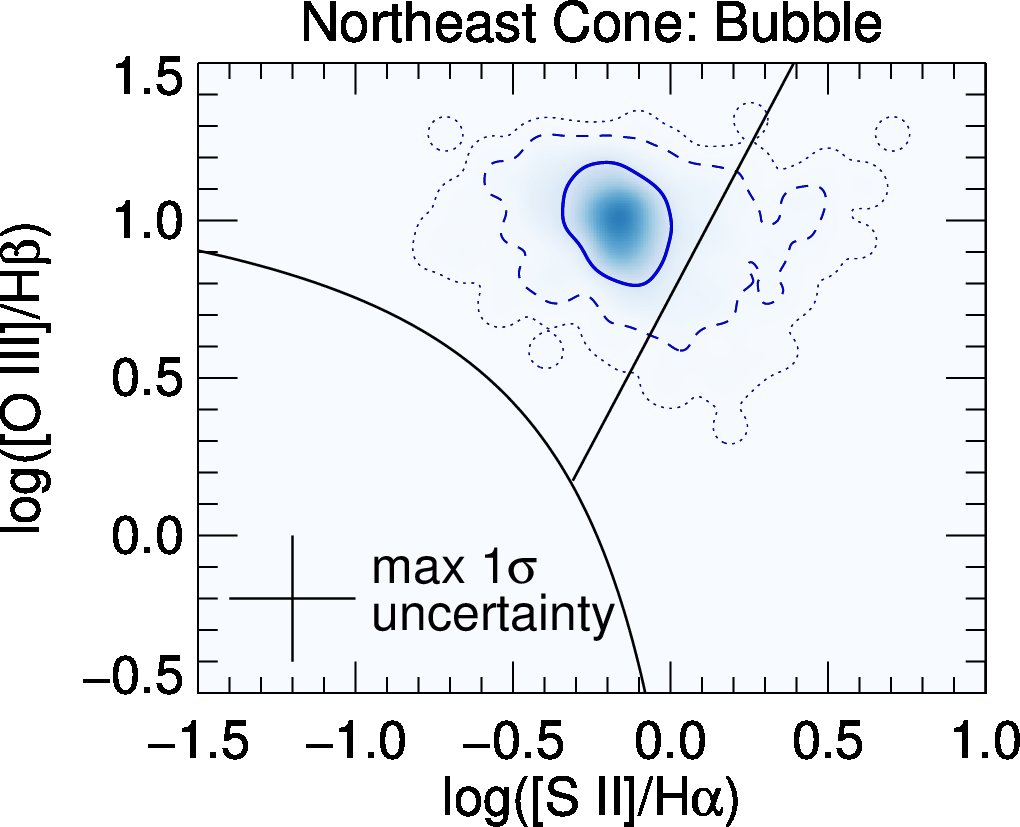
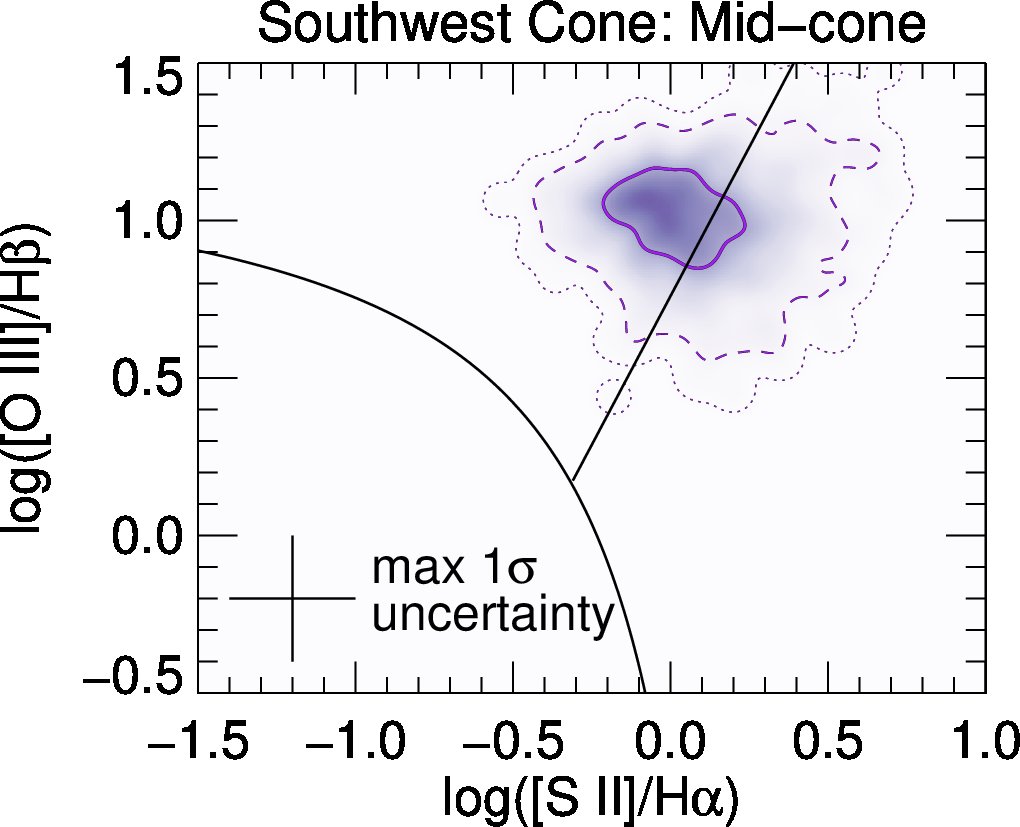
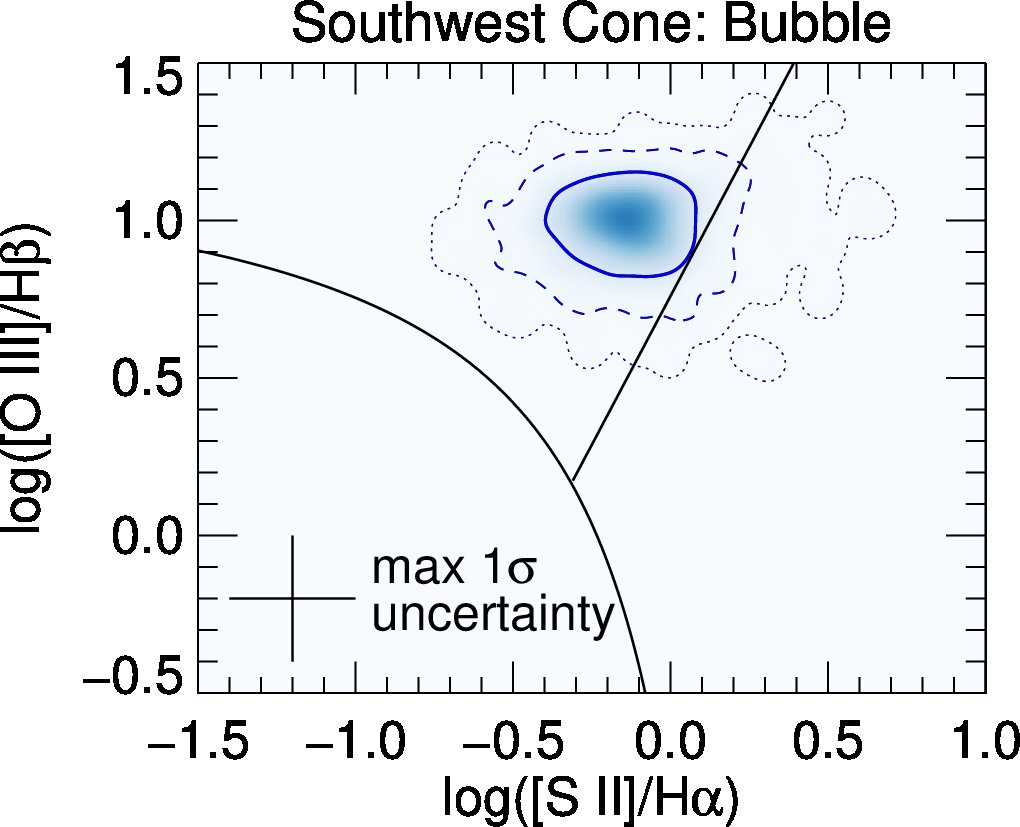
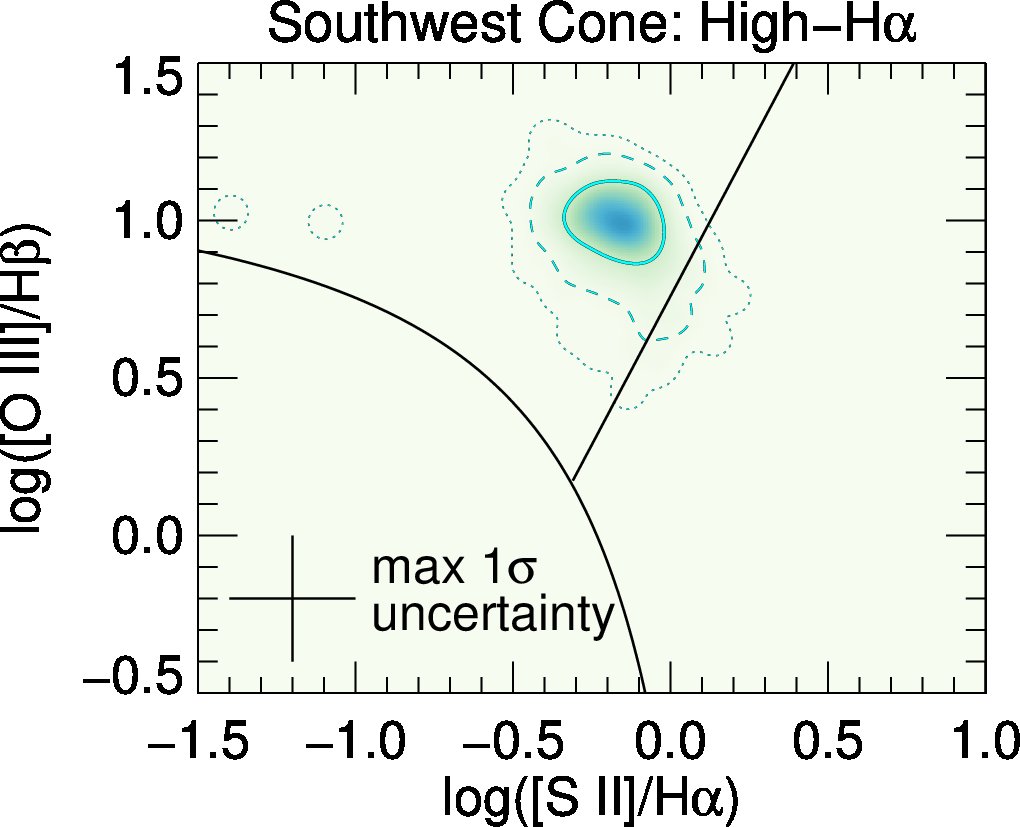
Top-right: BPT diagram of individual pixels along the NE cone. Black lines mark different BPT regions, with star formation at the lower left of each plot, Seyfert-like activity at the upper-left, and LINER-like activity on the right. Colors indicate sub-regions from the [O III]/[S II] in this figure (left). Contours emphasize parameter space with a large concentration of pixels, to clarify areas with significant overlap between multiple extraction regions. Bottom-right: BPT diagram, as before, but for the SW cone. The cross-cone region is common to both diagrams.
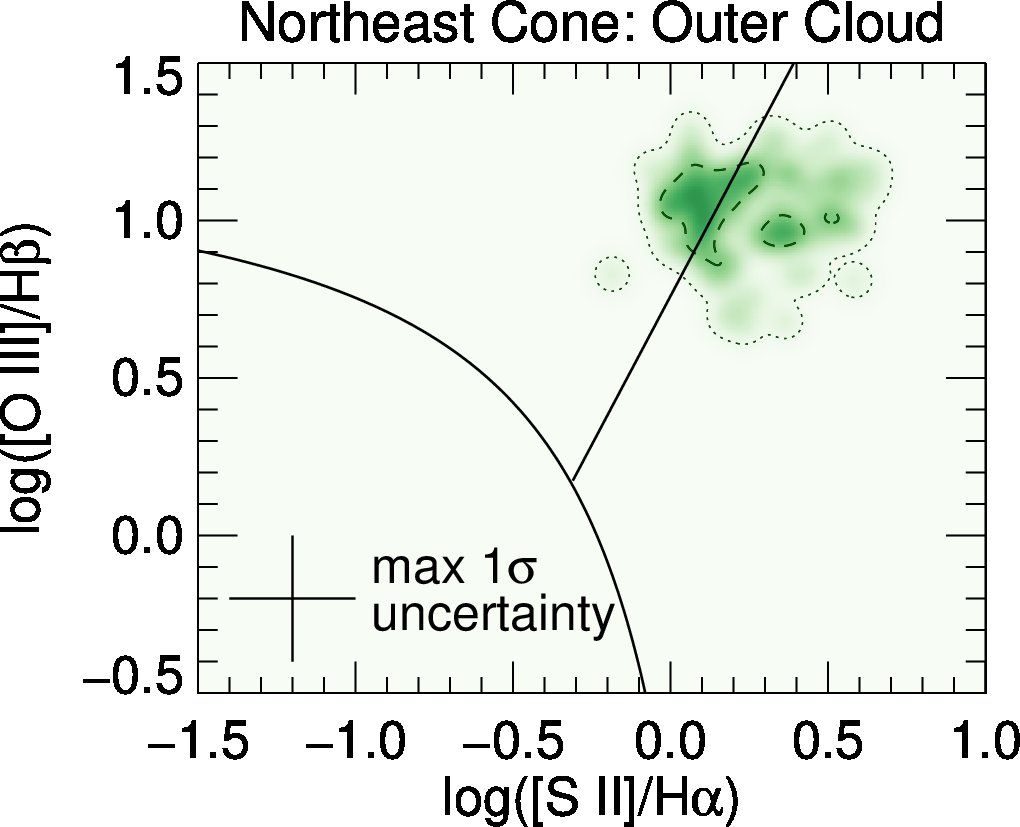
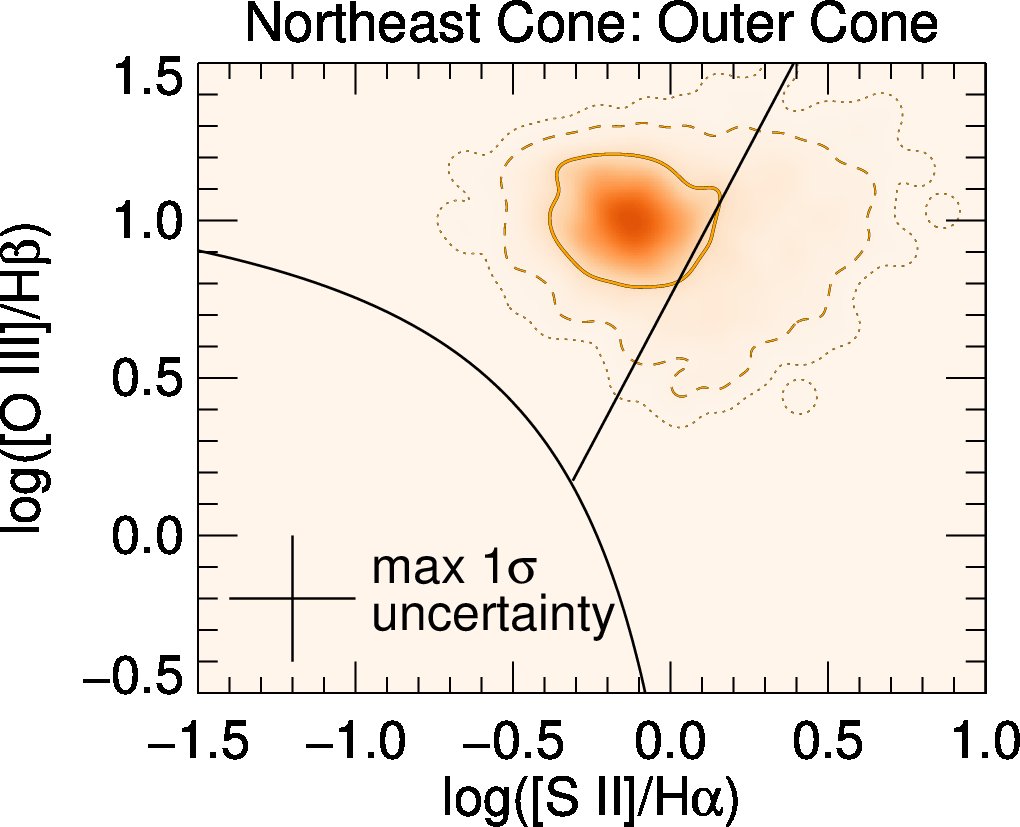
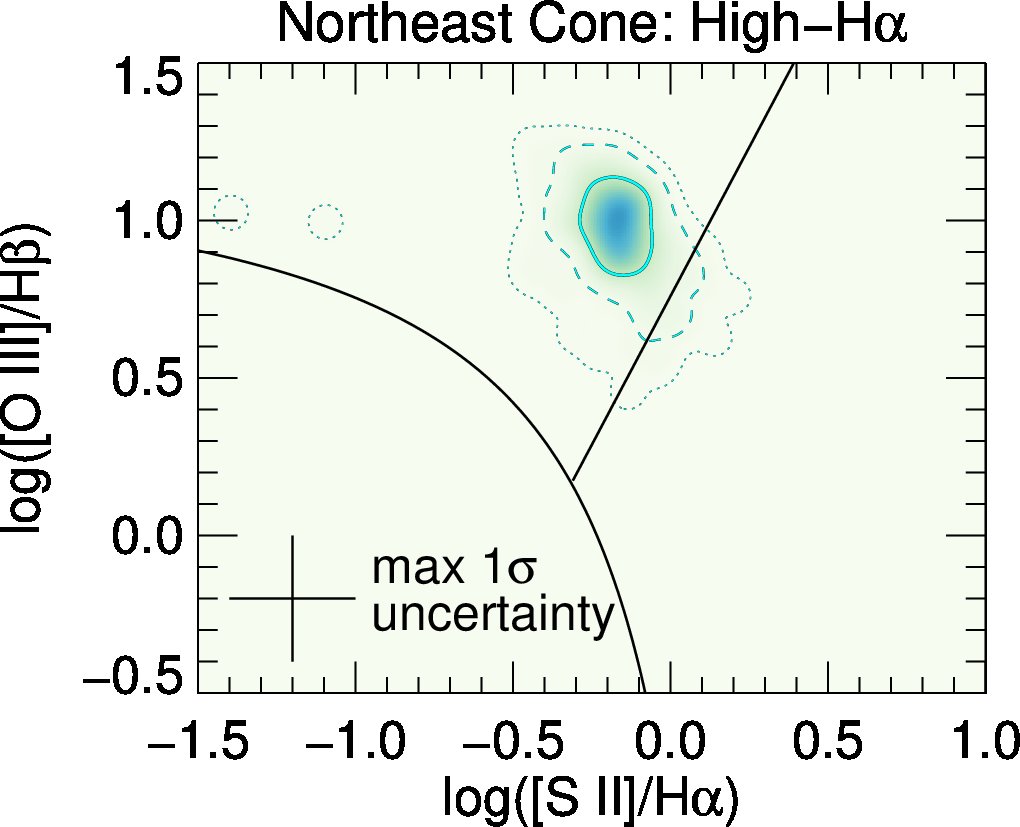
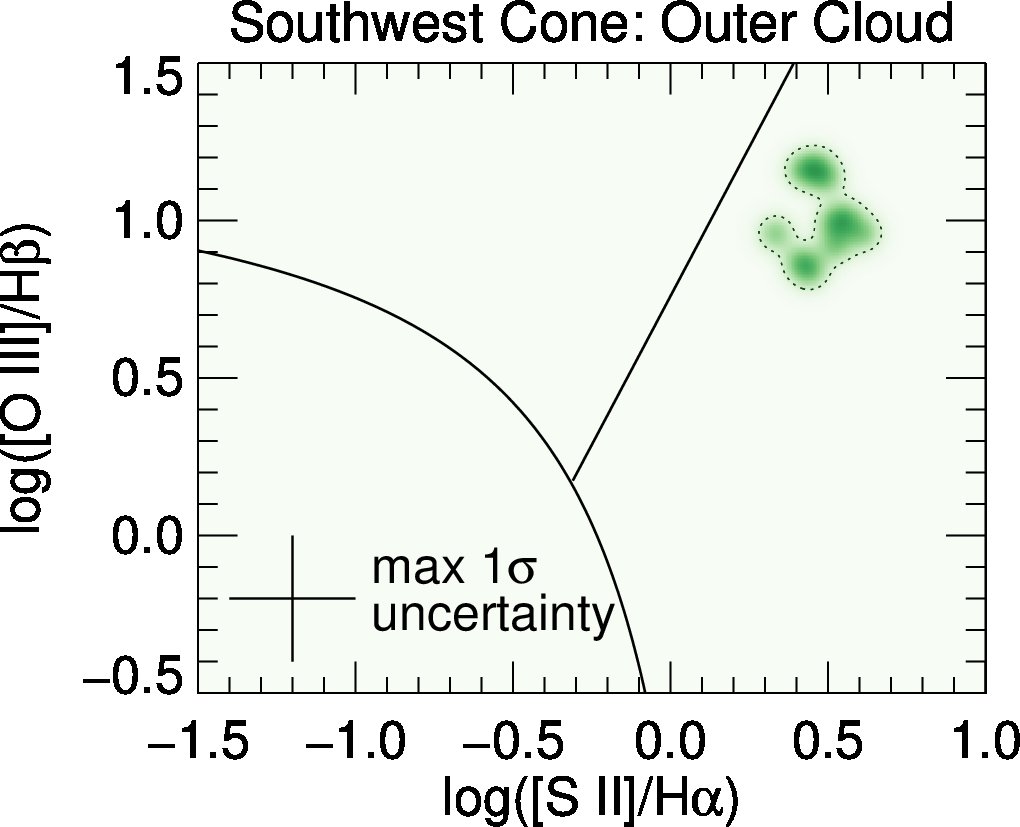
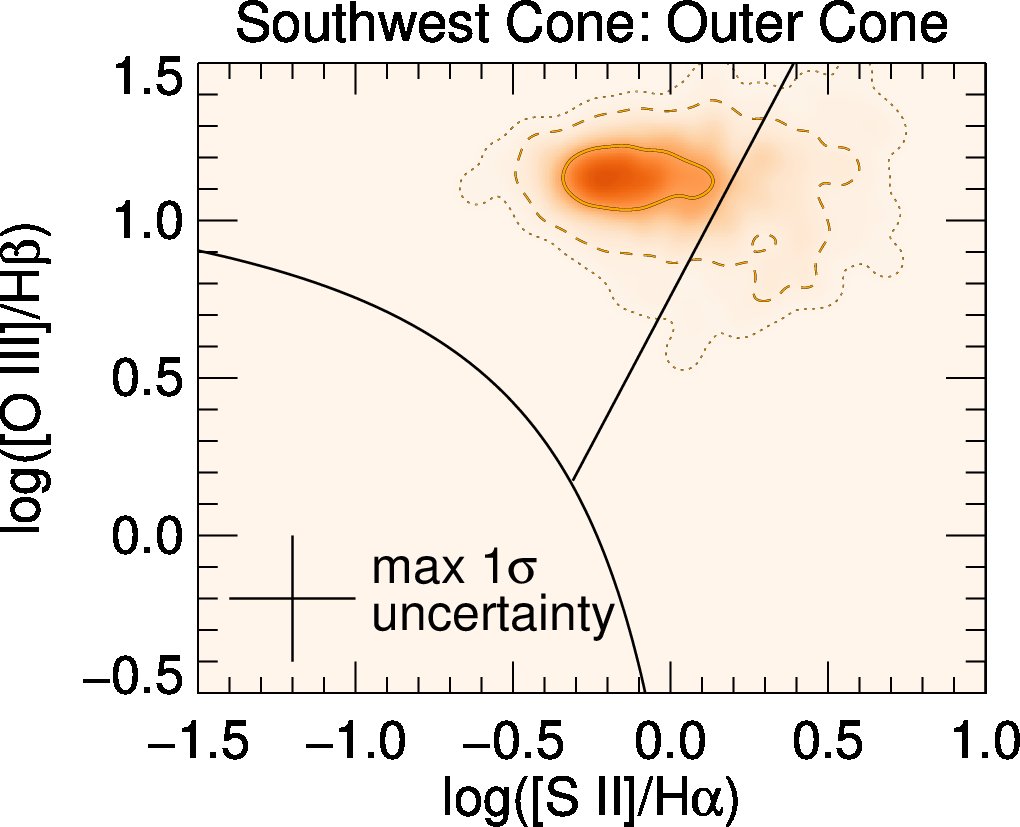
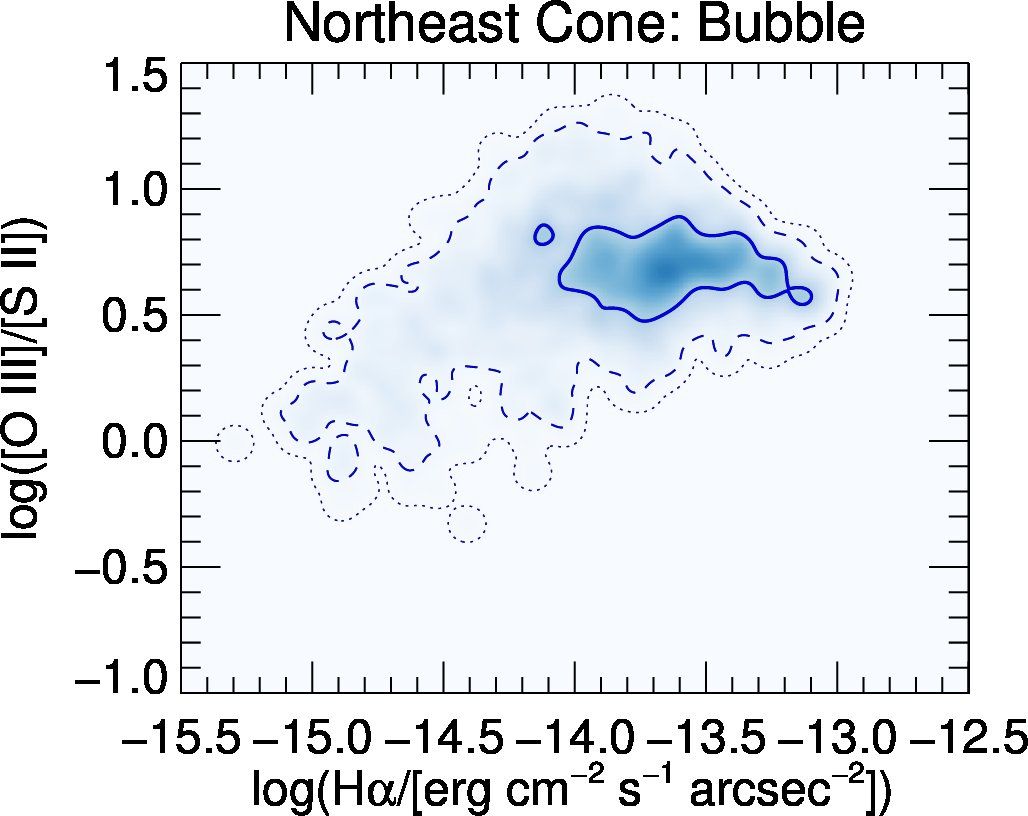
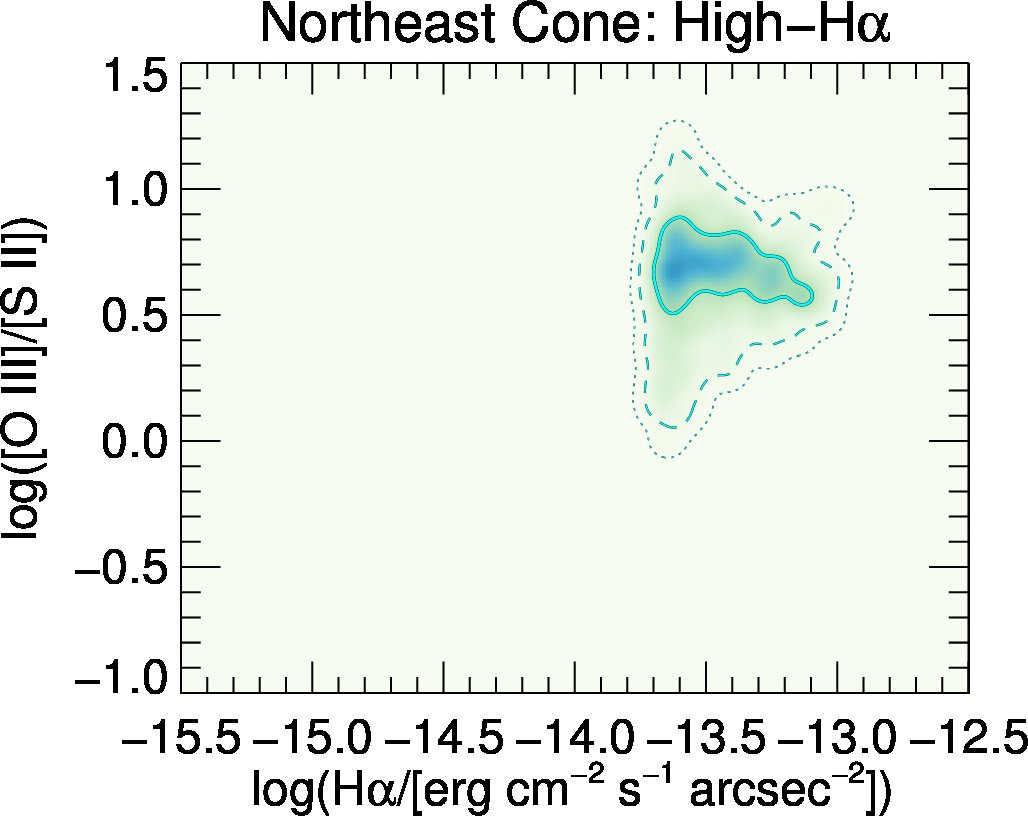
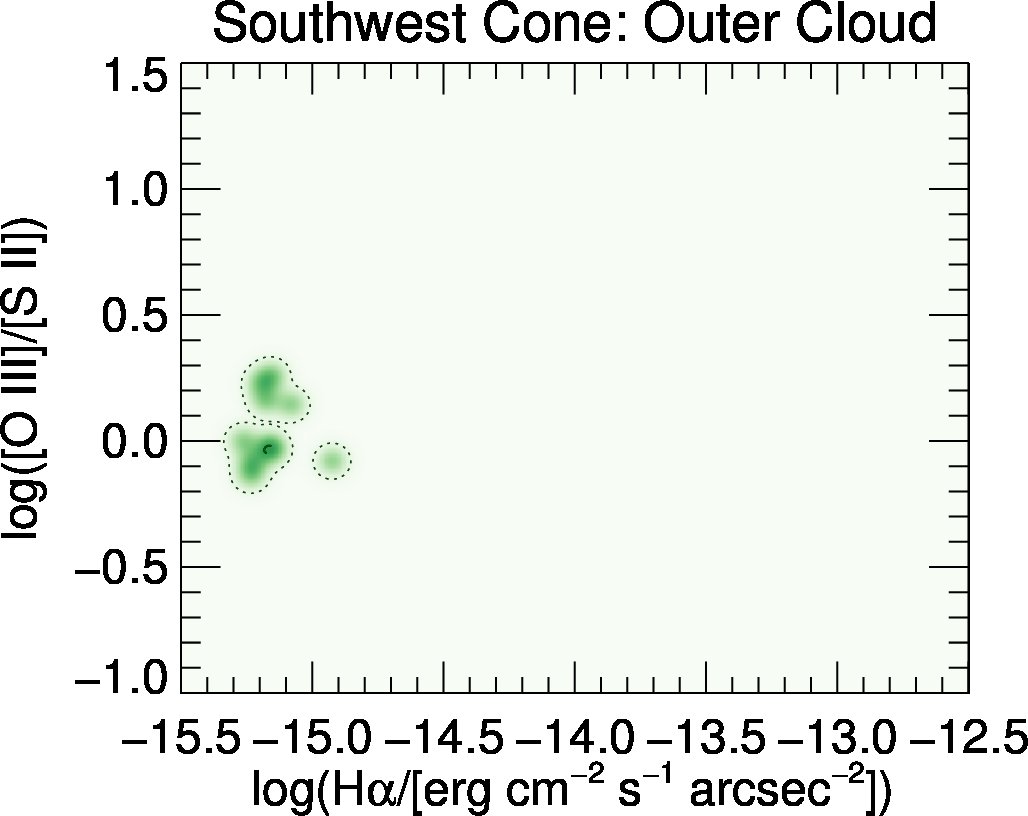
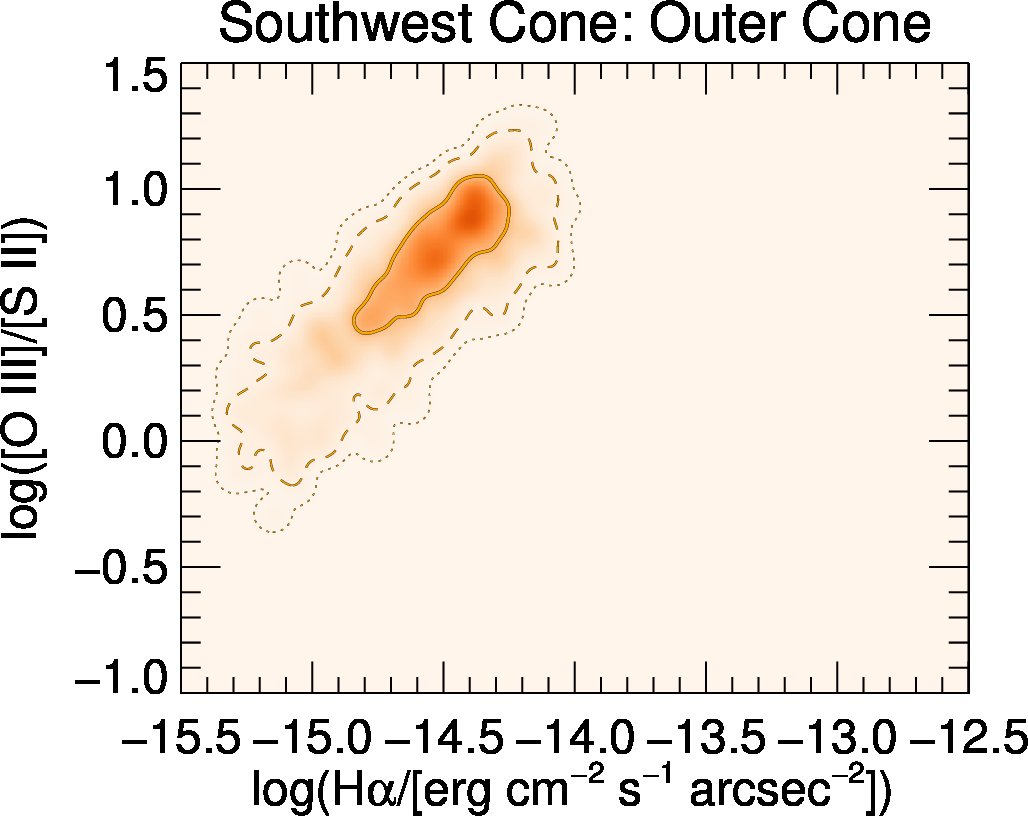
We use colors to differentiate the sub-region of origin for each ratio map pixel. The locations of these sub-regions are also marked by lines of the same color on the [O III]/[S II] ratio map of the ionization cones in Figure 17, and are described in the captions as the cross-cone, mid-cone, outer cones, outer clouds, high-H regions, and high-ionization bubbles. Contours indicate surfaces of constant pixels dex-2, to distinguish the most densely occupied portions of parameter space where there may be significant overlap between regions.
For clarity, we plot each of these sub-regions separately for the NE and SW cones (Figure 18). In each plot, the color corresponds to the same color used to designate regions in Figure 17.
 |
 |
 |
 |
 |
|
 |
 |
 |
 |
 |
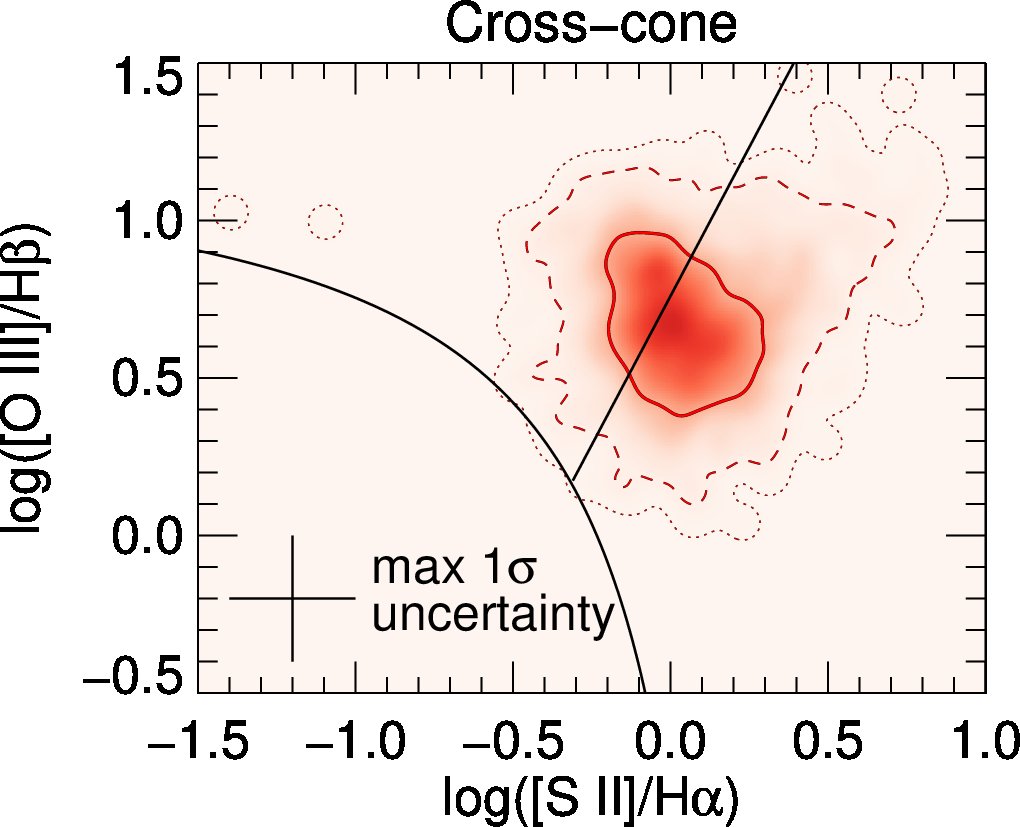 |
Examining Figure 17, we notice several noteworthy trends. First, the high-H and bubble regions are almost entirely within the Seyfert region of the BPT diagram. Other regions have significant Seyfert components, but straddle the Seyfert/LINER dividing line. The cross-cone region in particular is systematically more concentrated in the LINER region, with lower values of [O III]/H for its major parameter space locus, and higher values of [S II]/H. Very few pixels from any of these sub-regions can be attributed to star formation. The outer clouds have a large fraction of their points in the LINER region, but also produce many of the highest-excitation ([O III]/H) points. In the SW cone, we see a systematic trend in excitation moving between regions and away from the nucleus, such that the SW bubble has lower excitation than the SW mid-cone, which is lower-excitation than the outer cone. Likewise, each region’s locus extends more significantly towards low [S II]/H as the regions move away from the nucleus within the SW cone.
The ability of this diagram to probe regions which are both outside the ionization cone and at large radii is limited by the fact that such regions are commonly deficient in at least one emission line, introducing uncertainty.
4.5.2 Ionization vs. H
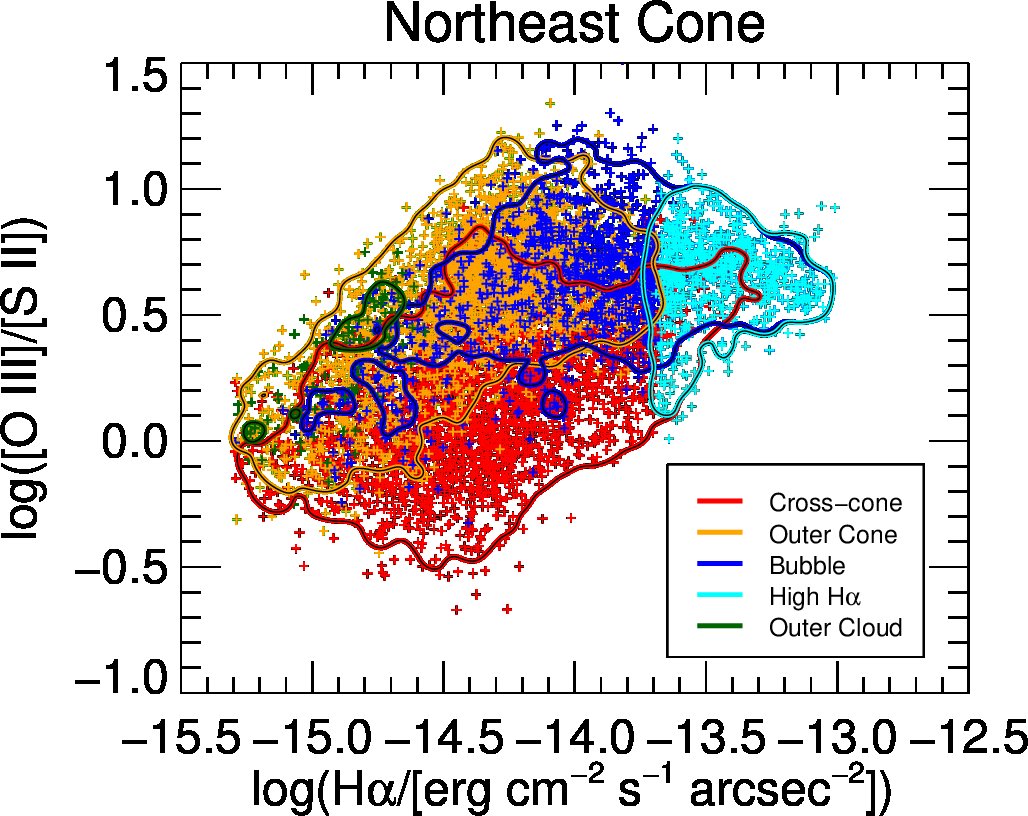
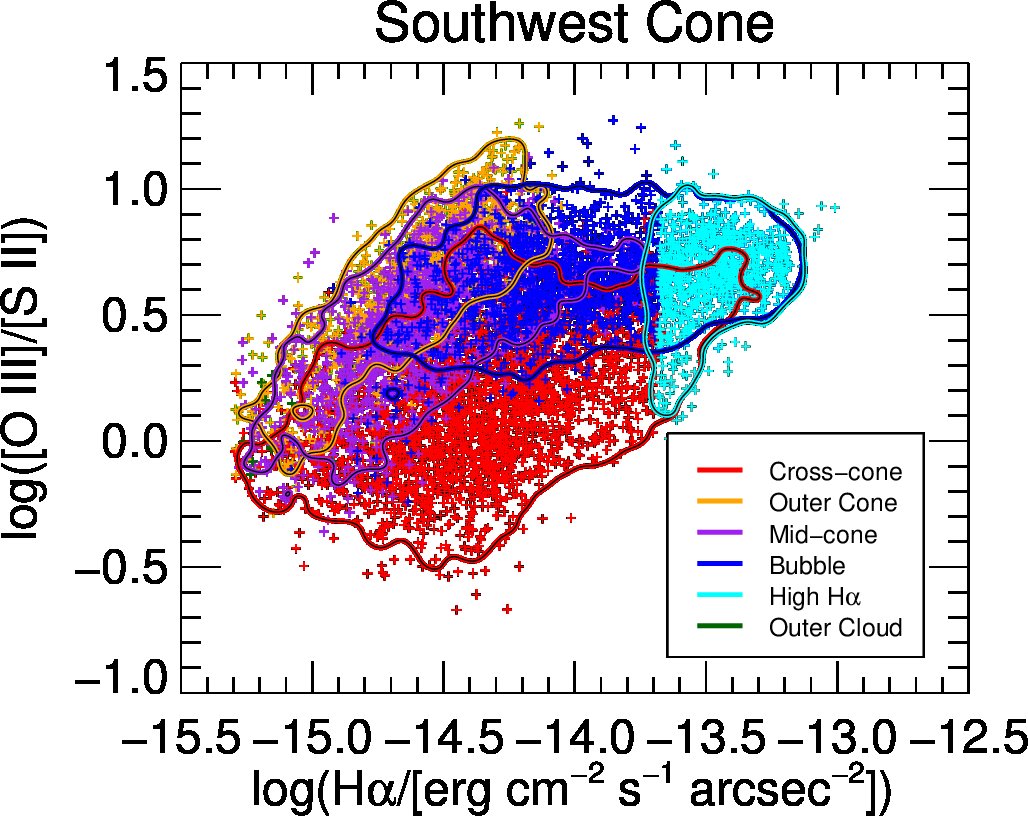
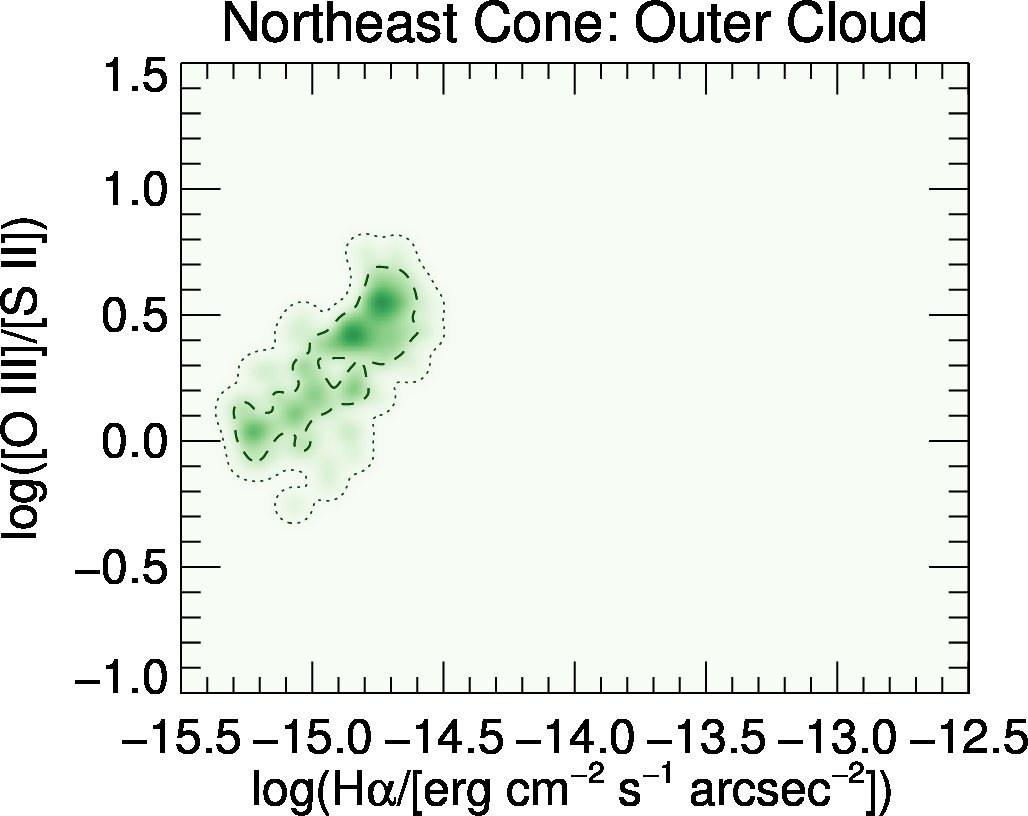
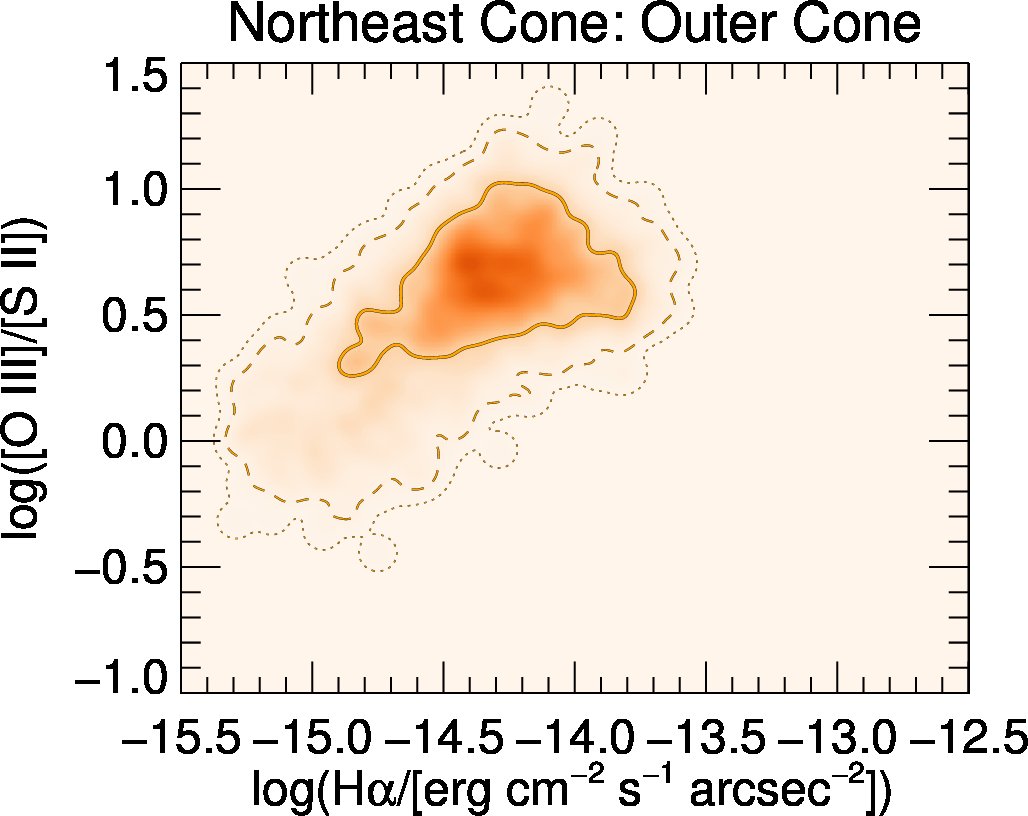
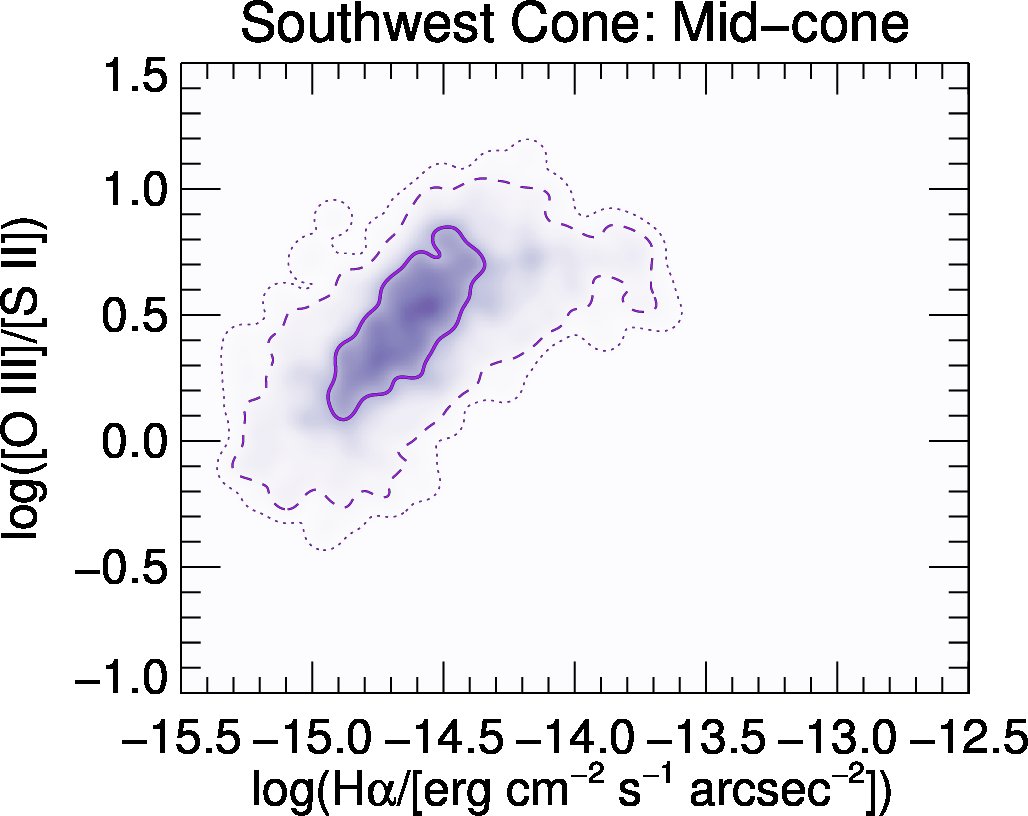
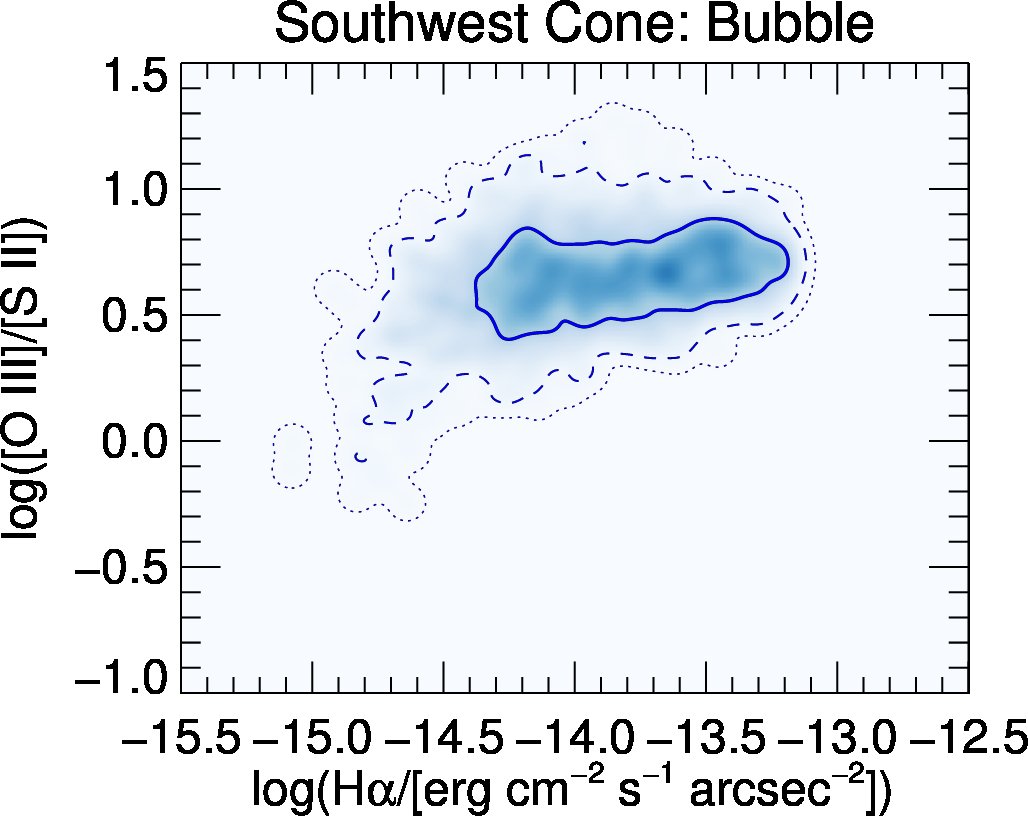
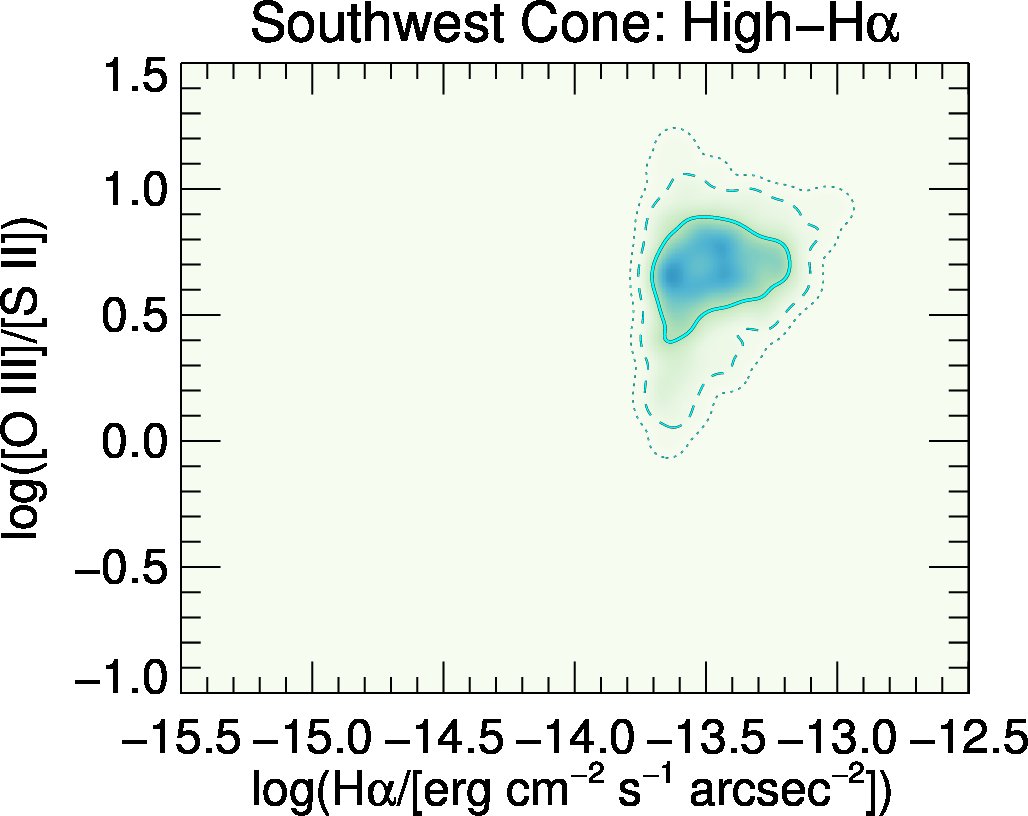
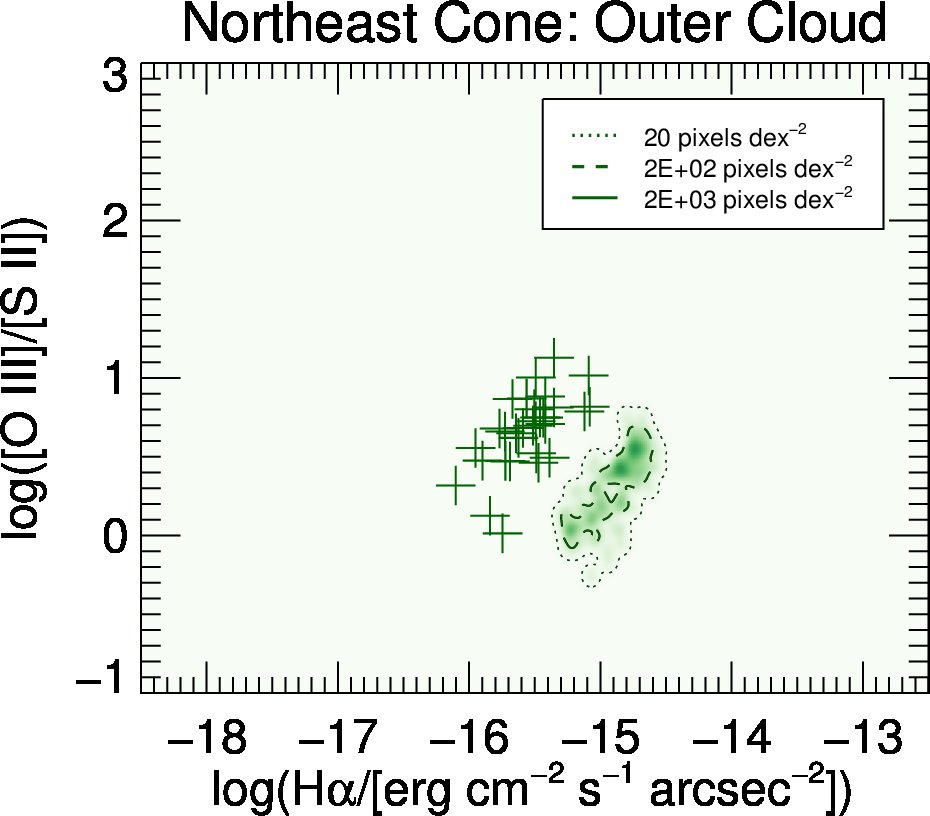
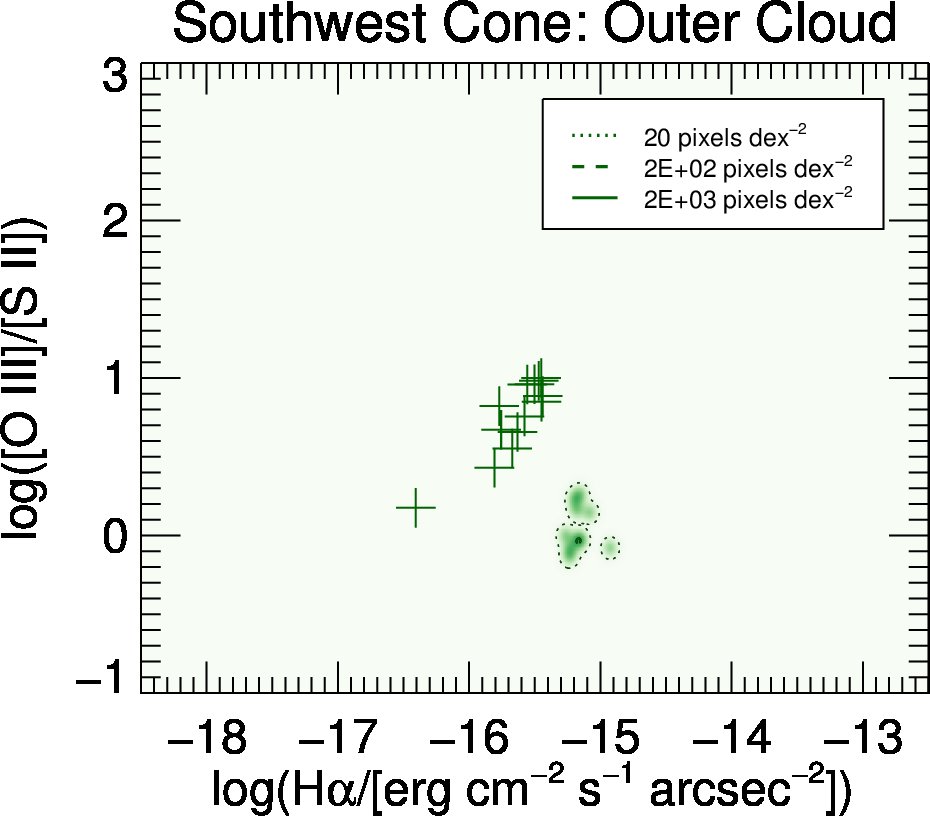
In Figure 19, we also investigate relative ionization indicated by individual WFC3 pixels (in terms of [O III]/[S II]) as a function of H strength, using the same spatial sub-regions defined for Fig. 17. Several trends are apparent from these diagrams. First, within the cones themselves, most points in this region have log[O III]/[S II] regardless of distance from the nucleus or strength of H. The cross-cone sub-region, however, has systematically lower [O III]/[S II] than all other sub-regions, and lower values of [O III]/[S II] become more common with decreasing H. The notable exceptions in the cross-cone region include several high-[O III]/[S II], high H points associated with the nucleus (labeled ‘C’ in Fig. 4). For clarity, we plot each of the sub-regions separately for both the NE and SW cones (Fig. 20).
 |
 |
 |
 |
 |
|
 |
 |
 |
 |
 |
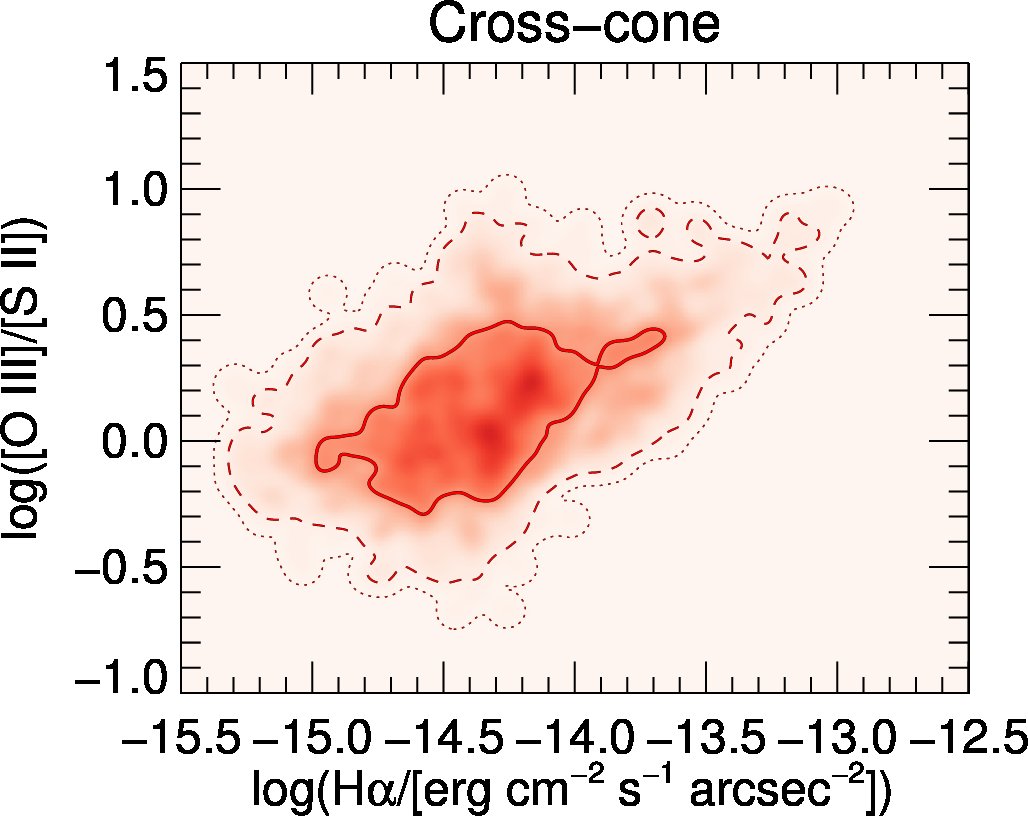 |
In both cones, the brightest H of a given sub-region’s spatial frequency contour decreases with distance from the nucleus. In the SW cone, we see a systematic evolution in the spread of [O III]/[S II] as we move away from the nucleus. For a given H, the lower contour bound of the outer cone typically has higher [O III]/[S II] than the mid-cone, which is higher than the bubbles. The same is true for the upper bound of each region’s contour.
For both cones, the outer clouds occupy a wide range of [O III]/[S II]. Although this sub-region is typically very weak in H, it contains many of the most extreme outliers for both low and high [O III]/[S II].
4.5.3 Radial Trends in Line Ratio Maps
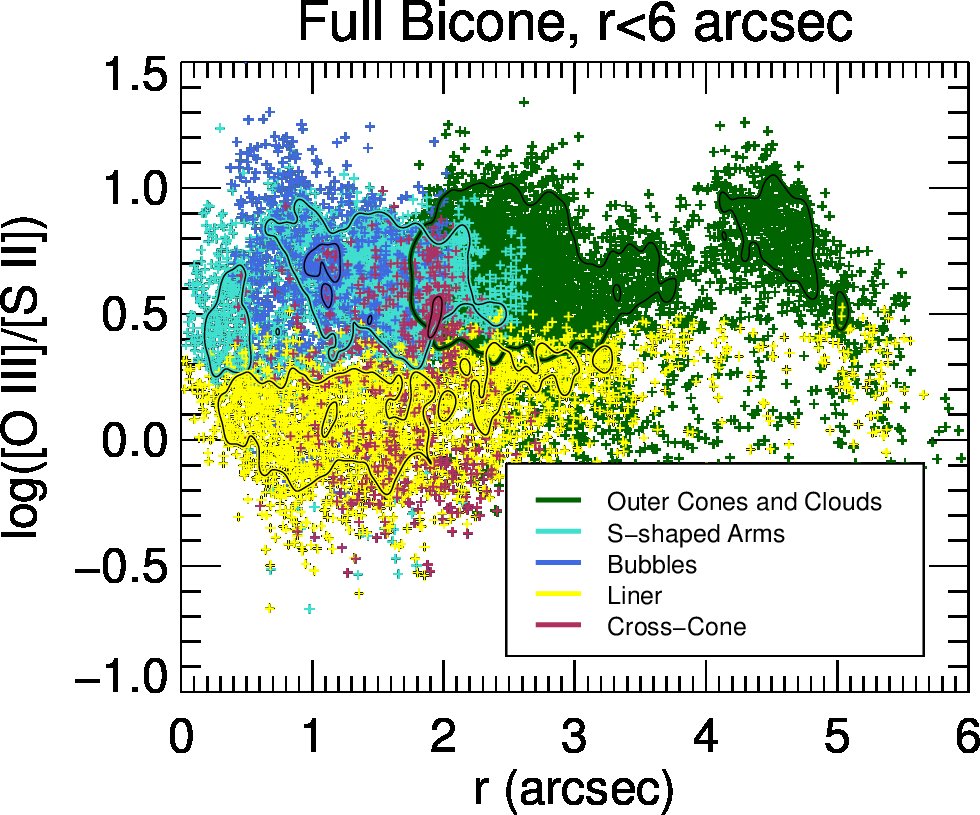
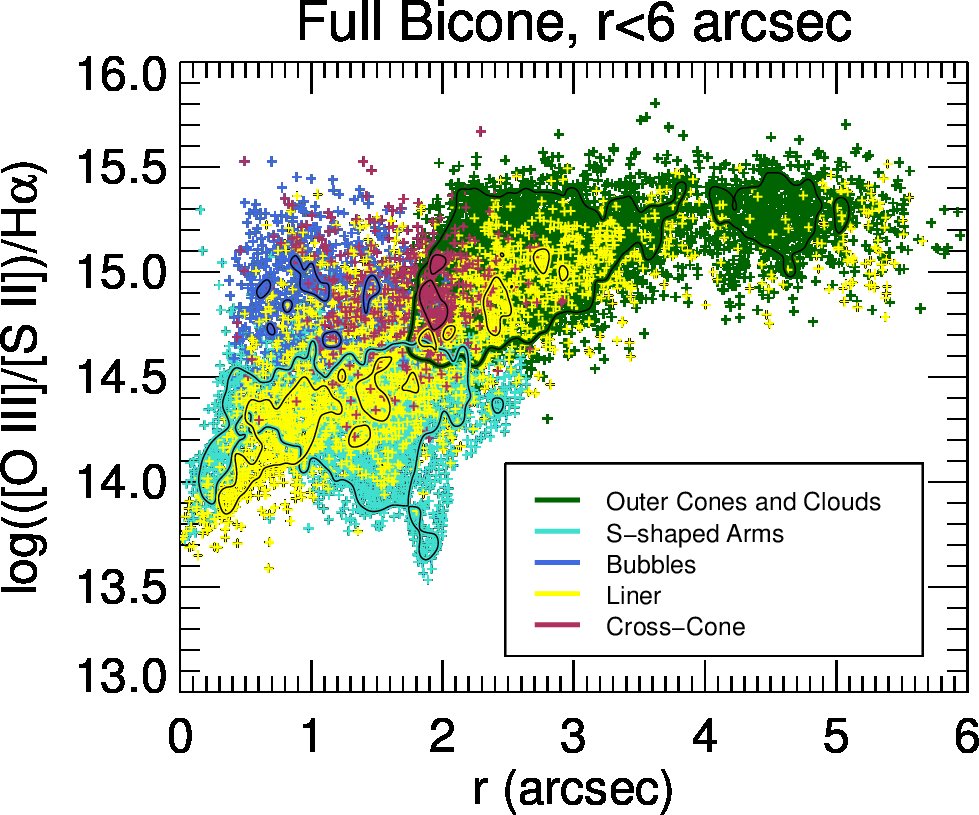
Regions outside the S-shaped arms are characterized by lower densities (approaching outside the S-shaped arms, vs. inside them; Cooke et al. 2000). In the outer regions, [O III]/[S II] appears to rise with increasing H, whereas [O III]/[S II] flattens or saturates in the brightest H regions. To examine radial trends of [O III]/[S II], we plot log([O III]/[S II]) vs. radius in Fig. 21 (top). Here, we use a different set of regions: LINER (as in Maksym et al. 2016), the S-shaped arms (selected from contoured regions such that log([O III]/[S II])/H), the bubbles (enclosed by the S-shaped arms), outer cones and clouds (boxes covering the ionization cones at ), and the cross-cone, where brightnesses are in .
Although the dichotomy between Seyfert-like and LINER pixels is typically well-described by Fig. 21 (top) by position on the [O III]/[S II] axis, there are several Seyfert-like pixels with [O III]/[S II] characteristic of the LINER pixels. This population of apparently low-[O III]/[S II] Seyfert-like pixels could be an artifact of the choice to approximate for BPT diagnostics, under the assumption that extinction is negligible (see Maksym et al. 2016; Cooke et al. 2000). For comparison, the Calzetti et al. (2000) reddening law predicts [O III]/[S II] for (, Güver & Özel 2009), which is consistent with dust lanes that are evident from comparison of HST UV and optical images. Scatter in Fig. 21 is likely due to local variations in cloud density.
In Fig. 19, the “saturated” high-H regions are associated with the arms, which may be influenced by shocks, whereas in other regions [O III]/[S II] appears to rise with H. [O III]/[S II] in a given ENLR may vary with the locally incident flux from the AGN. We therefore normalize [O III]/[S II] by H to remove this dependency, using H as a proxy for the rate of ionizing photons available to power the emission. In Fig. 21 (bottom) we plot log(([O III]/[S II])/H) vs. radius with regions defined as in Fig. 21 (top) . While most of the outer regions have relatively flat ([O III]/[S II])/H, pixels in the arms (cyan ) are typically dex below the bubbles, cross-cone and outer regions. Since we do not see trend in Fig. 21, [O III]/[S II] in the arms must be small relative to H as compared to other regions. At small radii, LINER pixels tend to trail Seyfert-like arm pixels with radius, which is consistent with Maksym et al. (2016).
4.5.4 Selection Effects Due to Surface Brightness Thresholds
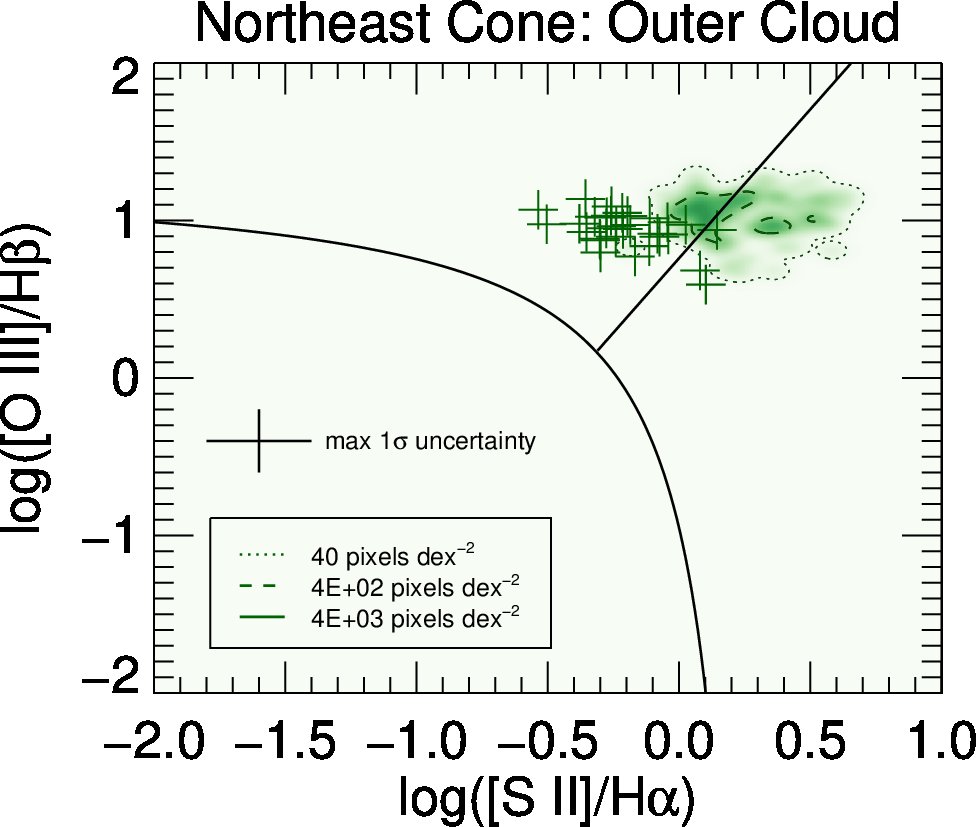
In order to investigate selection effects in our line ratio map analysis, we reduce the the effective signal-to-noise threshold by rebinning the “outer clouds” regions in Fig. 17 by a factor of 20 in each image dimension. This region has faint extended structure which is visible by eye in H, [O III] and [S II] maps. We then plot resolved BPT diagrams and [O III]/[S II] vs. H in Fig. 22. In the BPT diagrams, rebinning produces more data points in the Seyfert region. In [O III]/[S II] vs. H, re-binning fills in a low-H, high-[O III]/[S II] region which was previously unpopulated at high resolution and a high signal-to-noise threshold. This discrepancy between bin sizes may be explained by a selection effect resulting from the weakness of [S II]. All plausible models predict some correlation of both [O III] and [S II] with H. But emission from [S II] is expected to generally be weaker than [O III], and the depth of our [S II] images is less than both H and [O III]. We therefore expect the higher resolution binning to preferentially select the brightest [S II] regions while excluding higher-ionization regions with bright [O III] but weak [S II]. Larger bin sizes will also have the effect of smearing the [S II]-bright regions, such that they are not seen in the rebinned data.
 |
 |
 |
 |
4.6 Decomposition of Near-Ultraviolet Line and Continuum Emission
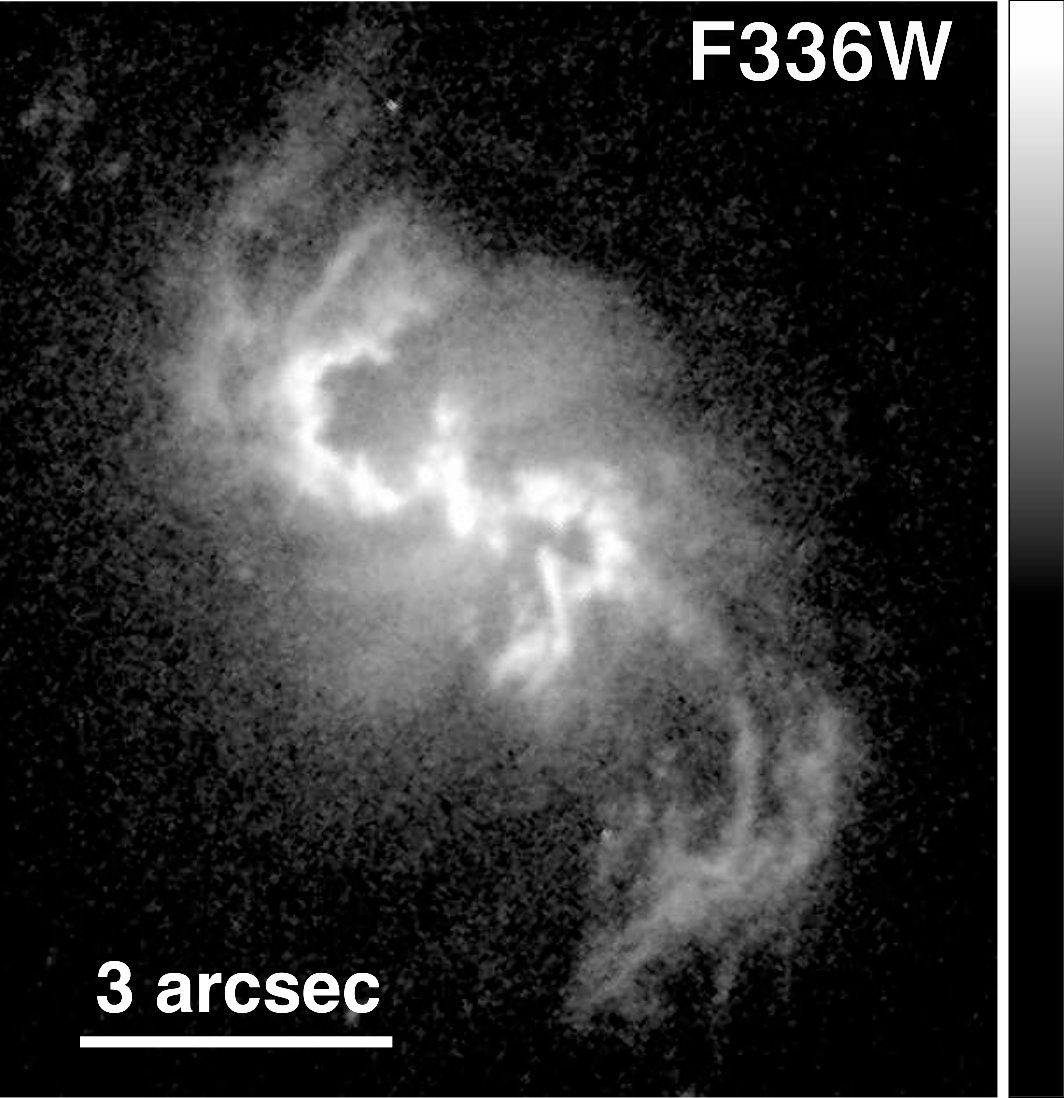
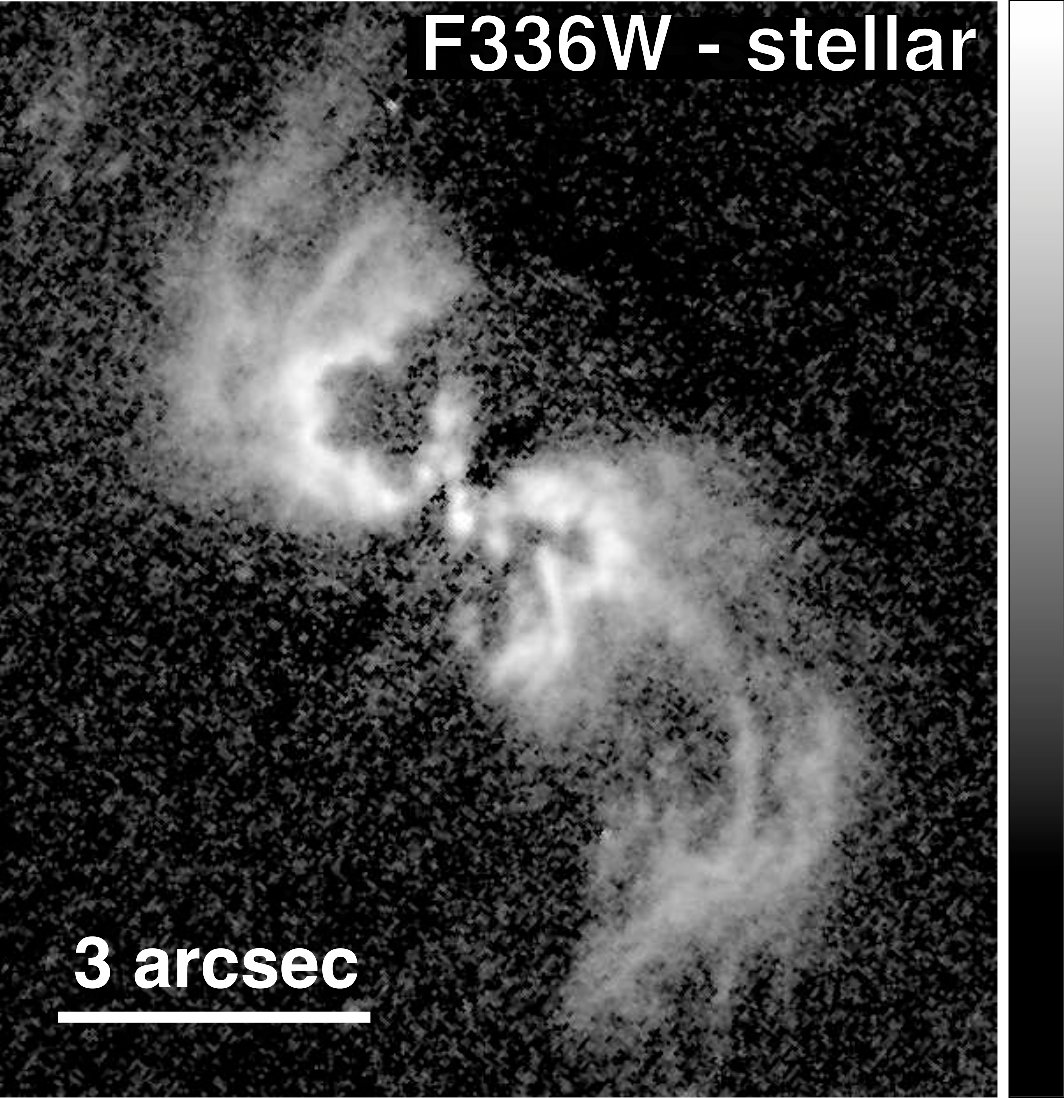
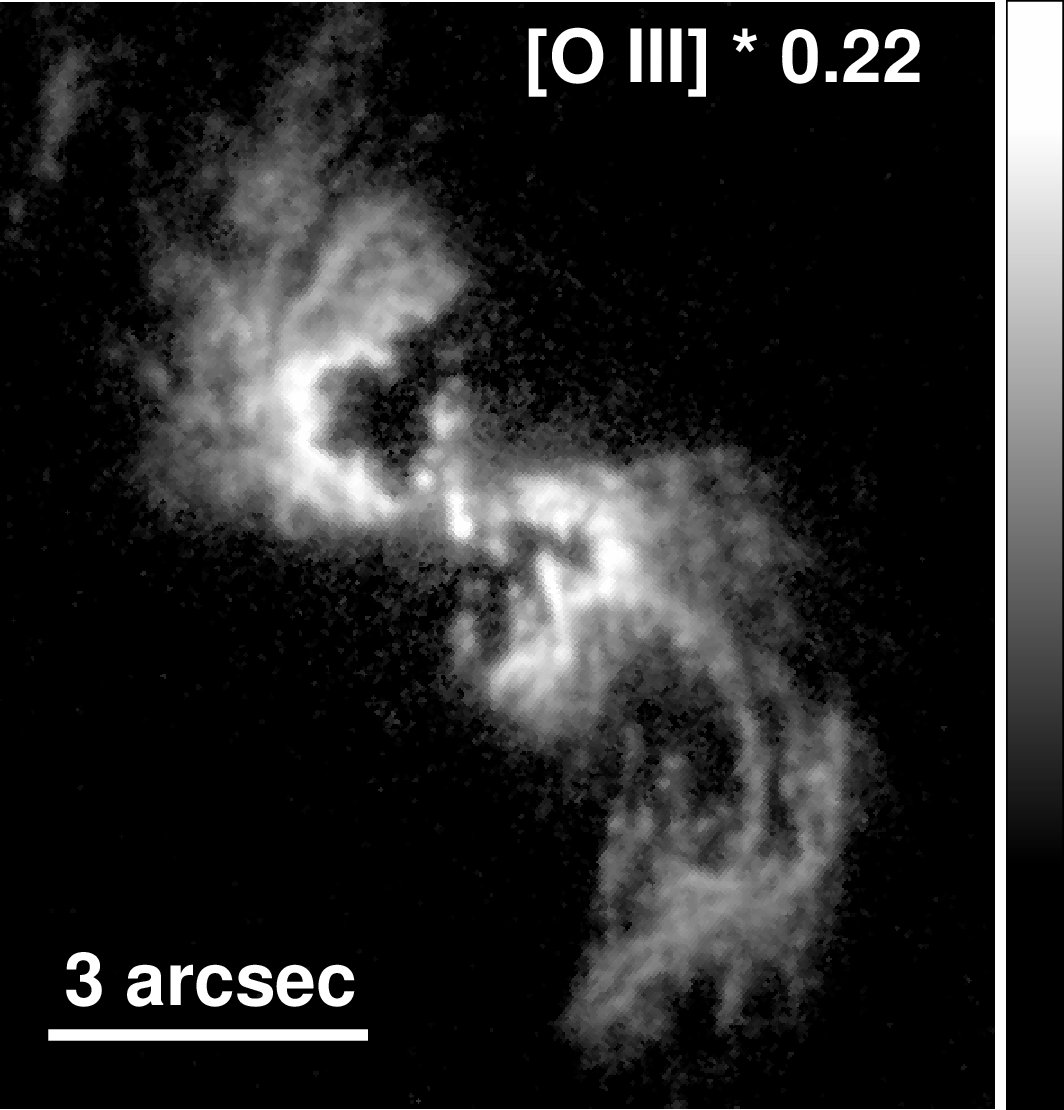
Koss et al. (2015) noted that the extended biconical NUV emission observed in F336W was likely due to some combination of nebular continuum and [Ne V], in accordance with Muñoz Marín et al. (2009). Muñoz Marín et al. (2009) had previously used WFPC F330W and [O III] narrow filter images to investigate the relative contributions of stellar emission, the nebular continuum, line emission, and scattered light to the near ultraviolet emission of 15 galaxies, including NGC 3393. The pre-COSTAR NGC 3393 data were noisy and required deconvolution which introduced artefacts. We therefore follow a similar procedure to investigate the relative contributions of the nebular continuum and line emission. We display the results of this analysis in Fig. 23. Differences in bandpass and central wavelength between WFPC F330W and WFC3 F336W are small enough to be negligible. We performed our image scaling and subtraction by using AstroDrizzled flux density images which have been multiplied by the bandwidth keyword PHOTBW to obtain the total band-specific flux.
Like Muñoz Marín et al. (2009), we assume that [Ne V] is the primary contributor to line emission in F336W and assume from the Cooke et al. (2000) analysis of HST FOS data. Muñoz Marín et al. (2009) report from analysis of CTIO data by Storchi-Bergmann et al. (1995), although we calculate 27.5) but all values imply a modest contribution of [Ne V] relative to the nebular continuum. For comparison, for which Muñoz Marín et al. 2009 derive for their set of Seyfert 2 galaxies.
Unlike Muñoz Marín et al. (2009), we directly infer the stellar continuum contribution to F336W by rescaling the [O III] continuum. To rescale the continuum assume that the extended UV light in the cross-cone within 2″ of the nucleus is dominated by light from a uniform stellar population. As is evident from Fig. 23 (top, center), the stellar component (SC) is well-represented by a scale factor such that STMAG, which is compatible with an old ( Gyr) nuclear stellar population according to Fig. 3 of Muñoz Marín et al. (2009).
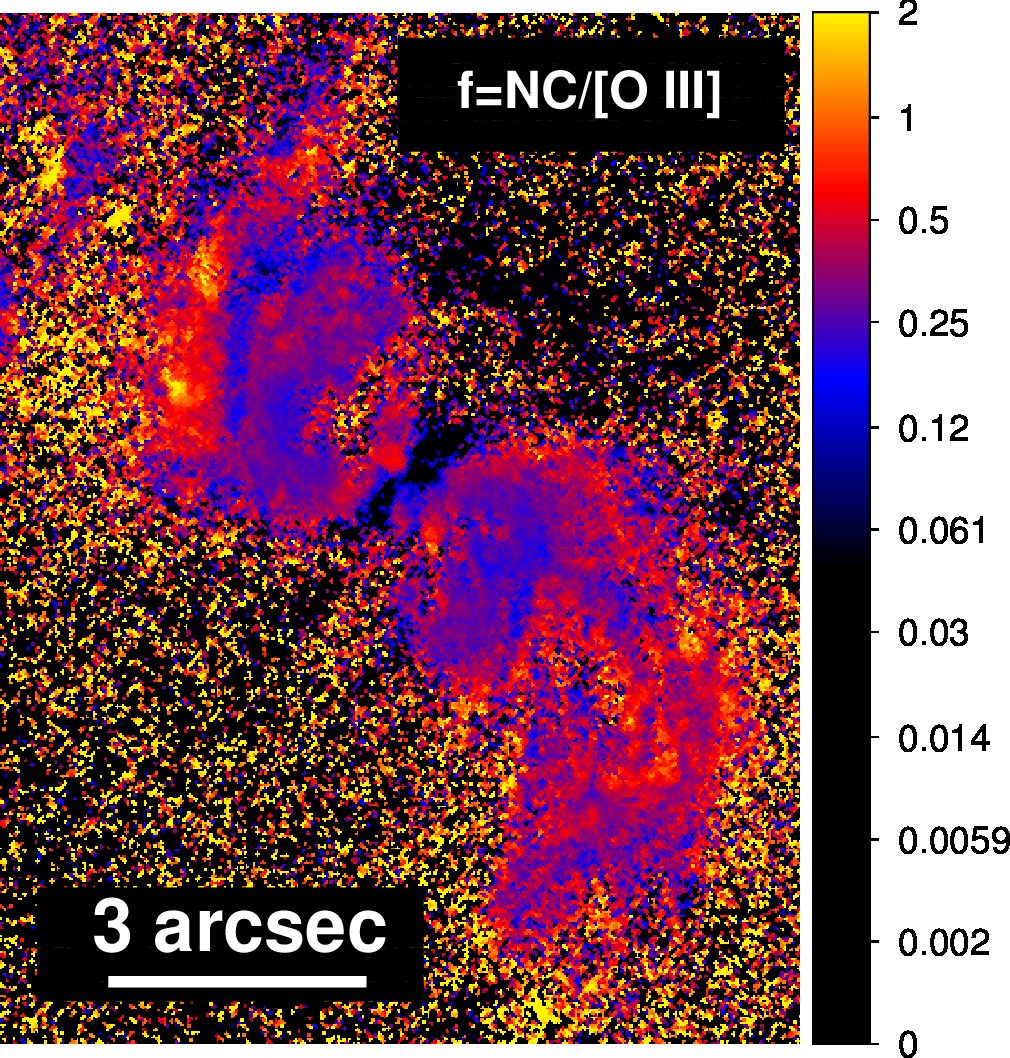
Similarly to Muñoz Marín et al. (2009) (but accounting for our inferred SC), we infer where is the flux of the nebular continuum (NC) by varying to minimize image residuals for F336W-[Ne V]-.
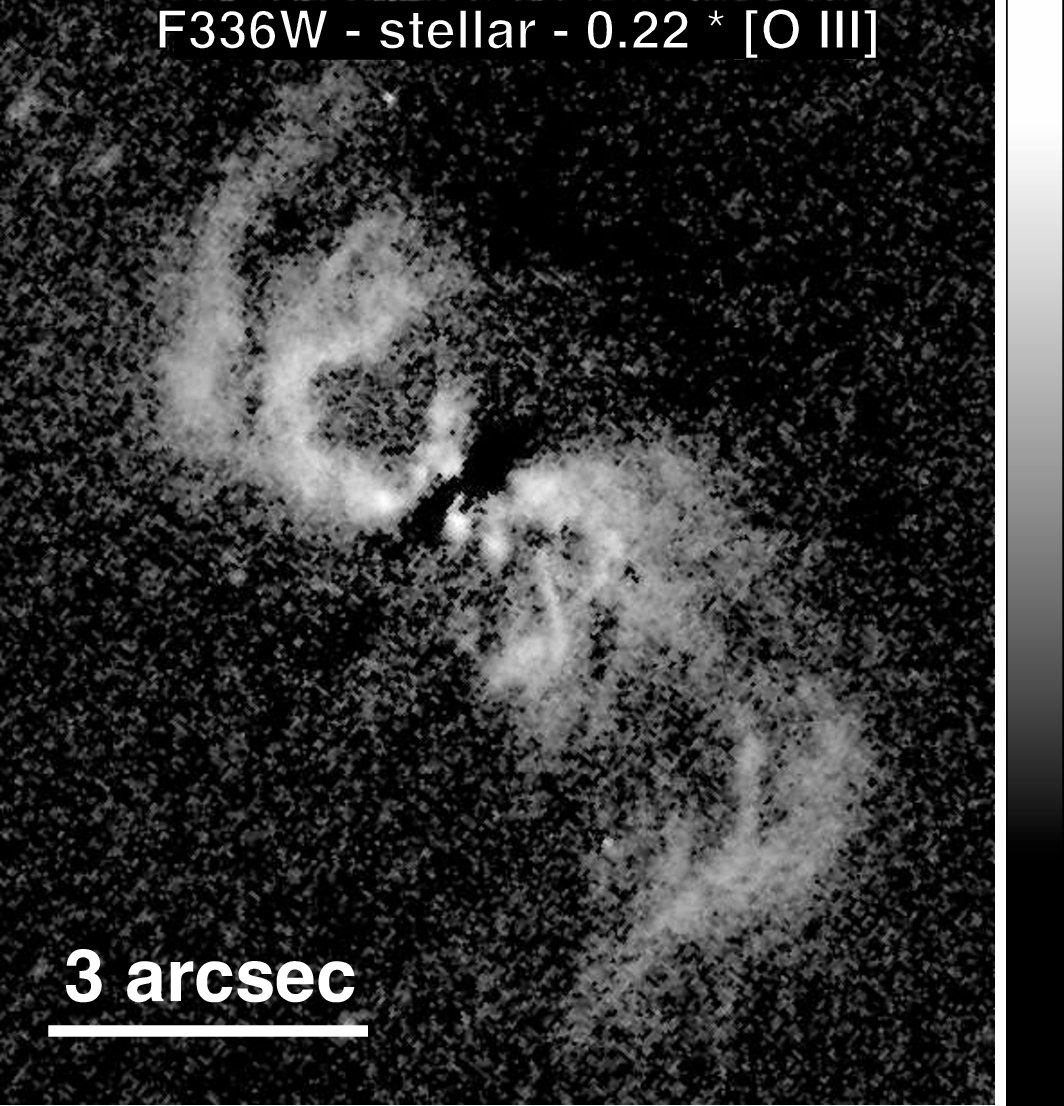
Like Muñoz Marín et al. (2009), we find a plausible range of , such that different values of minimize the residuals of different structures. This range can be seen in Fig. 23 (bottom, left). By visual inspection, Muñoz Marín et al. (2009) determine a best-fit , which is consistent with their prediction of . We find that although accounts for the majority of extended nuclear F336W emission, it simultaneously introduces strong negative residuals (black in Fig. 23, bottom right) without eliminating the strongest positive residuals. Unlike in Muñoz Marín et al. (2009), these cannot be attributed to deconvolution artefacts. Using the same terminology in Fig. 17, we see that produces negative residuals at the centers of the bubbles, as well as in lanes perpedicular to the ionization cone, both across the nucleus (in the cross-cone) and in the outer cone NE. In the outer cones, fails to eliminate positive residuals of regions in the outer cones NE and SW, as well as for several bright knots in the S-shaped arms at from the nucleus. We will discuss the physical implications of these results in §5.1.1.
 |
 |
 |
 |
 |
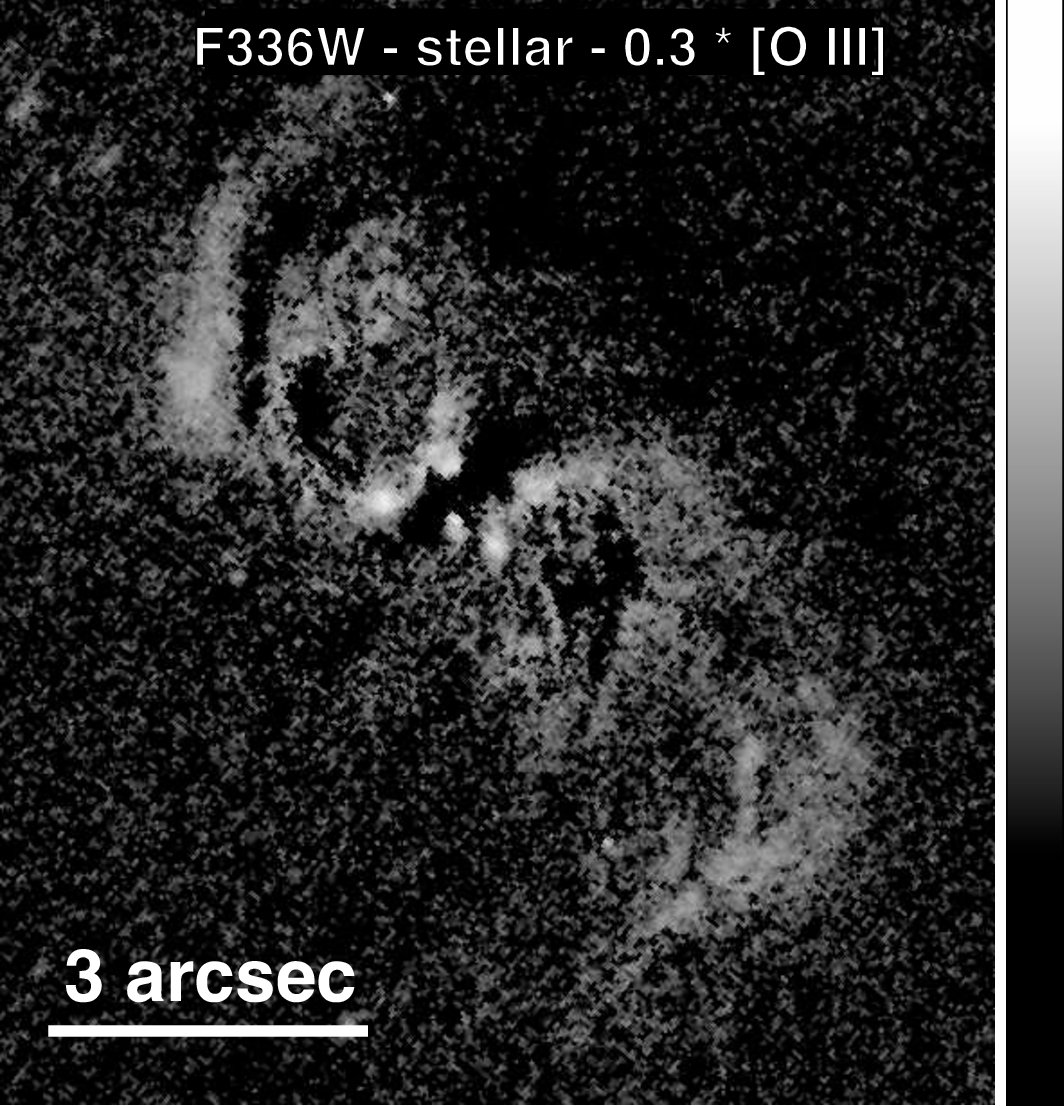 |
Top Panels: Left: F336W image of the NGC 3393 nucleus. Center: As in the left panel, but subtracting a stellar continuum (SC) component scaled from the [O III] continuum to match the cross-cone stellar light at . Right: [O III], representing the nebular continuum in F336W by assuming .
Bottom Panels: Left: map of required such that F336W-SC-[Ne V]-. Center: F336W-SC- for . Small regions in both the NE and SW cones begin to show negative residuals (black). Right: F336W-SC- for . Positive residuals are much-reduced, but there are strong negative residuals at multiple locations within the bicone.
5 Discussion
This work builds upon previous work by Cooke et al. (2000), Bianchi et al. (2006), Zeng (2009) and Koss et al. (2015). Cooke et al. (2000) used spectroscopy and HST narrow-line images to investigate the ENLRs of NGC 3393, and found evidence of S-shaped cloud structures, which appeared to be shaped by outflows associated with radio jets. Bianchi et al. (2006) observed spatially resolved X-ray emission with Chandra, and Koss et al. (2015) supported these associations with new and deeper HST and Chandra observations, which we also use here. We go beyond this previous analysis to investigate the spatial correlation between narrow line emission, radio jets, and extended X-ray structures in greater detail. Our aim is to better determine the origin of those features, and the roles that the jets and ionization cones of NGC 3393 play in the excitation of the ENLRs of NGC 3393.
5.1 Discriminating Photoionization from Shock Excitation
Cooke et al. (2000) used pre-COSTAR Planetary Camera images to investigate the relative roles of shocks and photoionization in excitation of the NGC 3393 ENLR. They determine that the kinetic energy of the outflows is sufficient to power the line emission, but that other tests such as correlations between local velocity dispersion, surface brightness, excitation, and relevant abundances are more consistent with photoionization by a central source. The implication would be that the radio jets have shaped the emission line arms, but ionizing flux from the AGN is necessary to power the line emission. This is notably different from other interpretations of similar objects based on X-ray data, e.g. by Wang et al. (2011b, NGC 4151) and Paggi et al. (2012, Mkn 573), who show that X-ray emission is consistent with shock-driven excitation of the associated optical line arcs in the regions of radio jet impact. In both NGC 4151 and Mkn 573, however, photoionization is dominant in most of the ionization cones (Wang et al. 2011c; Paggi et al. 2012). We will examine these diagnostics for NGC 3393 in Paper III (Maksym et al., in prep).
5.1.1 Constraints from Optical Line Mapping and UV Emission
Cooke et al. (2000) noted that their uncertain detection of mid-ultraviolet (MUV) emission associated with the arms, if real, could be consistent both with shocks and with scattering of AGN light, but that unambiguous nondetection would strongly disfavor the shock scenario. Our unambiguous detection therefore permits both shock and scattered light interpretations.
Koss et al. (2015) suggest the F336W probably corresponds to [Ne V] and the continuum. Using methods similar to Muñoz Marín et al. (2009), we confirm in §4.6 that the data are compatible with the Koss et al. (2015) interpretation. Most of the extended emission is subtracted by this procedure, supporting supporting an important role for the line and continuum gas emission. But the exact value of needed to account for the nebular continuum varies widely with position in the complex biconical ENLR. We suggest several possible explanations for this variation.
The strong negative residuals at may be due to a nuclear dust lane (in the plane of the maser disk), and to dust lanes surrounding the S-shaped arms in the outer cones. The latter dust lanes may either guide the radio outflows, or be shaped by them. The positive residuals in the outer cone which remain when may be due to scattering by dust, or possibly recent star formation outside the dust lanes. Positive residuals in the outer cones may be due to scattered light (such as by dust), or star formation on the outsides of dust lanes. Polarization measurements would be necessary to test a dust scattering hypothesis.
Positive F336W residuals near the nucleus may be due to spatial variation of the ionization parameter, possibly resulting in a locally-enhanced [Ne V] contribution relative to the FOS measurement. The Muñoz Marín et al. (2009) method assumes uniform K, but this assumption may not be valid: inspection of [O III] in the 2D STIS spectra used by Storchi-Bergmann et al. (1995) implies K at near the nucleus, and possibly in the S-shaped arms as well (Osterbrock & Ferland 2006). The spatial complexity of the NGC 3393 NLR suggests a need for a more thorough spatially resolved investigation of the temperature, density and kinematics of these STIS spectra.
In F218W, the emission is likely a composite of the continuum and the strongest lines identified by Cooke et al. (2000) between Å and Å with IUE and the HST FOS, including C III]Å, C II]Å and [Ne IV]Å. The extended nature of the F218W emission implies that these lines are entirely associated with the S-shaped arms, and most likely the FUV emission as well (given the absence of a UV point source is likely due to extinction, which decreases with wavelength in the UV).
By setting a [O III]/(H+[N II]) threshold, Cooke et al. (2000) infer a lower-ionization medium associated with the cross-cone region within of the nucleus. Here, the inferred [O III]/H and [S II]/H maps roughly indicate the low-ionization cocoon surrounding the ionization cones which correspond to the LINER and Seyfert-like regions identified in (Maksym et al. 2016). Here we also identify numerous smaller-scale structures which appear physically distinct in each ratio map.
To first order, [O III]/H may be used to represent photoionization, whereas [S II]/H may be attributed to shocks. For example, narrow-line imaging of [S II]/H is commonly used as an indicator of shocks in supernova remnant studies (e.g. Lee & Lee 2014), and a threshold of [S II]/H is a common selection criterion in supernova remnant searches. Morphological identification of jet-driven fast shocks has been used in conjunction with resolved observations of AGN EELRs with [O III]/H and [S II]/H (e.g. SDSS J224024.1 092748, Davies et al. 2015).
The strong [S II]/H along the angular boundaries of the ionization cones (Fig. 12) might be interpreted as due to shocks, such as from bubble of ionized gas expanding into the ISM, but such a possible origin is complicated by the geometry. In particular, dense material in the torus or at the base of the cone could partially shield the gas from lower-energy ionizing photons, resulting in low-ionization material at extreme angles. Such a mechanism has been shown to explain cross-cone emission in NGC 4151 (Kraemer et al. 2008) and LINER-like emission in NGC 5252 (Goncalves et al. 1998). Alternately, the [S II]/H cocoon might result partially from ionizing radiation reprocessed in the inner cones. Additional narrow-line imaging observations are necessary to break this degeneracy in interpretation, such as [O II] 3727 to probe collisional excitation and [O III] 4363 for a temperature diagnostic. We therefore proceed with these caveats in mind.
In our examination of the [S II]/H maps of the NGC 3393 ENLR, we find that almost all () of the area meeting our minimum H criterion show [S II]/H. The validity of this criterion is dependent upon our modeling of [N II], which Cooke et al. (2000) show to be large (comparable to H), and may have significant spatial variations given the range of densities likely between the jet outflows and S-shaped arms. But given the large values in our [S II]/H maps, we would expect large regions of [S II]/H to remain even if [N II] varied spatially by as much as a factor of a few.
5.1.2 Resolved X-ray Emission as a Signature of Shocks
At least two aspects of the X-ray morphology support an origin for the line emission that is at least partially shock-driven. First, in the NW cone, curve A is associated with a filament of X-ray emission which runs between, and parallel to, the [S II]/H curve at the edge of the NE radio lobe, and the [O III]/H filament at larger radius from the lobe. This might be expected if the X-rays correspond to shocked gas leading the jet expansion, and line emission is stimulated by photons generated within the shocks (Cooke et al. 2000; Dopita & Sutherland 1995). Since the critical density of [S II] is low (), [S II]/H would correspond to the low-density post-shock, X-rays to the shock itself, and [O III]/H to the ionized precursor medium.
Second, peak radio emission from the SW radio lobe corresponds to a knot of strong X-ray emission. Koss et al. (2015) examined VLA and VLBI observations of NGC 3393 and proposed that the strong emission in the southwest jet is due to doppler beaming in the hotspot of an approaching jet. The X-ray emission, combined with the north-south feature in the SW cone mid-cavity, suggests shock interaction with the surrounding medium. Knot B also indicates strong [S II]/H and hence a possible role for shocks in this region. Bulk motion from a jet in the direction of the observer could explain some of the irregular kinematics found by Fischer et al. (2013), who invoke an off-nuclear kinematic center to explain blueshifted material in this region. The large velocities in this region (; ) are consistent with shock models (see, e.g., Contini 2012), although the large FWHM may be due to line splitting.
As can be seen in Fig. 16, the extended X-ray emission associated with arc A, knot B, and the jet lobes is relatively hard, with significant emission above 2 keV. As in recent studies of ESO428-G014 by Fabbiano et al (2017; submitted), the extended hard emission on kpc scales suggests that the origin of keV X-rays is more complex in compton-thick AGN than is generally assumed. In the context of our other NGC 3393 data, the extended hardness suggests a possible role for shock origins of these features. Fabbiano et al (2017; submitted) also note that an extended hard continuum can be enhanced by charged particles accelerated in a radio jet. In Paper III of this series (Maksym et al, in prep), we will investigate these features via detailed study of spatially resolved X-ray spectroscopy and X-ray line emission morphology.
5.1.3 Shock Compression and Filling Factors
If line emission in the S-shaped arms is due to shocks, we expect the filling factors of ENLR gas to be consistent with this picture. We assume where is the H luminosity, is density, is Planck’s constant, is the recombination coefficient for H, is the frequency of H, is the filling factor, and is the volume. We assume densities determined from the [S II] doublet by Cooke et al. (2000) ( in the arms and in the outer regions), although we note that these values are limited by the angular resolution of their ground-based spectroscopy. These densities also approach the useful limits of the [S II] doublet at the low and high ends, suggesting more extreme values may be possible.
Under these density assumptions, the filling factors are consistent with shocks for a broad range of assumptions regarding gas cloud thickness and the precise location of the shock edge. If the gas clouds extend in the observer’s line-of-sight, we find , where is the H surface brightness in units of , is density in , and is temperature in K. For representative values inside and outside the S-shaped arms (), such a density gradient () produces a filling factor gradient () and a compression factor () consistent with shocks. The larger filling factor is comparable to expected from (Contini 2012) using [Ne III] m, if we assume the mid-infrared [Ne III] is also co-spatial with the optical, UV and X-ray emission at pc ().
In this scenario, the leading edge of the shock compresses pre-shock gas into a very small volume, producing a filling factor that is significantly lower than that of the circumnuclear ISM. The filling factor in such pre-shock gas is already low in the NLR of typical AGN. High spatial resolution spectroscopy of the [S II] doublet could confirm the specific assumptions we make about the density distribution. Also, given the limited density range of [S II] the true compression ratio may be even larger than we infer.
Fig. 21 provides a check on this scenario. In the S-shaped arms, ([O III]/[S II])/H is a factor of below the outer regions (), and a factor of below other regions at small radii () comparable to the arms. In Fig. 19, however, the S-shaped arms have comparable [O III]/[S II] Seyfert-like regions at larger radii. The low ([O III]/[S II])/H of the S-shaped arms must therefore result from the H surface brightness. The spatial variation in surface brightness here acts as a check on our inferences regarding the gas compression; if with a compression factor the gas volume decreases by a factor , then emissivity also increases by . Thus, if we expect a compression factor of , we should see a similar variation in . Here, we see that the variation () is small relative to the inferred compression factor. A compression factor compatible with shocks is therefore reasonable.
5.1.4 NGC 3393 in the Context of Previous Theoretical Models
Contini (2012) modeled UV, optical and IR spectroscopy of NGC 3393 to investigate the roles of collision and merging in NGC 3393 relative to claims of a supermassive black hole binary by Fabbiano et al. (2011). Contini (2012) found that though the AGN was likely the dominant source of [O III] excitation, shocks of are necessary to explain their full dataset, and required pre-shock densities a factor of higher than is typical of other Seyfert NLRs. Contini (2012) suggests that the Levenson et al. (2006) models of X-ray emission extended throughout inner kpc of the ionization cone region are consistent with these shock models, with the highest-velocity shocks in the galaxy’s central regions. Contini (2012) also suggests some of the X-rays could originate from X-rays emitted downstream from the shocks. Using our deeper Chandra data, we have produced deconvolved X-ray images which support the Contini (2012) models, but with the specific implication that the strongest X-ray emission comes from narrow (, 50 pc) filaments and knots associated with nearby [O III]/H and [S II]/H features suggestive of shocks and shock-illuminated material. Outside of these filaments, extended X-ray emission is still present, but with a surface brightness at least an order of magnitude less than in the filaments. In our subsequent paper, Maksym et al. (in prep), we will investigate plausibility of these claims using resolved X-ray spectroscopy.
Contini (2012) claim that because their models are consistent with the illumination of the leading surface of a shock rather than the receding side, matter must be infalling. We note that such a scenario may be possible for material driven by an expanding jet of this nature, particularly when much of the shock front is parallel to the jet axis and some material may be driven sideways or back towards the center.
5.1.5 Cosmic Ray Heating
Line-emitting gas in contact with radio plasma (such as is present in NGC 3393) may experience cosmic ray heating, such that a relativistic population of particles in the plasma produces anomalous line enhancements Ferland & Mushotzky (1984). For example, models by Gagne et al. (2014) required cosmic ray heating to explain enhanced [O II]/[O III] ratios in the ENLR of the “Teacup” galaxy, which surrounds bubbles of radio-emitting that span kpc. Although the FOS spectra of the NE arm analyzed by Cooke et al. (2000) point to much lower [O II]/[O III] values ( in NGC 3393, vs. in parts of the Teacup), the magnetic field strength, pressure and energy derived by Cooke et al. (2000) are comparable to those found in the Teacup by Gagne et al. (2014), suggesting that cosmic ray heating could be energetically significant. Spectral modeling beyond the scope of this paper would be useful to constrain the contribution of cosmic ray heating relative to other effects.
5.1.6 Summary
Although we find ambiguity in the interpretation of the low-[S II]/H cocoon with respect to alternate interpretations of shocks and reprocessed photons from the AGN, we now see a unified picture arising for the SW cone:
The bright knot from our PSF-deconvolved Chandra image corresponds to the radio hotspot described by Koss et al. (2015) and the kinematic ‘center’ suggested by Fischer et al. (2013). The jet, coming from the true nucleus at the hard X-ray centroid and central radio source, collides with a locally overdense region of the ISM at . The actual jet velocity may be much larger, since the FWHM is sampled for a region displaced from the center of the knot. Since this motion is largely in the plane of the sky (which is nearly parallel to the plane of the galaxy), we do not see the strong signatures of this motion in the kinematics described by Fischer et al. (2013) until the jet collides with the overdense material SW of the nucleus and begins to ablate it. The collision shocks the gas at the jet-ISM interface, and the material from the jet itself splays outwards from the collision site and inflates a bubble described by a P-Cygni profile seen in the STIS spectroscopy of Fischer et al. (2013) and the line ratio map cavity described §4. The gas at the collision site is shocked, producing, an X-ray knot, enhanced radio emission, and possibly the nearest regions of locally enhanced [O III]/H and [S II]/H as well. Such shocks may explain the need for a shock component in the spectral models of Contini (2012).
5.2 Spiral and Cocoon Structures
5.2.1 The Origin of the S-shaped Arms
Cooke et al. (2000) question the origin of the S-shape for the arms, when radial jet motion might produce a figure-8 shape and the galaxy’s spiral arms should sweep gaseous material onto the opposite side of the jet if they are trailing. This asymmetry is obvious from a ratio of between the bright and faint sides in H surface brightness, and ratios of in X-ray flux (although in Maksym et al. 2016, the delineation between Seyfert-like regions in the bubbles and the surrounding LINER-like cocoon is basically symmetrical). The default motion of jets and disk-wind bubbles through the nuclear ISM of a galaxy should be linear and produce line-emitting overdensities or shocks at the leading edge of the bubble-ISM interaction.
If the cavities are predominantly formed by the motion of jet expansion, the apparent extent and position of the radio lobes are a mystery, as the cavities are at least a factor of larger than the jet lobes. If the structure of the jet follows the cavities, the small-scale complexity of the cavities at also implies similar small-scale radio counterparts, which we do not observe. The nature of the X-ray arc in the NW cross-cone is uncertain. It may be part of a larger-scale ellipsoidal structure which surrounds the inner of the ENLR, or it may be a trailing portion of the NE S-shaped arm.
The S-shaped structure of the X-ray and optical line emission implies non-radial directionality either in the leading material, or a rotational component to the bubbles’ motion. The S-shape may result from entrainment by patterns in the ISM (such as spiral structure near the nucleus; Fischer, private communication). If the galactic medium is denser on the non-emitting side, the rising jet lobes might preferentially expand into lower-density material and therefore transfer more kinetic energy in that direction. In such a case, the elongation of the blobs could be due to lateral expansion relative to the ISM.
5.2.2 Accretion Disk Precession
Rather than local gas overdensities, the S-shaped structure could result from the rotation of the jets or winds. Such rotation may occur if the outflow-launching disk precesses due to gravitational interaction, such as in a supermassive black hole binary (SMBHB Begelman et al. 1980). Simulations of precessing accretion disks show that S-shaped structures arise naturally on smaller scales (Kurosawa & Proga 2008). A prerequisite SMBH-SMBH or SMBH-disk angular momentum misalignment is plausible, given the plane of the megamaser accretion disk is perpendicular to the plane of the sky (Kondratko et al. 2008), whereas the galaxy itself is nearly face-on. We expect the outflow-emitting black hole to be precessing counterclockwise, based on the S-shaped orientation,
The radio plasma within the S-shaped structures is likely to be stable against rotational motion, since it is strongly magnetized (; Cooke et al. 2000) and even weak magnetic fields are sufficient to stabilize outflow bubbles in galaxy cluster simulations (Jones & De Young 2005). The conditions of the ambient medium differ from galaxy clusters, with higher density () and only partial ionization ( K).
Detection of a bent radio jet would support a precession hypothesis (Begelman et al. 1980), but there is no clear evidence for such a structure. Koss et al. (2015) examined VLBI observations of NGC 3393 at 2.3 GHz and 8.4 GHz, but only detected the SW hotspot, suggesting that most of the radio emission detected by VLA is resolved out by VLBA data. Structure brighter than mJy/beam is not found on scales of pc, suggesting that the radio bubbles should be treated as an expanding plasma rather than collimated structures.
SMBHB-induced precession of the disk might produce the S-shape through deformation of the ISM by the rising bubbles. Such an explanation might also be consistent with the SMBHB claim of Fabbiano et al. (2011). The (pc) separation from Fabbiano et al. (2011) provides a relevant starting point for the possible impact of a SMBHB in this system, given a wide variety of possible SMBHB parameters. At this separation, we expect disk precession to be dominated by the orbit, whose period (neglecting the effects of disk mass) is yr (eq. 6, Liu & Chen 2007), where is the primary black hole mass in units of , is the orbital separation, is the Schwarzschild radius of the primary SMBH, is the SMBHB mass ratio, and is the total stellar mass enclosed within the binary, here taken to be 5. For (Kondratko et al. 2008), pc and , we find yr. Outflow rotation may also be induced due to geodetic precession of the primary Begelman et al. (1980); Roos (1988) or tidal precession in an inclined secondary Katz (1997). These effects are expected to become important when the binary is close (sub-parsec) and may be shorter than kiloyears depending upon the orbital parameters (Liu & Chen 2007).
We can compare this with plausible timescales inferred from rising bubbles that shape the outer edge of the S-shaped arm. We can assume that the edge of the arms indicates leading edge of rotating outflow, and that when a rising outflow reaches the edge it decelerates to approximately terminal velocity; if a bubble rises ″ as the outflow sweeps through with yr, consistent with edge of the NE arm, its mean rising velocity is . Given numerous uncertainties, is not significantly faster than the expected terminal velocity calculated according to Braithwaite (2010) (assuming local Keplerian velocity , where is inferred from Fischer et al. 2013, and the radius of the bubble is half its distance to the nucleus).
A simpler alternative to SMBHB precession is precession of the disk of a single SMBH. Such precession would be due to the Bardeen & Petterson (1975) effect, where Lense-Thirring precession causes a misaligned disk to warp and align with the SMBH spin. From Lu & Zhou (2005), expected period ranges from yr (assuming disk viscosity , , dimensionless black hole spin , and accretion rate ) to yr (assuming , ; values from Kondratko et al. 2008). A shorter period than our derived SMBHB implies an even faster rising velocity, which is less likely given the speed of sound. Also, the critical radius for the precessing disk is pc (derived according to Lu & Zhou 2005), which is a factor of smaller than the inner megamaser disk size of 0.17 pc (Kondratko et al. 2008). Since there appears to be good alignment between the axis of the megamaser disk and the ionization cones (Kondratko et al. 2008), there is no evidence for misalignment between the extended and inner disks. Given these problems, a single-SMBH scenario would therefore disfavor the idea that the S-shape is predominantly due to disk precession. SMBHB precession may therefore be more likely than single disk precession, if the S-shaped structure is not entirely due to environmental asymmetry.
Deeper high-resolution radio observations could help determine the origin of the S-shaped structure. Line-emitting filaments that surrounding cavities which do not appear to be associated with radio emission could be formed by a low-energy population of electrons from a earlier stage of the outflow. If so, then deeper VLA observations at comparable resolution to the pre-existing data () should be capable of detecting them. Alternately, VLBA observations at 326 MHz have a largest angular scale and could therefore detect plasma structure at these scales. Detection of such extended structure could support the precessing outflow model of S-shape formation here.
6 Summary and Conclusions
As part of the continuing CHEERS project, we investigate the spatially resolved relative contributions of photoionization and shocks in NGC 3393, a nearby Seyfert 2 AGN. Using narrow filter Hubble WFC3 images, we directly compare the relative spatial distributions of [O III], [S II] and H against deep PSF-deconvolved Chandra images with (pc) resolution, as well as older VLA 8.4 GHz images of the sub-kpc radio jet, where the jet has long been suspected (e.g. Cooke et al. 2000; Koss et al. 2015) to play an important role in the formation of S-shaped structures emitting [O III] and H lines, as well as ultraviolet. These observations show that the circumnuclear ISM of NGC 3393 is a complex multi-phase medium, with several specific implications:
1) The ionization structure is highly stratified with respect to outflow-driven bubbles in the bicone, and varies dramatically on scales of pc.
On -pc-scales () [O III]/H, [S II]/H and keV X-rays trace very different physical regions. A kpc-scale [S II]/H cocoon envelopes the ionization cones, and low-ionization features spanning s of pc are associated with the radio jet boundaries, consistent with jet-gas kinematic interaction and supporting a local role for shocks, given typical [S II]/H on all scales of this ENLR cocoon. These shocks may play a role in local O III excitation and X-ray production via Bremsstrahlung (see, e.g. Dopita & Sutherland 1995; Contini 2012). We also find a small, 100-pc-scale N-S region at the nucleus where [S II]/H is weak relative to its surroundings ( vs. ) and likely associated with very strong ionization from the AGN, either through photoionization or strong jet-gas interactions. The knot of strong X-ray emission associated with the SW radio lobe suggests that the ‘hotspot’ described by Koss et al. (2015) is a site of such strong interactions.
2) High-energy emission from the mid-ultraviolet and X-rays is dominated by the S-shaped arms, with few photons from the nucleus.
Although much of the X-ray emission is associated with the ENLR, as per Bianchi et al. (2006), Levenson et al. (2006) and Koss et al. (2015), we find that the bulk of this emission () arises from narrow sub-arcsecond filaments associated with the brightest emission line features.
3) Few X-ray and mid-ultraviolet photons are observed from the nucleus.
In our deconvolved X-ray images, we see only a modest () contribution from the nuclear point source in the keV band, consistent with previous X-ray spectroscopy establishing the AGN as Compton-thick (Maiolino et al. 1998; Guainazzi et al. 2005; Burlon et al. 2011; Koss et al. 2015). From the MUV, we infer that the IUE emission observed by (Diaz et al. 1988) is not only extended, but is also predominantly cospatial with the S-shaped arms.
4) Multiple observational indicators support a role for shocks from AGN outflows for some parts of the ENLR in close contact with the radio plasma.
This role of shocks is consistent with line ratio mapping, H compression, STIS kinematics from Fischer et al. (2013), and UV imaging. X-rays (such as in the knot coincident with the SW radio lobe) are key to this interpretation since the optical lines are incomplete indicators. Wang et al. (2011c) and Paggi et al. (2012) observe excess Ne IX emission relative to O VII at the leading edges of AGN outflows in NGC 4151 and Mrk 573, consistent with emission from a thermal plasma, so we might expect shocks contributing to the ENLR of NGC 3393 to display similar features when spatially resolved. In Paper III (Maksym et al, in prep), we will investigate the resolved X-ray imaging spectroscopy in detail.
5) Cavities formed by filamentary X-ray and optical line emission appear to extend beyond the radio plasma, possibly indicating an undetected outflow component.
On larger scales, [O III]/H, X-rays and radio from NGC 3393 preferentially occupy cavities of low [S II]/H values. The excellent match between the faintest 8.4 GHz radio contours and [S II]/H cavity boundaries in some regions also supports shock formation, but raises the question of why the whole cavity does not demonstrate radio emission. If jet expansion is the root cause of cavity formation, then we would expect deeper radio observations with the VLA (or with VLBI) to reveal more extended structure within the ENLR. Otherwise, we must invoke a more complicated picture for cavity formation.
6) The origin of the NUV emission is complex, and likely signifies large spatial variations in temperature, ionization parameter, and scattered light contributions on sub-kpc scales.
NUV decomposition similar to Muñoz Marín et al. (2009) shows that although the nuclear stellar component is well-modeled by an old (few Gyr) population, the extended emission is not well-suited to a single ratio between the NUV continuum and [O III]. The complexity is consistent with a bubbles of plasma photoionized from one side, with possible contributions from shocks. Ultraviolet emission line imaging or spatially resolved spectroscopy is necessary to investigate the origins of these effects.
At optical wavebands, IFU observations (such as with MUSE and JWST) would help address the relative roles of photoionization and kinematics in the feedback which we see in NGC 3393. Full kinematic fitting with a wider range of emission lines is necessary to determine the amount of energy deposited into the ENLR via jet interaction, and would greatly improve upon previous work by Cooke et al. (2000), Contini (2012), and Fischer et al. (2013) using sparser spatial sampling. Spectrally resolving lines indicative of density (such as the [S II] doublet) would be particularly useful, as the assumed densities from Cooke et al. (2000) may not be generally applicable. Direct measurement of [N II] would be superior to the assumptions used here, and full spectroscopic measurement would help address the origin of a possible excess in continuum observations of the S-shaped arms. Given the obvious structure on scales of few Hubble pixels, however, additional Hubble narrow-line imaging of He II, [O II] 3727 and [O III] 4363 is necessary to trace the ionizing flux, collisional ionization, and local gas temperatures. And very deep Chandra observations will allow high-fidelity PSF-deconvolved imaging of diagnostic emission lines such as O VII, O VIII and Ne IX, which will allow us to trace the direct impact of shocks at an angular resolution directly comparable to the complexity seen in HST imaging.
References
- Baldwin et al. (1981) Baldwin, J. A., Phillips, M. M., & Terlevich, R. 1981, PASP, 93, 5
- Bardeen & Petterson (1975) Bardeen, J. M., & Petterson, J. A. 1975, ApJ, 195, L65
- Begelman et al. (1980) Begelman, M. C., Blandford, R. D., & Rees, M. J. 1980, Nature, 287, 307
- Bianchi et al. (2006) Bianchi, S., Guainazzi, M., & Chiaberge, M. 2006, A&A, 448, 499
- Braithwaite (2010) Braithwaite, J. 2010, MNRAS, 406, 705
- Burlon et al. (2011) Burlon, D., Ajello, M., Greiner, J., Comastri, A., Merloni, A., & Gehrels, N. 2011, ApJ, 728, 58
- Calzetti et al. (2000) Calzetti, D., Armus, L., Bohlin, R. C., Kinney, A. L., Koornneef, J., & Storchi-Bergmann, T. 2000, ApJ, 533, 682
- Carter et al. (2003) Carter, C., Karovska, M., Jerius, D., Glotfelty, K., & Beikman, S. 2003, in Astronomical Society of the Pacific Conference Series, Vol. 295, Astronomical Data Analysis Software and Systems XII, ed. H. E. Payne, R. I. Jedrzejewski, & R. N. Hook, 477
- Contini (2012) Contini, M. 2012, MNRAS, 425, 1205
- Cooke et al. (2000) Cooke, A. J., Baldwin, J. A., Ferland, G. J., Netzer, H., & Wilson, A. S. 2000, ApJS, 129, 517
- Davies et al. (2015) Davies, R. L., Schirmer, M., & Turner, J. E. H. 2015, MNRAS, 449, 1731
- Davis et al. (2012) Davis, J. E., et al. 2012, in Proc. SPIE, Vol. 8443, Space Telescopes and Instrumentation 2012: Ultraviolet to Gamma Ray, 84431A
- de Vaucouleurs et al. (1991) de Vaucouleurs, G., de Vaucouleurs, A., Corwin, Jr., H. G., Buta, R. J., Paturel, G., & Fouqué, P. 1991, Third Reference Catalogue of Bright Galaxies. Volume I: Explanations and references. Volume II: Data for galaxies between 0h and 12h. Volume III: Data for galaxies between 12h and 24h.
- Diaz et al. (1988) Diaz, A. I., Prieto, M. A., & Wamsteker, W. 1988, A&A, 195, 53
- Dopita & Sutherland (1995) Dopita, M. A., & Sutherland, R. S. 1995, ApJ, 455, 468
- Esch et al. (2004) Esch, D. N., Connors, A., Karovska, M., & van Dyk, D. A. 2004, ApJ, 610, 1213
- Evans & Dopita (1985) Evans, I. N., & Dopita, M. A. 1985, ApJS, 58, 125
- Fabbiano et al. (2011) Fabbiano, G., Wang, J., Elvis, M., & Risaliti, G. 2011, Nature, 477, 431
- Fabian (2012) Fabian, A. C. 2012, ARA&A, 50, 455
- Fender et al. (2004) Fender, R. P., Belloni, T. M., & Gallo, E. 2004, MNRAS, 355, 1105
- Ferland & Mushotzky (1984) Ferland, G. J., & Mushotzky, R. F. 1984, ApJ, 286, 42
- Fischer et al. (2013) Fischer, T. C., Crenshaw, D. M., Kraemer, S. B., & Schmitt, H. R. 2013, ApJS, 209, 1
- Fruscione et al. (2006) Fruscione, A., et al. 2006, in Society of Photo-Optical Instrumentation Engineers (SPIE) Conference Series, Vol. 6270, Society of Photo-Optical Instrumentation Engineers (SPIE) Conference Series, 1
- Gagne et al. (2014) Gagne, J. P., et al. 2014, ApJ, 792, 72
- Goncalves et al. (1998) Goncalves, A. C., Veron, P., & Veron-Cetty, M.-P. 1998, A&A, 333, 877
- Gonzaga & et al. (2012) Gonzaga, S., & et al. 2012, The DrizzlePac Handbook
- Guainazzi et al. (2005) Guainazzi, M., Matt, G., & Perola, G. C. 2005, A&A, 444, 119
- Güver & Özel (2009) Güver, T., & Özel, F. 2009, MNRAS, 400, 2050
- Harris et al. (2004) Harris, D. E., Mossman, A. E., & Walker, R. C. 2004, ApJ, 615, 161
- Heckman & Best (2014) Heckman, T. M., & Best, P. N. 2014, ARA&A, 52, 589
- Jones & De Young (2005) Jones, T. W., & De Young, D. S. 2005, ApJ, 624, 586
- Karovska et al. (2007) Karovska, M., Carilli, C. L., Raymond, J. C., & Mattei, J. A. 2007, ApJ, 661, 1048
- Karovska et al. (2005) Karovska, M., Schlegel, E., Hack, W., Raymond, J. C., & Wood, B. E. 2005, ApJ, 623, L137
- Katz (1997) Katz, J. I. 1997, ApJ, 478, 527
- Keel et al. (2012) Keel, W. C., et al. 2012, MNRAS, 420, 878
- Keel et al. (2015) —. 2015, AJ, 149, 155
- Kewley et al. (2001) Kewley, L. J., Dopita, M. A., Sutherland, R. S., Heisler, C. A., & Trevena, J. 2001, ApJ, 556, 121
- Kewley et al. (2006) Kewley, L. J., Groves, B., Kauffmann, G., & Heckman, T. 2006, MNRAS, 372, 961
- Kondratko et al. (2008) Kondratko, P. T., Greenhill, L. J., & Moran, J. M. 2008, ApJ, 678, 87
- Koss et al. (2015) Koss, M. J., et al. 2015, ApJ, 807, 149
- Kraemer et al. (2008) Kraemer, S. B., Schmitt, H. R., & Crenshaw, D. M. 2008, ApJ, 679, 1128
- Kurosawa & Proga (2008) Kurosawa, R., & Proga, D. 2008, ApJ, 674, 97
- Lee & Lee (2014) Lee, J. H., & Lee, M. G. 2014, ApJ, 786, 130
- Levenson et al. (2006) Levenson, N. A., Heckman, T. M., Krolik, J. H., Weaver, K. A., & Życki, P. T. 2006, ApJ, 648, 111
- Li et al. (2003) Li, J., Kastner, J. H., Prigozhin, G. Y., & Schulz, N. S. 2003, ApJ, 590, 586
- Liu & Chen (2007) Liu, F. K., & Chen, X. 2007, ApJ, 671, 1272
- Lu & Zhou (2005) Lu, J.-F., & Zhou, B.-Y. 2005, ApJ, 635, L17
- Maiolino et al. (1998) Maiolino, R., Salvati, M., Bassani, L., Dadina, M., della Ceca, R., Matt, G., Risaliti, G., & Zamorani, G. 1998, A&A, 338, 781
- Maksym et al. (2016) Maksym, W. P., Fabbiano, G., Elvis, M., Karovska, M., Paggi, A., Raymond, J., Wang, J., & Storchi-Bergmann, T. 2016, ApJ, 829, 46
- Muñoz Marín et al. (2009) Muñoz Marín, V. M., González Delgado, R. M., Schmitt, H. R., Cid Fernandes, R., & Pérez, E. 2009, Ap&SS, 324, 253
- Netzer (2015) Netzer, H. 2015, ARA&A, 53, 365
- Osterbrock & Ferland (2006) Osterbrock, D. E., & Ferland, G. J. 2006, Astrophysics of gaseous nebulae and active galactic nuclei
- Paggi et al. (2012) Paggi, A., Wang, J., Fabbiano, G., Elvis, M., & Karovska, M. 2012, ApJ, 756, 39
- Roos (1988) Roos, N. 1988, ApJ, 334, 95
- Sartori et al. (2016) Sartori, L. F., et al. 2016, MNRAS, 457, 3629
- Storchi-Bergmann et al. (1995) Storchi-Bergmann, T., Kinney, A. L., & Challis, P. 1995, ApJS, 98, 103
- Theureau et al. (1998) Theureau, G., Bottinelli, L., Coudreau-Durand, N., Gouguenheim, L., Hallet, N., Loulergue, M., Paturel, G., & Teerikorpi, P. 1998, A&AS, 130, 333
- Wang et al. (2011a) Wang, J., Fabbiano, G., Elvis, M., Risaliti, G., Mundell, C. G., Karovska, M., & Zezas, A. 2011a, ApJ, 736, 62
- Wang et al. (2011b) Wang, J., et al. 2011b, ApJ, 729, 75
- Wang et al. (2011c) —. 2011c, ApJ, 742, 23
- Zeng (2009) Zeng, J. 2009, PhD thesis, University of Maryland, Baltimore County