Two new high energy -ray blazar candidates
Abstract
We report the detection of two new -ray sources in the Fermi-LAT sky (Pass 8) at energies higher than 20 GeV, and confirmed at lower energies, using a source detection tool based on the Minimum Spanning Tree algorithm. One of these sources, at a Galactic latitude of about °, is a new discovery, while the other was previously reported above 50 GeV in the 2FHL catalogue. We searched for archival multi-wavelength data of possible counterparts and found interesting candidates. Both objects are radio sources and their WISE infrared colours are typical of blazars. While for the former source no optical spectra are available, for the latter a puzzling optical spectrum corresponding to a white dwarf star is found in the 6dF database. We discuss the spectral energy distributions of both sources and possible interpretations.
keywords:
Gamma rays: general – rays: galaxies – Methods: data analysis1 Introduction
The entire -ray sky in the 0.03 to 300 GeV band is continuously observed by the Fermi-Large Area Telescope (LAT) experiment (Atwood et al., 2009) since August 2008. To date, the Fermi collaboration has published three catalogues of sources detected above 100 MeV, the most recent of which (3FGL catalogue, Acero et al., 2015) is based on the first 4 years of data, and two catalogues of high energy sources above 10 GeV (1FHL, Ackermann et al., 2013) and 50 GeV (2FHL, Ackermann et al., 2016), the latter covering a time interval of 80 months. In addition, some specific catalogues for selected classes of objects such as pulsars (Abdo et al., 2013) and Supernova Remnants (Acero et al., 2016) have also been published. The continuous increase of observational data, in addition to the improved new data processing and instrumental response functions (Pass 8) has enriched the quality of the Fermi-LAT -ray sky and has raised its capability to detect new sources.
In a series of papers we successfully applied a tool based on the Minimum Spanning Tree (MST) algorithm (Campana et al., 2008, 2013) to search for photon clusters in the -ray sky at Galactic latitudes higher than 25°, and to associate them with known blazars or candidates within an angular distance of 6′ (Campana et al., 2015; Campana et al., 2016a, b, c). In the present paper we report the detection, with the same MST clustering method, of two new high energy -ray sources found while analyzing the Fermi-LAT Pass 8 sky in regions below the previous Galactic latitude limit. The new sources were first detected applying the MST analysis at energies higher than 20 GeV and then confirmed by similar analysis at lower energies. One of these clusters was found to coincide with the source 2FHL J1944.92144 previously detected above 50 GeV (Ackermann et al., 2016), but never reported at lower energies.
We completed the analysis of these two sources by means of the Fermi Science Tools111http://fermi.gsfc.gov/ssc/data/analysis/software, based on the Maximum Likelihood (ML) method, to obtain count maps, light curves and Test Statistics () values. As a final step, we searched in data archives and in the literature for possible counterparts at lower energies, from the radio to the soft X rays, and discussed their properties to confirm their possible blazar nature, as well as some open issues for one of them.
2 MST detection of -ray clusters
MST is a topometric cluster-finding algorithm that exploits the pattern of “connectedness” of the detected photons, treated as the nodes in a graph, where the edges are the angular distances connecting them. The advantage of MST is the capability to quickly find potential -ray sources by examining only the incoming directions of the photons, regardless of their energy distribution. In the specific application of MST to the -ray sky we defined (and successfully tested on simulated and real fields) various selection parameters, useful to assess the significance of the detected clusters and therefore their possible nature as genuine astrophysical sources (Campana et al., 2008; Massaro et al., 2009; Campana et al., 2013). In particular, we found that the cluster magnitude is a very good indicator of the detection significance; it is defined as , where is the number of photons in a cluster, and is the clustering degree, i.e. the ratio of the mean edge length in the cluster to the mean value in the field. As shown by Campana et al. (2013), in regions with a Galactic latitude high enough to have a rather uniform and not very dense background, values higher than 20 correspond to significance values close to and generally higher than 4 standard deviations. The centroid coordinates, obtained by computing a weighted mean of the photons’ coordinates (see for details Campana et al., 2013), give an indication if a cluster is compatible with a -ray source.
Once detected with the MST algorithm, the clusters can be further analysed with other well recognized statistical methods, such as the maximum likelihood (ML, Mattox et al., 1996), in order to obtain an independent evaluation of their statistical significance and to study the time and energy properties of the corresponding source. In this sense, the MST method has been already applied to obtain lists of seed clusters for the 1FGL and 2FGL Fermi-LAT catalogues (Abdo et al., 2010; Nolan et al., 2012).
In the present work we have considered all the data collected in 7 years by Fermi-LAT, from 2008 August 04 to 2015 August 04, both in a region close to the Galactic equator not distant from the very bright Vela pulsar, and in two intermediate Galactic latitude belts (). Pass 8 data were filtered using the standard LAT Science Tools routines gtselect and gtmktime with standard cuts on the zenith angle and on the rocking angle to limit contamination from the bright Earth limb.
| MST cluster | RA | DEC | Notes | ||||||||
|---|---|---|---|---|---|---|---|---|---|---|---|
| J2000 | J2000 | deg | deg | deg | deg | arcmin | |||||
| MST 07473313 | 116.8212 | 33.1776 | 248.4199 | 4.0029 | 7 | 6.612 | 46.284 | 0.027 | 0.076 | 0.6 | 3FGL J0747.23311 |
| MST 07573728 | 119.3012 | 37.4768 | 253.1631 | 4.4466 | 14 | 2.483 | 34.759 | 0.181 | 0.385 | ||
| MST 09545741 | 136.2318 | 57.6689 | 276.1837 | 7.0924 | 13 | 3.683 | 47.880 | 0.089 | 0.224 | 3.9 | 3FGL J0904.85734 |
| MST 07573728 | 119.2832 | 37.4920 | 253.1687 | 4.4668 | 22 | 3.180 | 69.950 | 0.084 | 0.342 | ||
| MST 07573728 | 119.2893 | 37.5216 | 253.1967 | 4.4779 | 22 | 2.686 | 59.081 | 0.061 | 0.136 |
3 New MST photon clusters
As mentioned before, in our previous works we limited our analysis of the -ray sky at Galactic latitudes to avoid large background inhomogeneities. In a subsequent study we started to extend MST cluster search to regions closer to the Galactic belt, but considering higher selection thresholds to reduce the number of fake detections. Two interesting clusters were found in these searches, and their main properties are described in the following.
3.1 The cluster MST 07573728
We analyzed a region bounded by the Galactic coordinates , in the 20–300 GeV energy range. Adopting a severe selection length (see Campana et al., 2008, 2013, for details) and applying the further threshold we found only three clusters, whose coordinates and MST parameters are given in Table 1. The coordinates of two clusters are very close to those of 3FGL sources within a few arcminutes, while the third one, MST 07573728, has been never reported before. A refined search for this last source in a narrower strip () at energies higher than 10 GeV gave a much more significant detection (see Table 1) with only slight changes of the centroid coordinates but compatible with the previous ones. A further analysis at GeV gave a cluster with 22 photons but again with a highly significant magnitude (last line in Table 1) confirming the robustness of the detection.
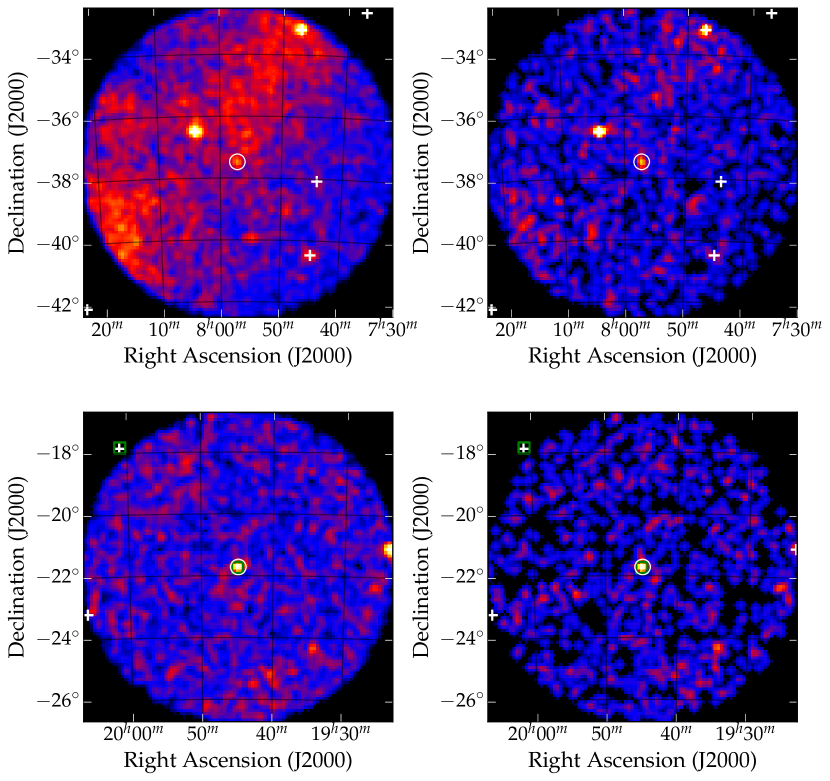
False colour images of the photon density are given in the two upper panels of Figure 1: note how for GeV (right panel) the photon cluster is readily apparent and its size is very similar to those of 3FGL sources, while for GeV (left panel) it is still detectable but the local background is much higher. No correspondence for this cluster was found in the 2nd LAT Pulsar Catalogue (Abdo et al., 2013) and in the LAT Supernova Remnants Catalogue (Acero et al., 2016).
3.2 The cluster MST 19452143
MST analysis was also applied to events in the 10–300 GeV energy range in two belts with Galactic coordinates between and applying, as in the previous case, the threshold . Of the 294 resulting clusters, 231 are in the 3FGL catalogue. Furthermore, after a more robust filtering with in order to reduce the possibility of selecting extended features, the number of new clusters decreased to 23. The one with the highest among them (centroid coordinates and ; ; ) has 20 photons and , much higher than in the other cases and typical of safely confirmed -ray sources. We found that a source at a very close position (19 from the cluster centroid coordinates) was already reported in the more recent 2FHL catalogue as 2FHL J1944.92144, but no analysis on its possible counterparts was presented.
We performed a refined MST analysis in a small sky region wide at different energies and dividing the entire data set into three equal time intervals, each of length 28 months. The results using the two lower energy thresholds GeV and GeV are reported in Table 2, and clearly show that the source was brighter in the last interval (III). During interval I the source is well detected at GeV, while using the GeV data the cluster has a lower significance. In interval II the cluster significance was at the same level of background fluctuations for both values of the lower energy thresholds. There is no doubt that it should also be highly variable and not detectable in the observation periods covered by other Fermi-LAT catalogues.
| Time interval | GeV | GeV |
|---|---|---|
| I | 35.66 | 31.75 |
| II | 23.47 | 8.20 |
| III | 234.10 | 226.22 |
| MST 07573728 | MST 19452143 | |
|---|---|---|
| 51.76 | 185.53 | |
| Flux ( GeV) | ||
| Photon index |
Photon density maps are given in the lower panels of Figure 1: note that for GeV (right panel) the photon cluster is very well apparent and that for GeV (left panel) it remains still detectable despite a higher local background.
4 ML analysis and light curves
We verified the significance of both these clusters by means of the standard Maximum Likelihood (ML) analysis on the entire data set using the Science Tools package. We used the gtselect tool to apply the cuts suggested by the Fermi-LAT collaboration for point-like sources222http://fermi.gsfc.nasa.gov/ssc/data/analysis/LAT_caveats.html to minimize the impact of the systematics and the contamination from non-photon events. The Region of Interest (ROI), with a radius of 10°, was centered at the MST cluster centroid coordinates and the photons were extracted with energies higher than 3 GeV applying the P8SOURCE_V6 event class selection and the corresponding Instrument Response Functions (IRF). In the analysis we considered all the 3FGL sources within the ROI from the cluster centroid, as well as the Galactic and extragalactic diffuse emission. Furthermore, a source with a power-law spectral distribution was assumed at the MST coordinates. The normalization of the 3FGL sources with within the ROI was allowed to vary in the fitting, while the parameters of the sources with were fixed to their catalogue values. The results are reported in Table 3.
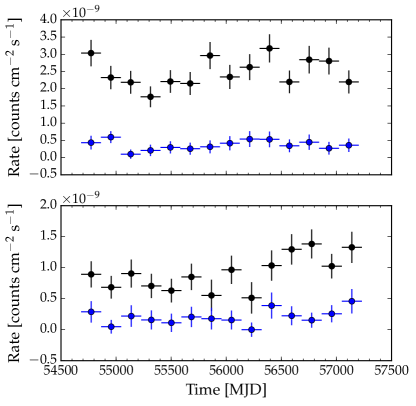
In addition, we performed a simple photometry following the standard Fermi LAT Aperture Photometry procedure333http://fermi.gsfc.gov/ssc/data/analysis/scitools/aperture_photometry.html in order to inspect a possible variability in the long-term light curve (LC) of the source. Figure 2 shows the resulting 6-month binned LC for the entire period (2008 Aug 04 – 2014 Aug 04) in the 3–300 and 10–300 GeV energy bands, obtained selecting events within 1° aperture radius. No model source has been assumed. In agreement with the MST analysis (Table 2), the 2FHL J1944.92144 source was brighter in the last period, while for MST 07573728 a shallow minimum of emission could have occurred around MJD55400.
5 The search for possible counterparts
5.1 The cluster MST 07573728
Considering that the -ray source coordinates above 10 GeV are given with an accuracy of a few arcminutes, we searched for possible counterparts within a cone of radius of 6′ centred at the source position using the ASDC sky explorer tool444http://www.asdc.asi.it/, that allows us to take into account many catalogues.
There are only two NVSS radio sources: one is quite weak (3 mJy) and without high confidence counterparts in other bands. The much more interesting source NVSS J075714372734 has a flux density of 79.2 mJy at 1.4 GHz. In the second epoch Molonglo Galactic Plane Survey (Murphy et al., 2007) at 0.843 GHz the corresponding source is MGPS J075714372737, with a flux density of 99.3 mJy, indicating that its radio spectrum is flat. Moreover, at the rather large angular separation of 18 there is also a PMN source with a flux density of mJy at 4.85 GHz, comparable to the previous data. This, if actually associated with the NVSS source, would confirm the flat spectrum.
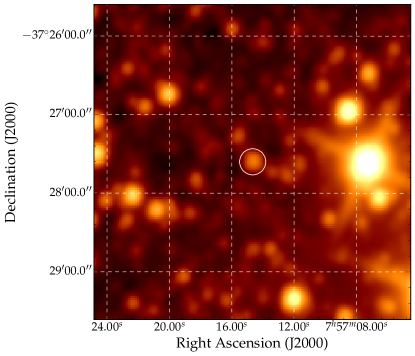
At an angular distance of 21, fully compatible with the NVSS resolution, there is a very faint optical object in the ESO DSS2-red image with very uncertain USNO photometric data. This source, however, is positionally consistent with a brighter mid IR source AllWISE J075714.66-372736.0 in the Wide-field Infrared Survey Explorer555http://wise2.ipac.caltech.edu/docs/release/allsky/ (WISE; Wright et al., 2010), detected in all the four bandpasses with the following magnitudes: mag, mag, mag, mag. The WISE image in the band is given in Figure 3. In the [3.4]-[4.6]-[12] m colour-colour diagram, these IR colours are consistent with those typical of a High-synchrotron-peaked BL Lac (HBL) as described in Massaro et al. (2011) for the TeV BL Lac objects. This source is also included in the WIBRALS catalogue (D’Abrusco et al., 2014) as a class C (candidate) blazar. Optical spectroscopy of this source is not available and therefore we cannot safely establish whether it is a BL Lac object or a FSRQ, nevertheless its blazar nature appears well established and therefore it must be considered as the most interesting candidate for the counterpart of our new source.
5.2 The cluster MST 19452143 / 2FHL J1944.92144
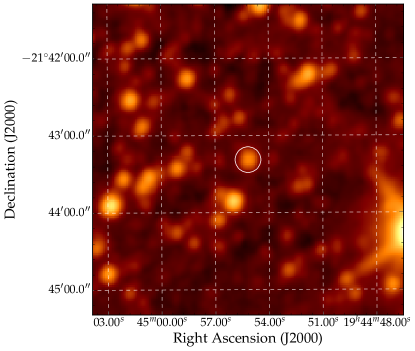
In this case five NVSS sources are found close enough to the cluster position, but the brightest and most interesting is NVSS J194455214320 (Figure 4) with a flux density at 1.4 GHz of 42.1 mJy, likely associated with the close X-ray source 1RXS J194455.3214318. These sources are practically coincident with an optical object with GSC 2.2 magnitudes mag and mag. We found only one other radio measurement of this source in the WISH catalogue (De Breuck et al., 2002), and its flux density at 0.352 GHz is 49 mJy, indicating a flat radio spectrum with a spectral index , corresponding to a SED exponent of : for this reason it was included in the LORCAT catalogue (Massaro et al., 2014b) aimed at the identification of potential counterparts of -ray sources likely associated with blazars.
This source is also positionally well consistent with the IR counterpart AllWISE J194455.16214319.2, detected in all the four bandpasses with the following magnitudes: mag, mag, mag, mag. As for the previous cluster the corresponding point in the [3.4]-[4.6]-[12] m colour-colour diagram is consistent with a High-synchrotron-peaked BL Lac (HBL) as described in Massaro et al. (2011) for the TeV BL Lac objects.
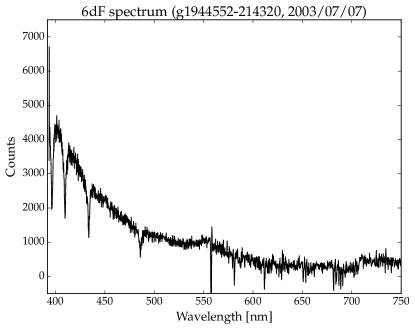
There is a good quality optical spectrum available from the 6dF database (Jones et al., 2009), here reported in Figure 5: surprisingly, it has a clear stellar appearance with well defined Balmer lines with the exception of the H, and it is classified as a DA white dwarf.
5.3 The Spectral Energy Distributions
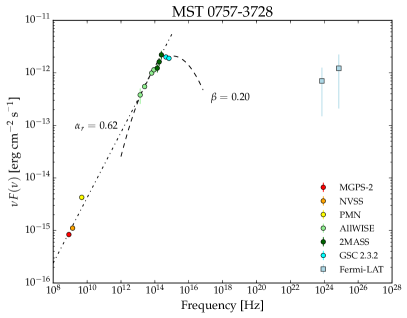
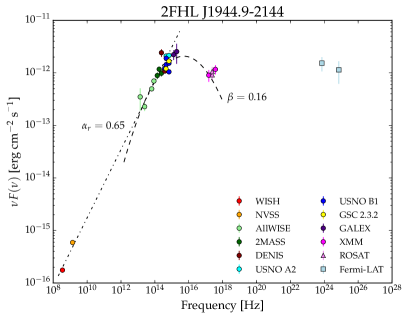
Using the good photometric data available from literature and databases we built the Spectral Energy Distributions (SED) of both -ray sources and their possible counterparts. The resulting plots are presented in the two panels of Figure 6: the two SEDs are remarkably similar to that of a typical HSP source (see, for instance, Giommi et al., 2012). We fitted a log-parabola:
| (1) |
to data from the IR to the UV/X-ray range to estimate the frequency of the synchrotron bump and obtained 1015 Hz and Hz for MST 07573728 and 2FHL J1944.92144, respectively. Also, the curvature parameter resulted equal to 0.16 and 0.20, values frequently found for blazars. In Figure 6 is shown also a linear fit , carried out considering only the radio data up to the frequencies corresponding to the AllWISE filters. For 2FHL J1944.92144 the different slope with respect to the one given by radio data alone is due to the constraint of matching the mid IR data.
6 Summary and discussion
The high energy -ray sky, according to the new scenario derived from Fermi-LAT observations, appears characterised by the presence of several thousands of sources, many of which are variable over different time scales (Massaro et al., 2016). The improvement in the data quality reached with the Pass 8 release and the continuous enrichment due to the extension of the Fermi-LAT sky monitoring make possible the detection of new interesting sources. In the present paper we report the discovery of two -ray sources with high significance: one in a region close to the Galactic equator, and the other having an incongruous possible counterpart.
The time and spectral behaviour of MST 07573728 in the -ray band appear blazar-like and therefore we are confident about the proposed counterpart; we cannot safely establish, however, whether it is a BL Lac object or a FSRQ because of the lack of optical spectroscopy. Radio and -ray spectra are suggestive of a quasar, while the IR WISE colours are those of a HBL source.
The characteristics of the proposed counterpart to 2FHL J1944.92144, and particularly its optical spectrum, are quite unusual. White dwarf DA stars, in fact, are neither known as flat spectrum radio sources nor as -ray emitters. Cross-matching a sample of 14120 DA-type stars from the SDSS DR7 WD catalogue (Kleinman et al., 2013) with the 3FGL catalogue within a 6′ angular distance, resulted in only 25 of them possibly associated with -ray sources: 22 of which with a counterpart in the Roma-BZCAT (5th Edition, Massaro et al., 2014a, 2015) blazar catalogue and the remaining three close to CRATES (Healey et al., 2007) radio sources and therefore likely associated with other blazars not yet optically identified.
The possibility that this object can be considered as a NS-WD binary, as in the case of the recently discovered millisecond pulsar (MSP) PSR J1824+10 in the error box of 3FGL J1824.0+1017 (Cromartie et al., 2016), cannot be excluded. Even the occurrence of a flat radio spectrum below 1 GHz does not rule out this possibility because, although rare, it is observed in a few MSPs (Kondratiev et al., 2016). However, some alternatives must be taken into account: the possibility, although quite rare, that the close angular separation between a blazar and a brighter WD might be due to chance, or the fact that the reported 6dF spectrum does not correspond to the optical object. We asked the 6dF data management to verify that the coordinates of their pointing (, ; M. Read, private communication) were correctly reported, and obtained a confirmation. The only way to disentangle this unusual finding is to perform new and more accurate astrometric and spectroscopic observations of this puzzling object.
Acknowledgements
Part of this work is based on archival data, software or on-line services provided by the ASI Science Data Center (ASDC). We furthermore acknowledge use of archival Fermi-LAT data, of the Final Release 6dFGS archive, and of the SDSS and DSS archives. We are particularly grateful to Mike A. Read of the 6dF team.
References
- Abdo et al. (2010) Abdo A. A., et al., 2010, ApJS, 188, 405
- Abdo et al. (2013) Abdo A. A., et al., 2013, ApJS, 208, 17
- Acero et al. (2015) Acero F., et al., 2015, ApJS, 218, 23
- Acero et al. (2016) Acero F., et al., 2016, ApJS, 224, 8
- Ackermann et al. (2013) Ackermann M., et al., 2013, The Astrophysical Journal Supplement Series, 209, 34
- Ackermann et al. (2016) Ackermann M., et al., 2016, ApJS, 222, 5
- Atwood et al. (2009) Atwood W. B., et al., 2009, ApJ, 697, 1071
- Campana et al. (2008) Campana R., Massaro E., Gasparrini D., Cutini S., Tramacere A., 2008, MNRAS, 383, 1166
- Campana et al. (2013) Campana R., Bernieri E., Massaro E., Tinebra F., Tosti G., 2013, Ap&SS, 347, 169
- Campana et al. (2015) Campana R., Massaro E., Bernieri E., D’Amato Q., 2015, Ap&SS, 360, 19
- Campana et al. (2016a) Campana R., Massaro E., Bernieri E., 2016a, Ap&SS, 361, 183
- Campana et al. (2016b) Campana R., Massaro E., Bernieri E., 2016b, Ap&SS, 361, 185
- Campana et al. (2016c) Campana R., Massaro E., Bernieri E., 2016c, Ap&SS, 361, 367
- Cromartie et al. (2016) Cromartie H. T., et al., 2016, ApJ, 819, 34
- D’Abrusco et al. (2014) D’Abrusco R., Massaro F., Paggi A., Smith H. A., Masetti N., Landoni M., Tosti G., 2014, ApJS, 215, 14
- De Breuck et al. (2002) De Breuck C., Tang Y., de Bruyn A. G., Röttgering H., van Breugel W., 2002, A&A, 394, 59
- Giommi et al. (2012) Giommi P., et al., 2012, A&A, 541, A160
- Healey et al. (2007) Healey S. E., Romani R. W., Taylor G. B., Sadler E. M., Ricci R., Murphy T., Ulvestad J. S., Winn J. N., 2007, ApJS, 171, 61
- Jones et al. (2009) Jones D. H., et al., 2009, MNRAS, 399, 683
- Kleinman et al. (2013) Kleinman S. J., et al., 2013, ApJS, 204, 5
- Kondratiev et al. (2016) Kondratiev V. I., Verbiest J. P. W., Hessels J. W. T., Bilous A. V., Stappers B. W., Kramer M., Keane E. F., et al., 2016, A&A, 585, A128
- Massaro et al. (2009) Massaro E., Tinebra F., Campana R., Tosti G., 2009, preprint,
- Massaro et al. (2011) Massaro F., D’Abrusco R., Ajello M., Grindlay J. E., Smith H. A., 2011, ApJ, 740, L48
- Massaro et al. (2014a) Massaro E., Maselli A., Leto C., et al., 2014a, Multifrequency Catalogue of Blazars, 5th edn. Aracne Editrice, Rome
- Massaro et al. (2014b) Massaro F., Giroletti M., D’Abrusco R., Masetti N., Paggi A., Cowperthwaite P. S., Tosti G., Funk S., 2014b, ApJS, 213, 3
- Massaro et al. (2015) Massaro E., Maselli A., Leto C., Marchegiani P., Perri M., Giommi P., Piranomonte S., 2015, Ap&SS, 357, 75
- Massaro et al. (2016) Massaro F., Thompson D. J., Ferrara E. C., 2016, A&ARv, 24, 2
- Mattox et al. (1996) Mattox J. R., et al., 1996, ApJ, 461, 396
- Murphy et al. (2007) Murphy T., Mauch T., Green A., Hunstead R. W., Piestrzynska B., Kels A. P., Sztajer P., 2007, MNRAS, 382, 382
- Nolan et al. (2012) Nolan P. L., et al., 2012, ApJS, 199, 31
- Wright et al. (2010) Wright E. L., et al., 2010, AJ, 140, 1868