Disintegration of the Aged Open Cluster Berkeley 17
Abstract
We present the analysis of the morphological shape of Berkeley 17, the oldest known open cluster ( Gyr), using a probabilistic star counting of Pan-STARRS point sources, and confirm its core-tail shape, plus an antitail, previously detected with the 2MASS data. The stellar population, as diagnosed by the color-magnitude diagram and theoretical isochrones, shows many massive members in the cluster core, whereas there is a paucity of such members in both tails. This manifests mass segregation in this aged star cluster with the low-mass members being stripped away from the system. It has been claimed that Berkeley 17 is associated with an excessive number of blue straggler candidates. Comparison of nearby reference fields indicates that about half of these may be field contamination.
Subject headings:
methods: data analysis; star clusters: individual (Berkeley 17); stars: blue stragglers1. Introduction
Most, and likely all, stars are formed in a clustered environment out of molecular clouds (Lada & Lada, 2003). Those surviving cloud dispersal and remaining gravitationally bound are seen as open clusters, with tens to thousands of member stars. A cluster of equal-mass stars is dynamically relaxed on a time scale of (Binney & Tremaine, 1987), where is the crossing time for a system with a characteristic size and typical velocity , and is the total number of stars. As a result of energy equipartition among stars of differing mass, more massive stars take on a smaller velocity dispersion and “sink" to the center of the cluster, whereas lower-mass stars occupy a larger volume as their higher velocities carry them farther from the cluster center. One of the consequences of this “mass segregation" process is the lowest-mass members become most vulnerable to be ejected out of the system (e.g., see Mathieu, 1984). This “stellar evaporation", with an -folding time scale (Shu, 1982; Binney & Tremaine, 1987), leads to a continuing decrease of the total mass, and hence the gravitational binding energy, of the cluster. Any external disturbance, such as the tidal force from nearby giant molecular clouds or star clusters, passages through Galactic spiral arms or disks, or shear force by Galactic differential rotation, exacerbates the disintegration of the cluster. A recently dissolved system in the solar neighborhood could be recognized as a “moving group" as the then-members still share systemic kinematics and distances (Zuckerman & Song, 2004). Eventually, the escaped stars supply the disk field population.
Berkeley 17 (RA=05:20:37, DEC=+30:35:12, J2000) was first identified by Setteducati & Weaver (1962). Located near the Galactic anti-center (, ), with a metallicity (Friel et al., 2002), the cluster with an age Gyr is considered among the oldest Galactic open clusters (Krusberg, & Chaboyer, 2006; Salaris et al., 2004; Phelps, 1997; Kaluzny, 1994), rivaling globular clusters. While Bragaglia et al. (2006) found a slightly lower age of 8.5–9 Gyr, these authors did not rule out an older age up to Gyr. For the distance, Kharchenko et al. (2013) found a distance of 1800 pc from the sun, and Kaluzny (1994) placed the cluster beyond the disk, at 4400 pc. In this work, we adopt the distance of 2700 pc from the sun with a reddening as found by Bragaglia et al. (2006) and Phelps (1997). The cluster has a mean proper motion mas yr-1, mas yr-1 (UCAC4; Dias et al., 2014).
Our study aims to investigate how an aged disk cluster like Berkeley 17 survives the disruption processes. Chen, Chen & Shu (2004) applied probabilistic star counting of sources from the Two Micron All Sky Survey (2MASS), an all-sky survey in near-infrared wavelengths (Skrutskie et al., 2006), and inferred an elongated shape for this cluster, containing some 370 members within a mean radius of , with a noticeable tail pointing to the Galactic disk. The angular extent of the tail is comparable to the core of the cluster itself, –, or about 5 pc in projected length given the distance to Berkeley 17. Interestingly, the structural analysis (Chen, Chen & Shu, 2004) also suggested an antitail, suggestive of tidal origin, as opposed to stellar debris trailed in the cluster’s orbital motion.
In this work, we present the analysis of the stellar population in the tails, in comparison to that in the core, in order to diagnose stripping of low-mass member stars from the cluster. Given the distance to the cluster, the proper motion data cannot be used readily to discriminate members against field stars. Thus, we utilized stellar photometric data obtained from the Panoramic Survey Telescope And Rapid Response System (Pan-STARRS; Hodapp et al., 2004; Tonry et al., 2012) for our analysis. Berkeley 17 in many ways resembles a globular cluster. For example, in addition to a relatively poor metallicity, it is known to have a rich population of blue stragglers (Ahumada & Lapasset, 2007), which are stars lying above the main-sequence turn-off in a star cluster’s color-magnitude diagram (CMD). In this work, we diagnose how the previously identified blue stragglers could have been confused with field stars.
In Section 2, we describe the Pan-STARRS data used in our work. Section 3 relates to our analysis of the data to understand the morphology of Berkeley 17 and its mass distribution using field decontaminated CMDs. We also present our analysis of blue straggler candidates in this section. We discuss our results in Section 4.
2. Data Description
The prototype Pan-STARRS (PS1) used a 1.8 meter telescope, located atop Haleakala, Maui, USA (Kaiser et al., 2010), and its 1.4 gigapixel camera (Tonry et al., 2008) to image the sky through a set of five broadband filters, termed (Tonry et al., 2012). The PS1 filters differ from those of the SDSS (Abazajian et al., 2009) in that the filter extends 20 nm redward of for greater sensitivity and lower systematics for photometric redshift estimates, and there is no corresponding filter in SDSS. For the details of the PS1 surveys and latest data products, see Chambers et al. (2016). PS1 provides deeper photometric data than 2MASS but has a saturation limit around mag (Magnier et al., 2013).
For this work, only objects with a clear detection in every PS1 band were included in the analysis. While PS1 had observations at multiple epochs, for the results reported here only the average magnitude in each band was used. The PS1 sample consists of stars within a field of around Berkeley 17, and with photometric uncertainties less than 0.1 mag in both and .
3. Data Analysis
3.1. Cluster Morphology
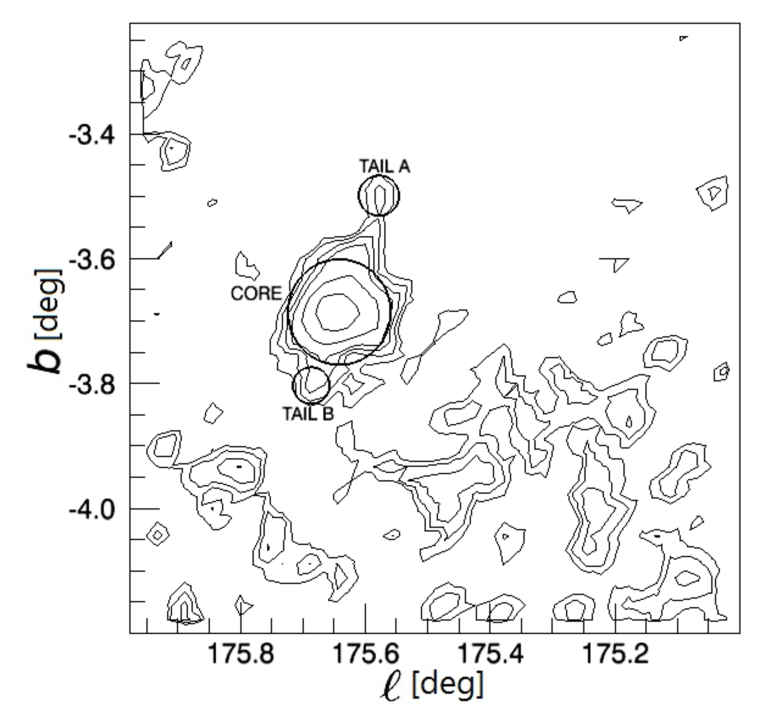
For every PS1 source within our region of analysis, the clustering parameter was computed, prescribed in Chen, Chen & Shu (2004), as , where is the total number of neighbouring stars for star within a specified “neighborhood radius", and is the average number of field stars within the same radius in a field displaced from the cluster yet representative of the field star population. Effectively, is a measure of the spatial probability of a cluster member, being close to unity when the cluster density is high relative to the background density, and nearly null in a background field. The surface number density of stars is then calculated by summation of the clustering parameter of every star in a sky grid. For Berkeley 17, the neighborhood radius was chosen to be , yielding an average with reaching up to 420 in the densest part of the cluster.
It is reassuring that in the analysis using PS1 data, the tail-like structure detected with 2MASS (Chen, Chen & Shu, 2004) was recovered, as seen in Figure 1. The approximate centers of the tails are located, respectively at (hereafter tail A), and (hereafter tail B). We define a radius of for the “core" of the cluster, and a radius of for each of the two tails A and B. Our goal was to compare the stellar properties in the cluster core and in the tails.
3.2. Photometric Completeness
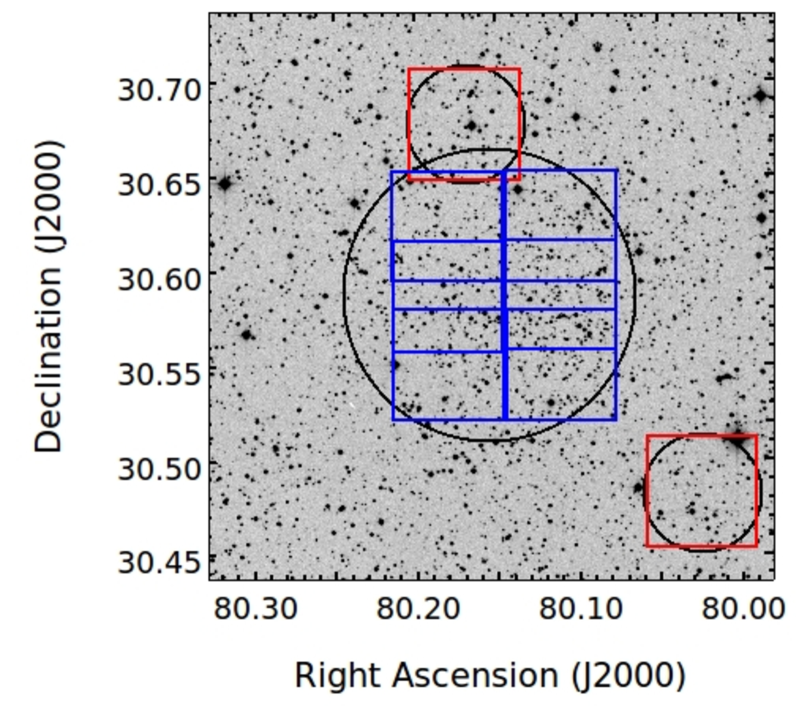
To determine the photometric completeness limits of the data for our region, and to particularly correct for any significant differences in the photometric depth in the core of the cluster with respect to the two tails, we made use of the ADDSTAR task of the Image Reduction and Analysis Facility (IRAF)111http://iraf.noao.edu/. We downloaded band images for the core and the two tails using the PS1 image cutout facility222http://ps1images.stsci.edu/cgi-bin/ps1cutouts. The complete core image was not available in a single cutout. We downloaded eight images, each of box size , six for the core and one image each for the tails. Figure 2 shows the regions of these images as well as the entire core and the two tails as defined in Section 3.1, marked on an DSS red image of Berkeley 17.
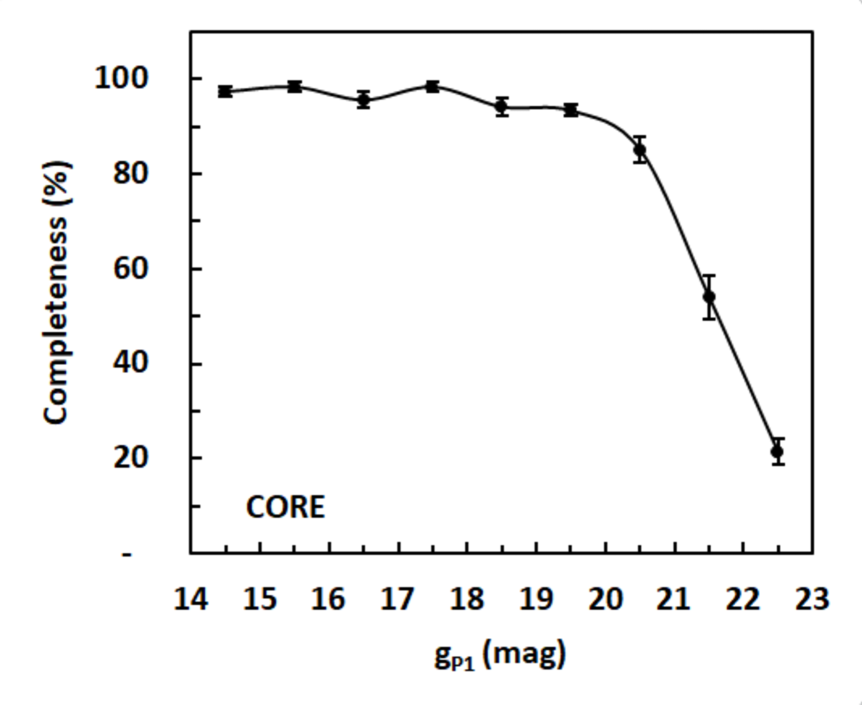
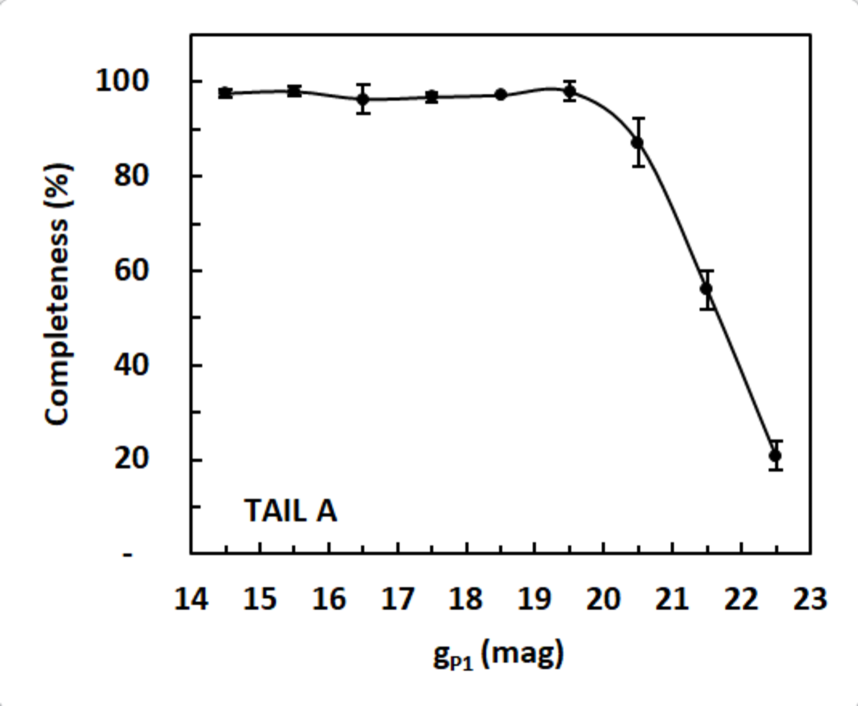
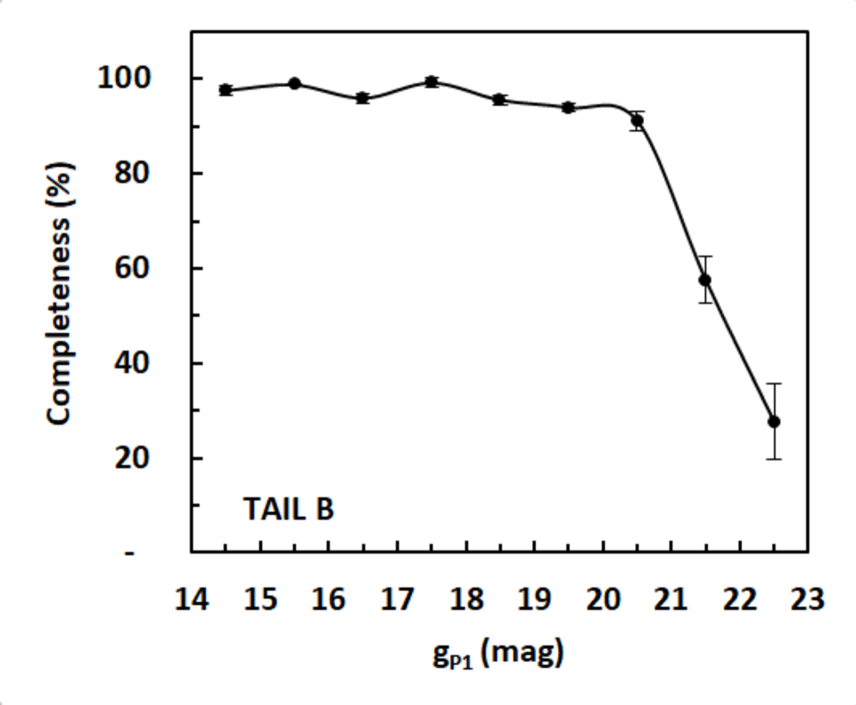
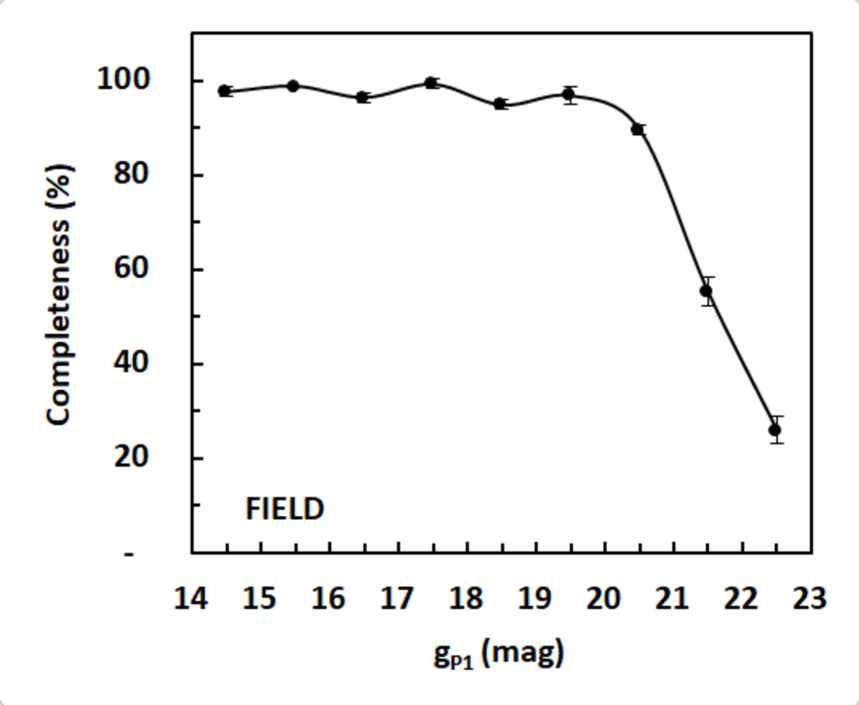
We first performed PSF photometry on all eight images. After that, we used ADDSTAR task to add 50 stars at random locations in the images for a bin size of one magnitude, for the entire range of 14–23 mag. We generated five lists of randomly placed stars for each magnitude bin, and added those stars to create five new sets of images for each of the eight images. We then performed photometry on each ADDSTAR generated image, with the same procedure to process the original observed images, to determine the retrieval rate for fake stars. The mean of the five individual retrieval rates for a given magnitude bin was computed to determine the completeness in the given magnitude bin. We thus determined completeness curves for each of our eight images. For the core, we found no significant variation of completeness within the six subregions. We adopted the mean value of the completeness for each magnitude bin of the six subregions of the core as the completeness of the core. The resultant completeness curves in the band for the core and the two tails are shown in Figure 3. The completeness for the core, tail A and tail B, is , and respectively, in the 20–21 mag bin and is , and respectively, in the 21–22 mag bin. The core is marginally less complete photometrically because of a higher stellar density, but the completeness limits in the core and in the two tails are comparable. Figure 3 also shows the completeness curve for the field used for decontamination (details in Section 3.3), which is also found to be comparable to that of the cluster regions.


3.3. Field Decontamination
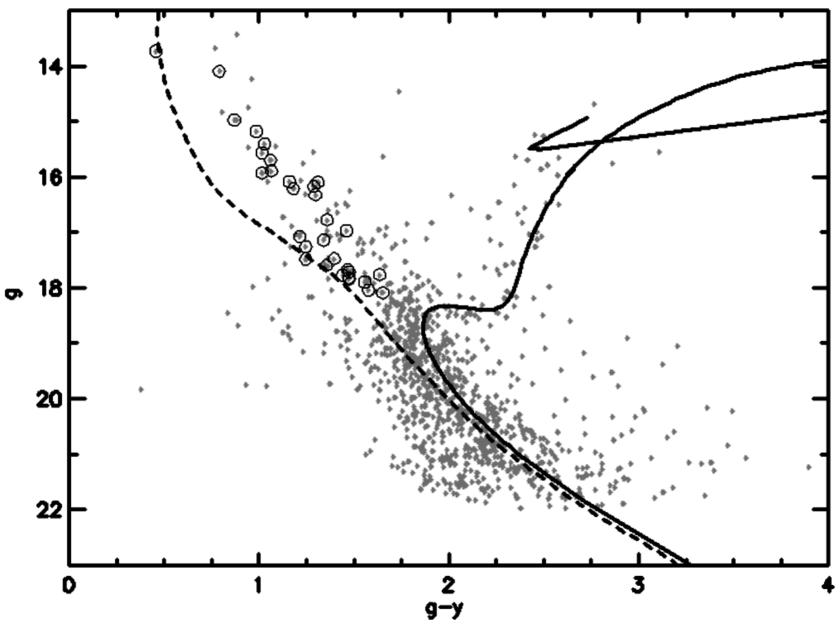
To estimate field star contamination, we exercised a statistical “cleaning" of the CMDs. A reference field, having the same Galactic latitude as Berkeley 17 and the same sky area as the cluster core, but located away in longitude, was chosen. For every star found in the field CMD (Figure 4), the star in the target CMD nearest to the field star would be eliminated if it was present within a box of size 0.56 mag in and 0.8 mag in centered on the field star. This ensured that each target star with a field counterpart would be eliminated, resulting in a cleaned CMD. The selection of the box size was somewhat subjective. It was chosen to account for the photometric uncertainties, and considered as the most suitable after trying either smaller ones, which proved ineffective in removing a sufficient number of field stars, or larger ones, which over-cleaned possible cluster members. Completeness was neglected during the field decontamination since any incompleteness is the same between the cluster and the field, as evident from Figure 3.
The effectiveness of our field decontamination procedure, and the random nature of the reference field, were affirmed by using another “check field", also having the same Galactic latitude and sky area as the cluster core, to clean the reference field. The result, depicted in Figure 4, was considered satisfactory as it is uncorrelated to the isochrone for Berkeley 17. Therefore, the reference field was subsequently used to clean the core CMD. The CMDs for the tails were cleaned by the same manner, except with the reference field scaled down appropriately to the sky area of the tails.
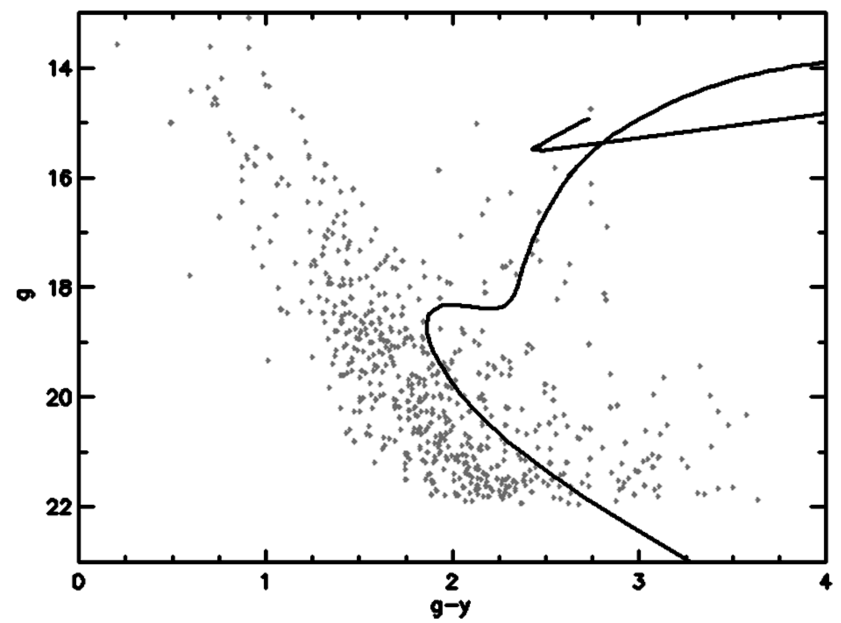
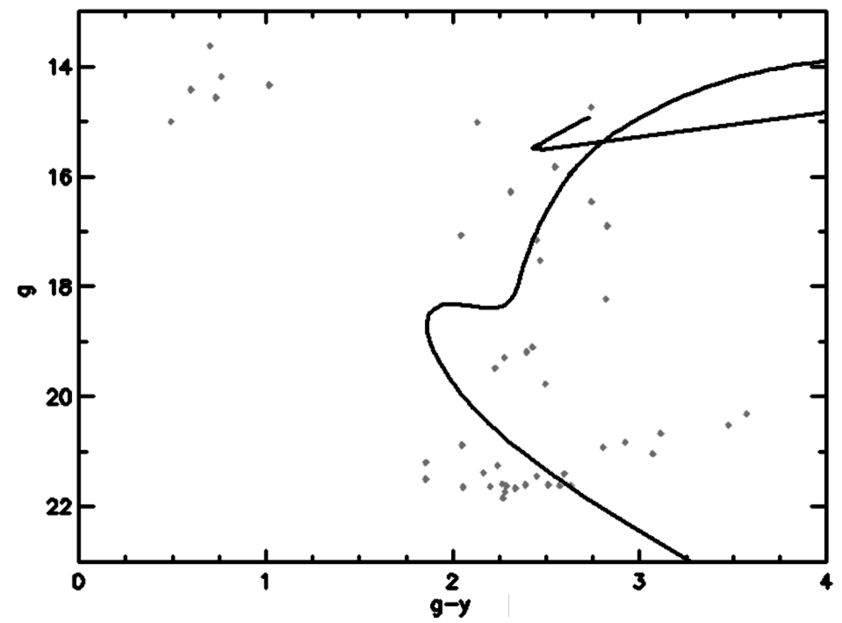
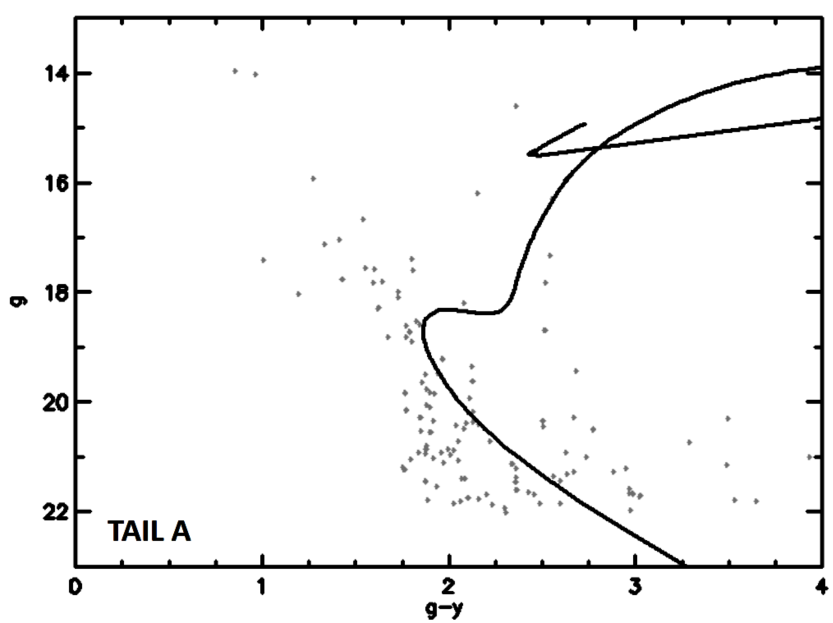
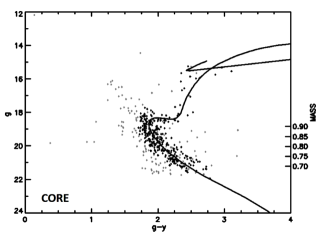
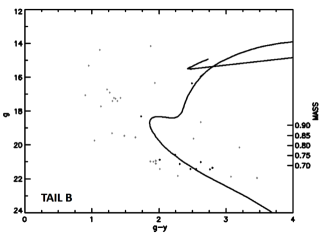
Figure 5 exhibits the observed CMDs for the core and the two tails, while the corresponding cleaned CMDs are shown in Figure 6. Stellar masses were inferred from the absolute magnitude, with a 10 Gyr PARSEC stellar evolution isochrone (Bressan et al., 2012; Chen et al., 2014) for the PS1 filters, a distance of 2.7 kpc, and metallicity of 0.007 ( ). The extinction values in the and bands were taken from those presented by Schlafly & Finkbeiner (2011), which are based on the reddening law from Fitzpatrick (1999), assuming a nominal total-to-selective extinction . A reddening was found to have a marginally better isochrone fit to the main sequence than the alternative value of (Bragaglia et al., 2006; Phelps, 1997), but this had little effect on the mass estimation.
3.4. Mass Distribution
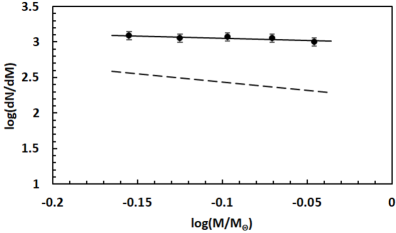
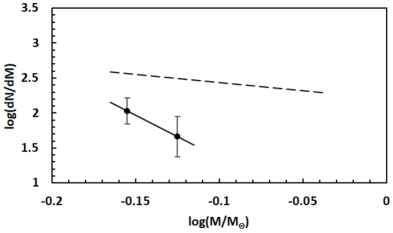
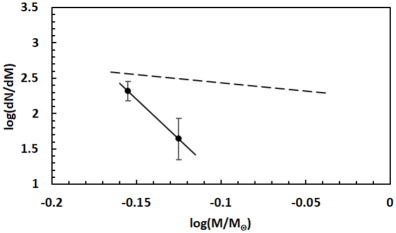
We note that a cleaned CMD is a statistical representation of the cluster, so can be used to estimate the mass function, but the membership of individual stars is not available. For our analysis, we only included stars with magnitudes below the turn off (no giants because the mass is uncertain) and within 0.14 mag in color of the isochrone (CMDs in Figure 6). This leads to a stellar mass range 0.675–0.925 M☉, with the lower limit corresponding to mag. To determine the mass function, the number of members in each mass bin must be corrected for completeness as discussed in the Section 3.2. The mass functions of the core, and of both tails are presented in Figure 6.
Even though our sample covers a relatively small mass range (0.25 M☉), the mass distribution in the core shows a paucity of lower-mass stars. The result should not be due to observational bias, as photometric completeness has been taken into account, and is hence statistically significant even within the Poisson uncertainty, given a sufficient number of stars in each mass bin. The slope of the mass function for the cluster core (Figure 6), using the relation , where represents the number of stars in a mass bin with central mass , is . This slope has an opposite sign in comparison to that of 1.35 derived by Salpeter (1955) for field stars in the solar neighborhood. In contrast, the tails, albeit with a small sample in either case, consist exclusively of low-mass stars. Any observational bias, if present, would have been in favor of detection of high-mass stars. Tail A has a steep mass function slope of while that of Tail B is even steeper at , though the values are highly uncertain because of the small size of the sample. Thus, the stellar population in the tails is clearly different from that in the cluster core.
3.5. Blue Straggler Candidates
Blue stragglers have been studied in some open clusters for spectroscopic analysis (Andrievsky, 1998, NGC 2632), in contact binaries (Rucinski, Kaluzny & Hilditch, 1996, NGC 6791) or for variability (Kaluzny, Mazur, & Krzeminski, 1993, Berkeley 39). Some old open clusters, like globular clusters, are known to be rich in blue stragglers. Berkeley 17 was claimed to host some 31 blue straggler candidates (Ahumada & Lapasset, 2007) using the photometric data obtained by Phelps (1997). We investigated these candidates with the same PS1 data used for the morphological study presented above. The equatorial coordinates of the candidates in Ahumada & Lapasset (2007) were made available from Bragaglia et al. (2006) using WEBDA333https://www.univie.ac.at/webda, and the PS1 counterparts were identified within , as presented in Chen et al. (2017). All of these candidates were found within our core region and their positions in the CMD are indicated in Figure 5. The aforementioned statistical cleaning resulted in the removal of 17 candidates, indicating about half of the candidates should likely be field contamination. Reliable proper motion and radial velocity measurements are needed to ascertain, or at least to exclude, their membership.
4. Discussion
The metallicity of Berkeley 17, , is typical given its galactocentric distance kpc (Carraro et al., 2007) in the outer disk, where external perturbation is expected to be low. Still, the longevity of such an old open cluster remains puzzling. The size of the core, pc, is within the ballpark figure for old clusters (Janes & Phelps, 1994). While older open clusters typically have larger scale heights from the Galactic plane, Berkeley 17 is close to the disk, with pc.
The cause of the core-tail morphology of Berkeley 17 is unclear. With an antitail, it is likely of a tidal origin. Combining the member samples in the core and in the tails, more massive stars outnumber the less massive ones, thus indicating a dynamically evolved state. A flat mass function, in comparison to that of the solar neighborhood, found for Berkeley 17 (see Figure 6) is not uncommon in old clusters (for relevant references see Friel, 1995), as low-mass then-members have been stripped. Our analysis did not include the post-main sequence population, but given members in the 0.675–0.925 M☉ range, the original cluster should have been as massive as a super star cluster, commonly thought as the precursor of a globular cluster (Gallagher & Grebel, 2002).
One possible tidal source is the Perseus arm, known to be located at 1.95 kpc from the sun (Xu et al., 2006). Kaluzny (1994) attributed a distinct foreground field population toward Berkeley 17 to belong to the Perseus arm. Indeed, such a foreground distribution also shows up in our observed CMDs, both for the cluster and for the field (see Figures 4 and 5). A sample of newly found star clusters toward the Galactic anticenter (Lin et al. in preparation) using PS1 data led to an estimated full-width-half-maximum of kpc for the Perseus arm. Berkeley 17 is immediately behind so potentially vulnerable to the tidal pull by the arm. One clue for the scenario is the unusual radial velocity for Berkeley 17, km s-1, indicating a large space velocity (Hayes & Friel, 2014).
The cleaned CMDs unequivocally show members above the main sequence turnoff. As presented above, roughly half of the blue straggler candidates (Ahumada & Lapasset, 2007) should be false positives. Some globular clusters (e.g. NGC 3201; Bono et al., 2010) have been seen to exhibit a prominent horizontal branch extending to the blue. The blue horizontal-branch stars have nearly constant brightness and so may serve as standard candles to constrain Galactic kinematics (Sirko et al., 2004). The blue horizontal branch may be related (Sandage & Wallerstein, 1960) to, but cannot be entirely accounted for (Sandage & Wildey, 1967; van den Bergh, 1967), by metallicity. Other factors like stellar age and helium abundance have been proposed (Gratton et al., 2013; Villanova et al., 2012). In a CMD, some blue horizontal-branch stars overlap and thus may be confused with blue stragglers. Berkeley 17 is seen to have an extended horizontal branch (Chen et al., 2017). It is reasonable to speculate therefore that some of the blue straggler candidates may be blue horizontal-branch stars. Spectroscopic classification is required to clarify the nature of these blue stragglers versus blue horizontal-branch stars or field stars.
References
- Abazajian et al. (2009) Abazajian, K. N., Adelman-McCarthy, J. K., Agüeros, M. A., et al., 2009, ApJS, 182, 543
- Andrievsky (1998) Andrievsky, S. M., 1998, A&A, 334, 139
- Ahumada & Lapasset (2007) Ahumada, J. A., & Lapasset, E., 2007, A&A, 463, 789
- Binney & Tremaine (1987) Binney, J., & Tremaine, S., 1987, Galactic Dynamics, Princeton University Press
- Bono et al. (2010) Bono, G., Stetson, P. B., VandenBerg, D. A., et al., 2010, ApJ, 708, L74
- Bragaglia et al. (2006) Bragaglia, A., Tosi, M., Andreuzzi, G., & Marconi, G., 2006, MNRAS, 368, 1971
- Bressan et al. (2012) Bressan, A., Marigo, P., Girardi, L., et al., 2012, MNRAS, 427, 127
- Carraro et al. (2007) Carraro, G., Geisler, D., Villanova, S., et al., 2007, A&A, 476, 217
- Chambers et al. (2016) Chambers, K. C., Magnier, E. A., Metcalfe, N., et al., 2016, ArXiv e-prints, arXiv:1612.05560
- Chen et al. (2014) Chen, Y., Girardi, L., Bressan, A., et al., 2014, MNRAS, 444, 2525
- Chen, Chen & Shu (2004) Chen, W. P., Chen, C. W., & Shu, C. G., 2004, AJ, 128, 2306
- Chen et al. (2017) Chen, W. P., et al., 2017, Journal of Physics: Conference Series, 869, 012093
- Dias et al. (2014) Dias, W. S., et al., 2014, A&A, 564, A79
- Fitzpatrick (1999) Fitzpatrick, E. L., 1999, PASP, 111, 63
- Friel (1995) Friel, E. D., 1995, ARA&A, 33, 381
- Friel et al. (2002) Friel, E. D., Janes, K. A., Tavarez, M., et al., 2002, AJ, 124, 2693
- Gallagher & Grebel (2002) Gallagher, J. S., & Grebel, E. K., 2002, in IAU Symp. 207, Extragalactic Star Clusters, ed. D. Geisler, E. K. Grebel, & D. Minniti (San Francisco, CA:ASP), 745
- Gratton et al. (2013) Gratton, R. G., Lucatello, S., Sollima, A., et al., 2013, A&A, 549, A41
- Hayes & Friel (2014) Hayes, C. R., & Friel, E. D. 2014, AJ, 147, 69
- Hodapp et al. (2004) Hodapp, K. W., Siegmund,W. A., Kaiser, N., et al., 2004, Proc. SPIE, 5489, 667
- Janes & Phelps (1994) Janes, K. A., & Phelps, R. L. 1994, AJ, 108, 1773
- Kaiser et al. (2010) Kaiser, N., Burgett, W., Chambers, K., et al., 2010, Proc. SPIE, 7733, 77330E
- Kaluzny, Mazur, & Krzeminski (1993) Kaluzny, J., Mazur, B., & Krzeminski, W., 1993, MNRAS, 262, 49
- Kaluzny (1994) Kaluzny, J., 1994, Acta Astron., 247, 256
- Kharchenko et al. (2013) Kharchenko, N. V., Piskunov, A. E., Schilbach, E., et al., 2013, A&A, 558, A53
- Krusberg, & Chaboyer (2006) Krusberg, Z. A. C., & Chaboyer, B., 2006, AJ, 131, 1565
- Lada & Lada (2003) Lada, C. J., & Lada, E. A., 2003, ARA&A, 41, 57
- Magnier et al. (2013) Magnier, E. A., Schlafly, E., Finkbeiner, D., et al., 2013, ApJS, 205, 20
- Mathieu (1984) Mathieu, R. D. 1984, ApJ, 284, 643
- Phelps, Janes, & Montgometry (1994) Phelps, R. L., Janes, K. A., & Montgomery, K. A., 1994, AJ, 107, 107
- Phelps (1997) Phelps, R. L., 1997, ApJ, 483, 826
- Rucinski, Kaluzny & Hilditch (1996) Rucinski, S. M., Kaluzny, J., & Hilditch, R. W., 1996, MNRAS, 282, 705
- Salaris et al. (2004) Salaris, M., Weiss, A., & Percival, S. M., 2004, A&A, 414, 163
- Salpeter (1955) Salpeter, E. E., 1955, AJ, 121, 161
- Samal et al. (2015) Samal, M. R., Ojha, D. K., Jose, J., et al., 2015, A&A, 581, A5
- Sandage & Wallerstein (1960) Sandage, A., & Wallerstein, G., 1960, ApJ, 131, 598
- Sandage & Wildey (1967) Sandage, A., & Wildey, R., 1967, ApJ, 150, 469
- Schlafly & Finkbeiner (2011) Schlafly, E. F., & Finkbeiner, D. P., 2011, A&A, 414, 163
- Setteducati & Weaver (1962) Setteducati, A. F., & Weaver, M. F., 1962, Newly Found Stellar Clusters. Radio Astr. Lab. Univ. of California, Berkeley
- Shu (1982) Shu, F. H., 1982, The Physical Universe, University Science Books
- Sirko et al. (2004) Sirko, E., et al., 2004, AJ, 127, 899
- Skrutskie et al. (2006) Skrutskie, M. F., Cutri, R. M., Stiening, R., et al., 2006, AJ, 131, 1163
- Tonry et al. (2012) Tonry, J. L., Stubbs, C. W., Lykke, K. R., et al., 2012, ApJ, 750, 99
- Tonry et al. (2008) Tonry, J. L., Burke, B. E., Isani, S., et al., 2008, Proc. SPIE, 7021, 702105
- van den Bergh (1967) van den Bergh, S., 1967, AJ, 72, 70
- Villanova et al. (2012) Villanova, S., Geisler, D., Piotto, G., & Gratton, R. G., 2012, ApJ, 748, 62
- Xu et al. (2006) Xu, Y., Reid, M. J., Zheng, X. W., & Menten, K. M., 2006, Science, 5757, 54
- Zacharias et al. (2015) Zacharias, N., Finch, C., Subasavage, J., et al., 2015, AJ, 150, 101
- Zuckerman & Song (2004) Zuckerman, B., & Song, I., 2004, ARA&A, 42, 685