Radio-interferometric monitoring of FRB 131104:
A coincident AGN flare, but no evidence for a cosmic fireball
Abstract
The localization of fast radio bursts (FRBs) has been hindered by the poor angular resolution of the detection observations and inconclusive identification of transient or variable counterparts. Recently a -ray pulse of s duration has been associated with the fast radio burst FRB 131104. We report on radio-continuum imaging observations of the original localization region of the FRB, beginning three days after the event and comprising 25 epochs over 2.5 yr. Besides probabilistic arguments that suggest that the association between the -ray transient and the FRB is not compelling, we provide upper limits on a putative radio afterglow of this transient that are at odds with standard models for its progenitor. We further report the discovery of an unusual variable radio source spatially and temporally coincident with FRB 131104, but not spatially coincident with the -ray event. The radio variable flares by a factor of above its long term average within d of the FRB at 7.5 GHz, with a factor-of- increase at GHz. Within our observations, the variable has persisted with only modest modulation and never approached the flux density observed in the days after the FRB. We identify an optical counterpart to the variable. Optical and infrared photometry, and deep optical spectroscopy, suggest that the object is a narrow-line radio AGN.
1 Introduction
Fast radio bursts (FRBs) represent a new phenomenological class of astrophysical transient. They are bright (Jy peak flux density) pulses of radio emission that show the effects of propagating though large column densities of plasma: dispersion through ionized plasma, multipath propagation due to inhomogeneities in the plasma Lorimer et al. (2007); Thornton et al. (2013), and Faraday rotation due to magnetization of the plasma Masui et al. (2015). The column densities exceed predictions for the Galaxy, suggesting that the FRBs are extragalactic and possibly cosmological in origin Ravi et al. (2016). They have hitherto only been detected using single-dish telescopes, which have poor angular resolution. Only one FRB has been found to repeat Spitler et al. (2016), greatly enhancing prospects for its localization in follow-up observations. For the remaning FRBs, which have not repeated, attempts at localization have relied on detecting counterpart multi-wavelength transients that might be expected if the FRBs arise from cataclysmic explosions or outbursts. A claimed association of FRB 150418 with a centimeter-wavelength afterglow and host galaxy Keane et al. (2016) has been disputed and instead attributed to common AGN variability, either intrinsic Williams & Berger (2016); Vedantham et al. (2016a), or caused by Milky Way scintillation (Akiyama & Johnson 2016; Johnston et al. 2016). With so little detail on the locations of FRBs, theories for their production and sources are understandably varied, ranging from ultabright pulses from pulsars (Cordes & Wasserman 2016), to cosmic strings (Cai et al. 2012).
We detected FRB 131104 Ravi et al. (2015) with the 64-m Parkes radio telescope in the direction of the Carina dwarf spheroidal galaxy (Car dSph), kpc distant from Earth. The FRB has an electron column density, measured in units of dispersion measure (DM), of pc cm-3 and shows evidence for temporal broadening associated with multipath propagation. Despite its detection in a targeted observation of the Car dSph, we have no evidence to associate the FRB with that galaxy. The FRB has not repeated in hr of follow-up observations at Parkes.
A -ray transient, Swift J0644.55111, has recently been associated with the FRB at the to confidence level DeLaunay et al. (2016). The emission was detected in an off-axis position with the Swift satellite’s Burst Alert Telescope (BAT; Barthelmy et al. 2005), coincident with the FRB in position and time. The transient duration was s, with an inferred energy output of erg. DeLaunay et al. (2016) suggested that the -ray emission (assumed to be associated with this FRB) was generated by shocked relativistic plasma in a cosmological explosion, or in an accretion episode associated with a supermassive black hole. We discuss the claimed association between Swift J0644.55111 and FRB 131104 in Section 2, addressing specifically the mismatch (noted by DeLaunay et al.) between the low rate of such transients observed by Swift/BAT and the high FRB all-sky rate.
Here we report on a centimeter-wavelength radio monitoring campaign of the Parkes localization region of FRB 131104, and the discovery of an unusual, variable radio source (AT J0642.95118) that flares coincident in time and location with FRB 131104. AT J0642.95118 is not coincident with Swift J0644.55111; indeed, our observations exclude any bright radio afterglow of Swift J0644.55111. In Section 3, we present radio observations of the field and the light curve of AT J0642.95118. In Section 4, we present an optical characterization of AT J0642.95118. We discuss the implications of our observations in Section 5, and conclude the paper in Section 6.
2 The -ray transient coincident with FRB 131104
Swift J0644.55111 was discovered within the 15′ diameter half-power circle of the beam (#5) of the Parkes 21-cm multibeam receiver in which FRB 131104 was detected, 6.2′ from the beam center. Its position at the edge of the BAT field of view, illuminating only 2.9% of detectors, resulted in a detection in the image plane despite its high fluence of erg cm-2. Assuming a distance of 3.2 Gpc for FRB 131104 based on comparing its extragalactic DM with models for the ionized content of the Universe, the isotropic energy output of Swift J0644.55111 was erg, with a duration of s. This is somewhat longer, and somewhat less energetic than most long-duration gamma-ray bursts (GRBs) detected by Swift Gehrels et al. (2009), but is inconsistent with other GRB subtypes (e.g., ultra-long GRBs). Murase et al. (2016) consider it likely that, largely independent of the source model, a radio afterglow would have been present. We constrain such an afterglow in Section 5.2 using our observations.
DeLaunay et al. (2016) estimate a significance for the association between FRB 131104 and Swift J0644.55111 of between and , based on the estimated false positive rate in a large collation of BAT archival data. This corresponds to an odds ratio of between 600:1 and 1800:1. Following an argument made by Vedantham et al. (2016a), we compare this odds ratio with the expected number of FRBs that exhibit similar counterparts, which we can estimate by comparing the detection rate of events such as Swift J0644.55111 with the FRB rate.
There is an inconsistency between the inferred all-sky -ray pulse rate and the FRB rate, as noted by DeLaunay et al. (2016), that also calls into question the association. If Swift J0644.55111 had occurred in the region of the BAT field of view with coding, it would have resulted in an image-based burst trigger. DeLaunay et al. (2016) estimate that the rate of long-duration image-triggered events, presumably similar to Swift J0644.55111, is 25 yr-1. We make the conservative assumption that these events all have FRB counterparts, regardless of their fluence or classification. The 100% coding region of BAT is deg2 Barthelmy et al. (2005), which we (conservatively) equate with the coding region. In this region, we predict that BAT should have been sensitive to the counterparts of between and FRBs in a year. We calculate this using the fluence-complete FRB rate of 2500 sky-1 day-1 events with fluences Jy ms Keane & Petroff (2015), and assume both that the FRB source counts are consistent with a Euclidean universe, and that Swift obtains a observing duty cycle. Thus, the odds ratio of DeLaunay et al. (2016) observing their counterpart is the ratio of the -ray event rate to the radio event rate. This places the odds ratio at between approximately 350:1 and 700:1.
Therefore, the odds ratio of FRB 131104 having a -ray counterpart (based on the disparity of the -ray pulse and FRB rates), and the odds ratio of Swift J0644.55111 being associated with FRB 131104 (the calculation presented in DeLaunay et al. 2016), are comparable. This demonstrates that a true association is not significantly more likely than the probability of an unassociated occurrence. This issue was qualitatively acknowledged by DeLaunay et al. (2016). To reconcile the event rates would require FRB 131104 to be of a fundamentally different, much rarer class than the other FRBs.
Furthermore, the false alarm probabilities of such unassociated occurrences given by DeLaunay et al. (2016) are likely underestimated. The calculations relied on estimating the background rate of image-plane detections, when lower-significance detections may still have exceeded their final false-alarm probability threshold of . Their background rate was also only calculated for events with 200 s to 400 s durations, whereas they may still have claimed a counterpart discovery with either a shorter or longer event coincident with FRB 131104. The false alarm rate for all the possible associations that DeLaunay et al. (2016) could have claimed is hence likely higher than was estimated.
3 Radio-interferometric Observations
 |
 |
We commenced monitoring the field of FRB 131104 with the Australia Telescope Compact Array (ATCA) d after the FRB was detected at Parkes. Our observations were conducted over 25 epochs spanning 2.5 yr. Visibilities were computed using the Compact Array Broadband Backend Wilson et al. (2011) over two GHz width tuneable bands, centered at and GHz. A -pointing mosaic was necessary to cover to twice the half-power beam point of Parkes observations (which is the first null in the primary beam) at the highest frequency of the ATCA observations. This was especially crucial because of the possibility of a population of ultrabright FRBs that could be detected in the outer main beam or sidelobe of the telescope Vedantham et al. (2016b).
Observations were conducted in a variety of array configurations, with maximum baseline lengths varying between m and km. Usually antennas were available, but some observations were conducted with antennas (particularly in the lower resolution arrays where inclusion of a sixth very distant antenna complicates imaging), and one with . The lower spatial resolution observations suffered from higher noise, but other problems such as source confusion were not a problem because the field is relatively sparse. Data were bandpass calibrated using observations of either PKS 0823500 or PKS 1934638, and flux calibrated using the latter. Phase calibration was conducted with regular observations of the unresolved radio galaxy J06255438. Data were reduced using the miriad data reduction package Sault et al. (1995). The visibilities for each pointing were imaged and deconvolved independently (using multi-frequency synthesis and cleaning) and then combined to form a composite image. Noise levels were typically Jy beam-1 in the mosaicked observations. We investigated the role of self calibration (both phase-only and amplitude-and-phase self calibration) on our flux-density measurements. We found that while self calibration improved image fidelity it did not significantly alter flux-density measurements111Johnston et al. (2016) noted a downward bias in flux-density measurements in mosaicked data sets. We found that this was mitigated by imaging with the source of interest at the reference pixel of the image..
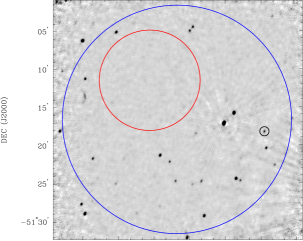
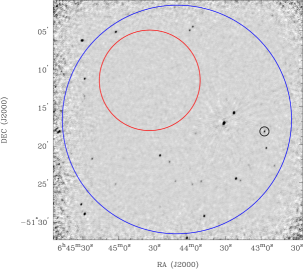
Figure 1 shows composite images formed from the GHz (top) and GHz (bottom) observations of the field. The rms noise levels in the two images are, respectively, and Jy beam-1. The width of the primary beam of Parkes, to the first null, is shown as the blue circle. The 90% containment region for Swift J0644.55111 is shown as the red circle. There are no sources within this region in either the mosaics of all our data shown in Figure 1 or in individual epochs, allowing us to place limits on persistent sources at GHz and GHz of and Jy respectively.
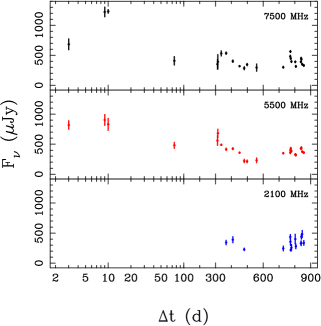
Within the field of view, we have identified a strongly variable source, which we refer to as AT J0642.95118. The location of the source on the sky is (J2000) . The light curve for the source is presented in Figure 2. In the week after the occurrence of FRB 131104, the source brightens by a factor of , exceeding Jy in the 7.5 GHz band. During the brightening, the spectrum also inverts. Other sources in the field do not show this level of variability, suggesting that mis-calibration has not introduced the flux variation.
After identifying AT J0642.95118, we conducted more sensitive single-pointing observations at , , and GHz. Observation and data reduction in the 2.1 GHz band followed the same procedures as in the mosaicked observations. In the GHz band, the major differences were that only GHz of bandwidth was available, and phase calibration used the radio galaxy PKS 0647475. For these targeted observations, image rms noise was typically Jy beam-1 in the GHz band, and Jy beam-1 in the higher-frequency images.
There was a modest re-brightening of AT J0642.95118 approximately d after the initial flare. After the initial flare the flux density at GHz has a mean value of Jy and an rms value of Jy, suggesting that the mJy event is a event temporally coincident with the FRB; at GHz the mean flux density has been Jy with an rms value Jy after the flare. The modulation index in the GHz ( GHz) band is () when excluding the first three observations and () when including them.
 |
4 Optical observations of AT J0642.95118
4.1 Imaging
Following the identification of AT J0642.95118, we obtained images of its optical counterpart with the Gemini Multi-Object Spectrograph (GMOS; Hook et al. 2004) at the Gemini-South telescope. Our observations were conducted on MJD 57141 in the and bands using the Hamamatsu CCDs (Gimeno et al. 2016), under photometric conditions with 0.6″ FWHM seeing. Four dithered exposures were taken in each band, totalling 2617 s in the -band and 2322 s in the -band. We reduced the data using the standard GMOS pipeline tasks in the Gemini IRAF package. We used facility bias and flat-field exposures nearest in time to our observations to correct the data, and co-added all images following subtraction of dithering offsets. Astrometric corrections were applied to the images using D. Perley’s autoastrometry software222http://www.astro.caltech.edu/~dperley/programs/autoastrometry.py, using the USNO B1.0 catalog as a reference (Monet et al. 2003), with 0.32″ accuracy.
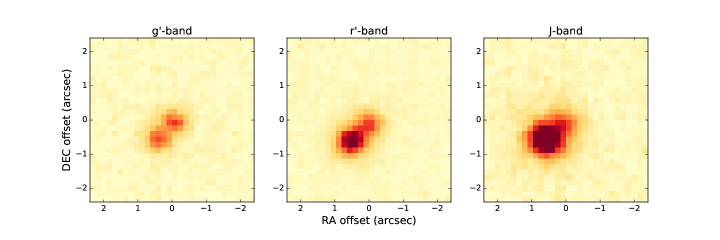
We identified a point-like counterpart to the radio source that is the north-west component of a close (0.6″ separation) double (Fig. 3, left and middle panels). We term this source G1, and its south-eastern companion G2. As we did not observe a photometric standard field, we used the GMOS-South photometric equation defined online333https://www.gemini.edu/sciops/instruments/gmos/calibration/photometric-stds to set the flux scale. We modeled the point-spread function using nearby stars and used this to model G1 and G2 as two point sources, finding a satisfactory fit to the observation. For G1, we obtained AB magnitudes of and , and for G2 we obtained and . At this position, the Galactic extinction is 0.208 magnitudes in the band, and 0.144 magnitudes in the band (Schlafly & Finkbeiner 2011).
We also obtained imaging observations in the band with the FourStar instrument (Persson et al. 2013) on the Magellan-Baade telescope at Las Campanas Observatory. The observations, conducted on MJD 57270 under photometric conditions with 0.65″ FWHM seeing, were split into 18 dithered exposures totalling 1153 s. The data were reduced using the standard FourStar pipeline. We calibrated the photometry and astrometry of the image using 2MASS point sources (Skrutskie et al. 2006), attaining 0.2″ astrometric accuracy. The resulting detections of G1 and G2 are shown in the right panel of Fig. 3. Using the same technique as above, we measure AB magnitudes of for G1, and for G2. The Galactic extinction in the band is 0.045 magnitudes (Schlafly & Finkbeiner 2011).
The point source catalog of the Widefield Infrared Survey Explorer (WISE; Wright et al. 2010) contains a source, WISE J064257.16-511817.8, which is coincident with G1 and is detected in the two shortest wavelength bands. Its (AB) magnitudes are and . Based on this color, the source is consistent with an active galactic nucleus (AGN; Stern et al. 2012). The optical colors are also consistent with an AGN at moderate redshift, such that Ly is blue-ward of our observations (Smolčić et al. 2006).
 |
|
4.2 Spectroscopy
We also obtained optical spectra of G1 and G2 using GMOS at Gemini-South. We used a 1″ longslit oriented along the axis of G1 and G2 (position angle of 317∘). Our observations in the red part of the spectrum were conducted on MJD 57362 using the R400 grating with the GG455 order-blocking filter. Four 920 s exposures were taken at a mean airmass of 1.2, with two centered on 8610 Å and two centered on 8510 Å to cover the gaps between CCDs. Our blue observations were conducted on MJD 57367 at a mean airmass of 1.1 using the B600 grating with no filter, and three 920 s exposures (two centered on 5060 Å, and one centered on 4960 Å). We reduced the data using the standard GMOS pipeline, with a bias observation obtained on MJD 57363, and flat-field observations taken in between our science exposures.
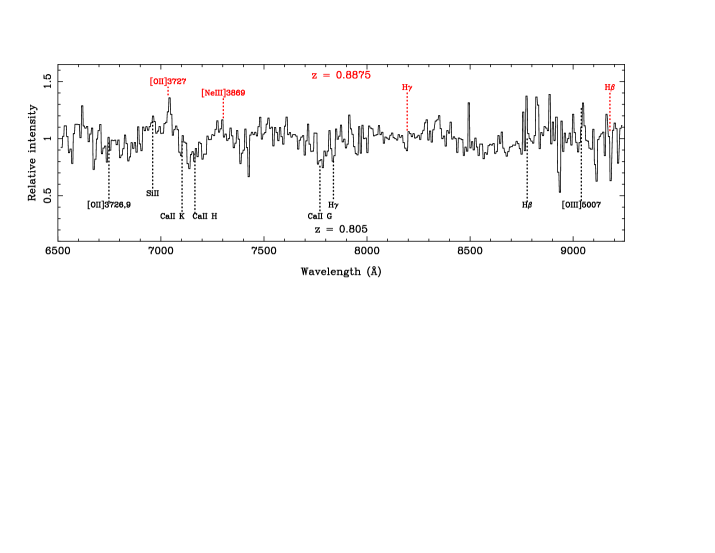
Unfortunately, intermittent high cirrus was present, precluding accurate spectrophotometric calibration and making sky emission lines difficult to subtract. We nonetheless used observations of a spectrophotometric calibrator on MJD 57562 (LTT 3218) to calibrate telluric absorption features. As the seeing on both nights was ″ FWHM, as measured from acquisition images, we could not deconvolve the spectral traces of G1 and G2. Furthermore, some light from G1 was likely refracted out of the slit as GMOS does not contain an atmospheric dispersion corrector. Hence, following optimal extraction of the spectra, we only considered data taken using the R400 grating at wavelengths shorter than 9250 Å and divided the data by a smooth polynomial fit to the continuum. The resulting spectrum, which contains numerous artifacts due to imperfect sky subtraction and is binned to 8 Å resolution, is shown in Fig. 3.
We tentatively identify two redshifted systems in this spectrum: one at and one at . The first system is consistent with the spectra of early-type galaxies (Polletta et al. 2007), a hypothesis which is additionally evidenced by a possible spectral break in the continuum around 4000 Å. We thus interpret it as corresponding to G2. The redshift of the second system, presumably G1 (the radio source), is estimated primarily using the strong emission line at 7040 Å and by assuming (based on the WISE and blue optical colors) that it is an AGN. Identifying the 7040 Å line with [OII]3272 Å results in a clear prediction, specifically that strong emission lines (e.g., Ly, CIV, MgII) should be seen at shorter wavelengths. It appears to exhibit H and H in absorption. The lack of these normally broad lines in emission, combined with the compact nature of its radio counterpart evidenced by the variability, is suggestive of a narrow-line radio galaxy (Osterbrock 1978), or perhaps a radio-loud narrow-line Seyfert 1 (Komossa 2008). More sensitive spectra with broader wavelength coverage would help in this classification, for example by searching for the FeII emission features that distinguish the narrow-line Seyfert 1 class.
5 Discussion
5.1 Limits on afterglows from the -ray pulse
Our observations can be used to search for afterglow emission associated with the potential -ray transient Swift J0644.55111. In the classic fireball model Frail et al. (2000), the flux density of radio synchrotron emission is directly related to the input energy. Murase et al. (2016) calculated the flux density assuming the spectrum is not self absorbed and that the frequency of interest is below the peak of the spectrum so that the flux density is still rising. This is a reasonable assumption for our observations within and d after the FRB. Assuming a distance Gpc consistent with the pulses extragalactic dispersion measure, after time d at a frequency GHz, the flux density is
| (1) | |||||
where is the energy emitted in -rays, is the electron number-density of the shocked medium, is the magnetic energy fraction, is the nonthermal-electron energy density, is the nonthermal electron energy, and . For fiducial assumptions for these parameters, we could have detected the source in both the GHz and GHz observations d after the explosion, with a significance of . This suggests that either the input luminosity is smaller than estimated in DeLaunay et al. (2016), that the environment surrounding the burst is unlike that of long -ray bursts or core-collapse supernova explosions, or that the -ray transient is unrelated to the FRB or spurious.
5.2 The ATCA variable source
We interpret the variable radio source AT J0642.95118 as emission from compact components in a radio-loud AGN. This is evidenced by the persistent radio variability on timescales of days to months, the optical to mid-infrared colors of its host system, and its possible spectral identification. The lightcurve of the flare following FRB 131104, with the spectrum inverting when it brightens, is consistent with the classic picture of an expanding and cooling synchrotron bubble. Although the flare lightcurve is consistent with the radio afterglows of relativistic transients (e.g., Frail et al. 2000), the persistence and low-level variability of the radio source beyond the flare means that we have no evidence to favor a transient coinciding with a variable radio source, over simply a variable radio source.
AT J0642.95118 is nonetheless interesting. This object has substantial differences from the variable radio source identified with FRB 150418 (Keane et al. 2016). First, we clearly identify the flare of AT J0642.95118 with the days immediately after the FRB, as we observe the flux density rise and the spectrum invert. Additionally, scintillation in the Milky Way interstellar medium is less likely to cause the variability of AT J0642.95118 because the source is at a relatively high galactic latitude (), and the scattering is expected to be in the weak regime (e.g., Walker 1998) at 7.5 GHz. It is possible that the source was magnified by an extreme scattering event Bannister et al. (2016), but that is improbable as only one in compact sources are undergoing one at a given time. Perhaps most importantly, AT J0642.95118 has not re-brightened to within a factor of two of its flux densities as the peak of the flare, unlike the case for FRB 150418 Williams & Berger (2016); Johnston et al. (2016). The flare of AT J0642.95118 following FRB 131104 thus appears to be a transient occurrence within the scope of our monitoring of its flux density.
Blind surveys for transients at lower frequencies find objects with such extreme variability (factor of three on few-month timescales) only very rarely (e.g., Mooley et al. 2016). This is not surprising. Assuming constant brightness temperature, intrinsic AGN variability timescales scale with frequency proportional to . Transient AGN flare events at higher frequencies are hence generally expected to be shorter in time, and are often also larger in modulation, than at lower frequencies (e.g., Hovatta et al. 2008). Scintillation timescales in the strong scintillation regime are expected to be more rapid. The post-FRB flare of AT J0642.95118 is clearly most dramatic at the highest observing frequency.
The temporal coincidence of AT J0642.95118 flare with FRB 131104 nonetheless motivates us to consider the possibility that it is associated with the FRB. In this case, AGN activity would be implicated in FRB production. The potential redshift () of AT J0642.95118 is consistent with the extragalactic DM of the FRB (Dolag et al. 2015). While other source channels have been more strongly advocated for FRBs, it is not implausible that AGN could produce FRBs. Millisecond-duration radio pulses propagating through relativistic plasma in AGN jets may be immune to both absorption and scattering effects (Lyubarsky 2008), implying that FRBs originating close to launching regions could be observed from AGN viewed along the jets. Mechanisms (e.g., Romero et al. 2016) have been proposed for the production of FRBs in AGN jets, analogous to the mechanisms for generating TeV photons.
There are however reasons to disfavor an association between AT J0642.95118 and the FRB. The background transient and variable event rate at GHz (where the flare is the most prominent), and hence the false-alarm rate for the association, is poorly constrained. Even so, the FRB rate needs to be reconciled with the background rate Vedantham et al. (2016a). Intrinsic AGN variability is likely to dominate the background slow-transient rate. A detailed analysis of the radio AGN population and its variability properties in comparison with the FRB rate would be required to assess how commonly a single object would be expected to emit an FRB, and what its signature could be. Further physical modeling of the conditions and orientations under which FRBs could escape AGN would help refine such an analysis. This analysis would be further aided by a large area survey for transient and variable sources at high frequencies, as well as dedicated follow-up observations of other FRBs, in particular to assess the frequency of short-duration flares in AGN. However, a substantially more constraining result would be the direct interferometric localization of a population of FRBs to flaring AGN.
6 Conclusions
We present 25 epochs of centimetric imaging observations of the field of FRB 131104 with the Australia Telescope Compact Array spanning 2.5 yr. No radio afterglow is coincident with the -ray event reported by DeLaunay et al. (2016). This tightly constrains the energetics the associated cataclysm, or suggests, as supported by probabilistic arguments we outline, that the -ray event is unrelated to the FRB or spurious.
We have identified an unusual flaring radio source temporally and spatially coincident with FRB 131104. This source, AT J0642.95118, is not spatially coincident with the potential -ray transient Swift J0644.55111. AT J0642.95118 is consistent with compact emission components in an AGN, as identified by optical and infrared photometry and spectroscopy. The discovery of further, better-localized FRBs with either radio or -ray flares (or neither) will resolve the uncertainty (or not) in the multiwavelength associations with the enigmatic fast radio burst population.
References
- Akiyama & Johnson (2016) Akiyama, K., & Johnson, M. D. 2016, ApJ, 824, L3
- Bannister et al. (2016) Bannister, K. W., Stevens, J., Tuntsov, A. V., et al. 2016, Science, 351, 354
- Barthelmy et al. (2005) Barthelmy, S. D., Barbier, L. M., Cummings, J. R., et al. 2005, Space Sci. Rev., 120, 143
- Cai et al. (2012) Cai, Y.-F., Sabancilar, E., Steer, D. A., & Vachaspati, T. 2012, Phys. Rev. D, 86, 043521
- Cordes & Wasserman (2016) Cordes, J. M., & Wasserman, I. 2016, MNRAS, 457, 232
- DeLaunay et al. (2016) DeLaunay, J. J., Fox, D. B., Murase, K., et al. 2016, ApJ, 831, L1
- Dolag et al. (2015) Dolag, K., Gaensler, B. M., Beck, A. M., & Beck, M. C. 2015, MNRAS, 451, 4277
- Frail et al. (2000) Frail, D. A., Waxman, E., & Kulkarni, S. R. 2000, ApJ, 537, 191
- Gehrels et al. (2009) Gehrels, N., Ramirez-Ruiz, E., & Fox, D. B. 2009, ARAA, 47, 567
- Gimeno et al. (2016) Gimeno, G., Roth, K., Chiboucas, K., & et al. 2016, Proc. SPIE, 9908, 99082S
- Hook et al. (2004) Hook, I. M., Jørgensen, I., Allington-Smith, J. R., et al. 2004, PASP, 116, 425
- Hovatta et al. (2008) Hovatta, T., Nieppola, E., Tornikoski, M., et al. 2008, A&A, 485, 51
- Johnston et al. (2016) Johnston, S., Keane, E. F., Bhandari, S., et al. 2016, ArXiv e-prints, arXiv:1610.09043
- Keane & Petroff (2015) Keane, E. F., & Petroff, E. 2015, MNRAS, 447, 2852
- Keane et al. (2016) Keane, E. F., Johnston, S., Bhandari, S., et al. 2016, Nature, 530, 453
- Komossa (2008) Komossa, S. 2008, in Revista Mexicana de Astronomia y Astrofisica Conference Series, Vol. 32, Revista Mexicana de Astronomia y Astrofisica Conference Series, 86–92
- Lorimer et al. (2007) Lorimer, D. R., Bailes, M., McLaughlin, M. A., Narkevic, D. J., & Crawford, F. 2007, Science, 318, 777
- Lyubarsky (2008) Lyubarsky, Y. 2008, ApJ, 682, 1443
- Masui et al. (2015) Masui, K., Lin, H.-H., Sievers, J., et al. 2015, Nature, 528, 523
- Monet et al. (2003) Monet, D. G., Levine, S. E., Canzian, B., et al. 2003, AJ, 125, 984
- Mooley et al. (2016) Mooley, K. P., Hallinan, G., Bourke, S., et al. 2016, ApJ, 818, 105
- Murase et al. (2016) Murase, K., Meszaros, P., & Fox, D. B. 2016, ArXiv e-prints, arXiv:1611.03848
- Osterbrock (1978) Osterbrock, D. E. 1978, Phys. Scr, 17, 137
- Persson et al. (2013) Persson, S. E., Murphy, D. C., Smee, S., et al. 2013, PASP, 125, 654
- Polletta et al. (2007) Polletta, M., Tajer, M., Maraschi, L., et al. 2007, ApJ, 663, 81
- Ravi et al. (2015) Ravi, V., Shannon, R. M., & Jameson, A. 2015, ApJ, 799, L5
- Ravi et al. (2016) Ravi, V., Shannon, R. M., Bailes, M., et al. 2016, Science, in press
- Romero et al. (2016) Romero, G. E., del Valle, M. V., & Vieyro, F. L. 2016, Phys. Rev. D, 93, 023001
- Sault et al. (1995) Sault, R. J., Teuben, P. J., & Wright, M. C. H. 1995, in Astronomical Society of the Pacific Conference Series, Vol. 77, Astronomical Data Analysis Software and Systems IV, ed. R. A. Shaw, H. E. Payne, & J. J. E. Hayes, 433
- Schlafly & Finkbeiner (2011) Schlafly, E. F., & Finkbeiner, D. P. 2011, ApJ, 737, 103
- Skrutskie et al. (2006) Skrutskie, M. F., Cutri, R. M., Stiening, R., et al. 2006, AJ, 131, 1163
- Smolčić et al. (2006) Smolčić, V., Ivezić, Ž., Gaćeša, M., et al. 2006, MNRAS, 371, 121
- Spitler et al. (2016) Spitler, L. G., Scholz, P., Hessels, J. W. T., et al. 2016, Nature, 531, 202
- Stern et al. (2012) Stern, D., Assef, R. J., Benford, D. J., et al. 2012, ApJ, 753, 30
- Thornton et al. (2013) Thornton, D., Stappers, B., Bailes, M., et al. 2013, Science, 341, 53
- Vedantham et al. (2016a) Vedantham, H. K., Ravi, V., Mooley, K., et al. 2016a, ApJ, 824, L9
- Vedantham et al. (2016b) Vedantham, H. K., Ravi, V., Hallinan, G., & Shannon, R. M. 2016b, ApJ, 830, 75
- Walker (1998) Walker, M. A. 1998, MNRAS, 294, 307
- Williams & Berger (2016) Williams, P. K. G., & Berger, E. 2016, ApJ, 821, L22
- Wilson et al. (2011) Wilson, W. E., Ferris, R. H., Axtens, P., et al. 2011, MNRAS, 416, 832
- Wright et al. (2010) Wright, E. L., Eisenhardt, P. R. M., Mainzer, A. K., et al. 2010, AJ, 140, 1868