Mapping the Polarization of the Radio-Loud Ly Nebula B3 J2330+3927**affiliation: Observations reported here were obtained at the MMT Observatory, a joint facility of the University of Arizona and the Smithsonian Institution.
Abstract
Ly nebulae, or “Ly blobs”, are extended (up to 100 kpc), bright ( erg s-1) clouds of Ly emitting gas that tend to lie in overdense regions at 2–5. The origin of the Ly emission remains unknown, but recent theoretical work suggests that measuring the polarization might discriminate among powering mechanisms. Here we present the first narrowband, imaging polarimetry of a radio-loud Ly nebula, B3 J2330+3927 at , with an embedded active galactic nucleus (AGN). The AGN lies near the blob’s Ly emission peak and its radio lobes align roughly with the blob’s major axis. With the SPOL polarimeter on the 6.5m MMT telescope, we map the total (Ly + continuum) polarization in a grid of circular apertures of radius 0.6′′ (4.4 kpc), detecting a significant () polarization fraction in nine apertures and achieving strong upper-limits (as low as 2%) elsewhere. increases from % at 5 kpc from the blob center to 17% at 15–25 kpc. The detections are distributed asymmetrically, roughly along the nebula’s major axis. The polarization angles are mostly perpendicular to this axis. Comparing the Ly flux to that of the continuum, and conservatively assuming that the continuum is highly polarized (20–100%) and aligned with the total polarization, we place lower limits on the polarization of the Ly emission ranging from no significant polarization at 5 kpc from the blob center to 3–17% at 10–25 kpc. Like the total polarization, the Ly polarization detections occur more often along the blob’s major axis.
Subject headings:
galaxies: active – galaxies: high-redshift — galaxies: individual (B3 J2330+3927) — intergalactic medium — polarization1. Introduction
Giant (up to 100 kpc) gaseous, Ly-emitting nebulae, also known as Ly “blobs” (Steidel et al., 2000; Matsuda et al., 2004; Dey et al., 2005; Prescott et al., 2008; Yang et al., 2009), are extremely luminous ( erg s-1) and were discovered first in overdense regions of the high redshift ( 2–5) Universe (Matsuda et al., 2005; Prescott et al., 2008). Their rarity and clustering are consistent with their occupying massive (1013 M⊙) dark matter halos then that evolve into rich groups or clusters of galaxies today (Yang et al., 2009, 2010). The Ly blob gas thus may represent the proto-intracluster medium and the embedded sources the progenitors of cluster galaxies (Yang et al., 2010; Prescott et al., 2012). Thus identifying the mysterious source or sources of the extended Ly emission is essential to understanding the evolution of large-scale structure and of the most massive galaxies.
Observations and theory suggest a range of powering mechanisms, including gravitational cooling radiation (Haiman et al., 2000; Fardal et al., 2001; Goerdt et al., 2010; Faucher-Giguère et al., 2010; Rosdahl & Blaizot, 2012), shock-heating from starburst-driven winds (Taniguchi & Shioya, 2000; Mori et al., 2004), the resonant scattering of Ly photons produced by star formation (Steidel et al., 2011), and photo-ionizing radiation from active galactic nuclei (AGN) (Haiman et al., 2000). Even with careful constraints on the Ly line profile and distribution, discriminating among these models is difficult, in part due to the complex radiative transfer of the resonantly scattered Ly line and the uncertain internal geometry of each Ly blob (e.g., Yang et al., 2011, 2014a, 2014b).
Measuring the polarization of the Ly line can shed new light on the problem. Recent radiative transfer simulations predict the polarization of the Ly line in a number of different scenarios. For example, backscattered Ly flux from galaxies surrounded by a superwind-driven outflow is expected to produce a Ly polarization fraction that rises with radius to as much as 40% where the neutral hydrogen column density drops below cm-2 (Dijkstra & Loeb, 2008). A similar integrated over the line profile may arise from cooling radiation from a collapsing proto-galaxy (Dijkstra & Loeb 2008; see also Trebitsch et al. 2016), but with the inverted wavelength dependence when the line is spectrally resolved. Resonant scattering in the diffuse intergalactic medium typically results in a lower (7%), which depends on the flux of the ionizing background (Loeb & Rybicki, 1999; Rybicki & Loeb, 1999; Dijkstra & Loeb, 2008). These models, which all currently assume spherical symmetry, continue to grow more sophisticated (e.g., Trebitsch et al., 2016). Their improving, detailed predictions, when combined with the new availability of polarimeters on the largest telescopes, provide a unique opportunity to isolate the mechanism that powers Ly blobs by mapping the polarization.
Polarization work on Ly blobs has been limited. To date, only two Ly blobs have been observed with narrowband imaging polarimetry. One, SSA22–LAB1, shows concentric polarization rings, reaching 10% at 30 kpc from the blob center and rising to 20% at 45 kpc (Hayes et al., 2011), suggesting a central powering source for this Ly blob (see also Beck et al., 2016). In the other blob, LABd05, Prescott et al. (2011) do not detect polarization within a single, large (radius 33 kpc) aperture, obtaining an upper-limit of 2.6% 2.8%; deeper and spatially resolved observations are required to test this result (E. Kim et al, in preparation). These past studies assume that the polarization arises solely from Ly, given that the Ly line dominates the continuum emission, at least at large radii. Both Ly nebulae are radio-quiet. Spectro-polarimetry of a radio-loud Ly nebula, TXS 0211–122 at , reveals polarization of the Ly line: 16.4% 4.6% on one side of the nebula (Humphrey et al., 2013). In this case, the spatial information is limited, inhibiting the interpretation of the results.
Looking to the literature on radio galaxies, which can be surrounded by line emission nebulae similar in Ly luminosity and spatial extent to blobs (see McCarthy, 1993, and references therein) does not improve our understanding of how the Ly polarization is distributed on the sky. Existing polarization measurements of radio galaxies, seeking to explain the alignment effect—the strong correlation between their radio and optical continuum morphologies (McCarthy et al., 1987)—tend to focus on the continuum (Vernet et al., 2001). Constraints on the Ly polarization are few, particularly over the tens of kpc scales typical of Ly blobs. Using spectro-polarimetry, Cimatti et al. (1998) find that the Ly line is unpolarized in two radio galaxies. Ly around another radio galaxy, 4C 41.1, is polarized at a low level (1.12% 0.26%), while its continuum emission is unpolarized (Dey et al., 1997).
The similarity in morphology and energy between extended Ly nebulae with radio-loud and radio-quiet AGN suggest an unexplored connection between their powering mechanisms (Villar-Martín et al., 2003; Dey et al., 1997). Here we present the first Ly imaging polarimetry measurement for a blob with an embedded radio galaxy. We use the SPOL imaging spectro-polarimeter on the 6.5m MMT telescope to map B3 J2330+3927, a radio-loud Ly blob at . Its embedded radio galaxy is one of the 1103 radio sources from the Third Bologna Catalog (Ficarra et al., 1985; Vigotti et al., 1989). The associated Ly nebula was discovered by De Breuck et al. (2003) through a long-slit spectroscopy and observed in detail by Matsuda et al. (2009). SPOL is a clean instrument, designed to reduce any instrument polarization by integrating over 16 different waveplate positions. At the redshift of our source, SPOL’s high stability and sensitivity on the MMT enables measurement of a few percent polarization on scales of 5 kpc, even at the low surface brightnesses characteristic of Ly blobs.
This paper is the first of several to map the polarization of giant Ly nebulae at high-redshift. In this paper, we present the map of our first target and establish our methodologies. Subsequent papers will analyze the full blob sample and compare the results to physical models. This paper is organized as follows. In Section 2, we describe the details of our observations. In Section 3, we discuss the data reduction for the polarization measurement and the calibration sources. In Section 4, we present our polarization map and discuss the possible sources of error. In Section 5, we summarize our conclusions.
2. The Observations
2.1. The Target
B3 J2330+3927 is a high-redshift () radio galaxy at R.A.=23h 30m 24.9s and decl. =39° 27′ 12″ that is embedded in a giant Ly halo that extends over 130 kpc. This nebula is one of the brightest known, with = 2.5 erg s-1 (Matsuda et al., 2009). The CO emission and H I absorption reveals a massive gas and dust reservoir associated with the radio galaxy (De Breuck et al., 2003; Ivison et al., 2012). VLBA and VLA data show a one-sided jet driven by a Type II AGN (Pérez-Torres & De Breuck, 2005). The galaxy environment of this Ly blob is over-dense: a combination of broad and narrowband observations (Matsuda et al., 2009) reveals 127 compact Ly emitter (LAE) candidates and another giant (100 kpc), but radio-quiet, Ly blob within the (58 44 comoving Mpc2) field. This wealth of ancillary data, the redshift, and a bright point source at R.A.=23h 30m 25.10s, decl. =39° 27′ 05.4″ useful for image registering and alignment, make B3 J2330+3927 an attractive target.
2.2. The Instrument
On UT September 18–20, 2012, we used the 6.5m MMT telescope on Mount Hopkins, Arizona, to observe B3 J2330+3927 with the SPOL CCD imaging/spectro-polarimeter in its imaging polarimetry mode (Schmidt et al., 1992b). We used a narrowband filter (kp583) on loan from Kitt Peak National Observatory that is centered at 4980 Å and has a FWHM of 54 Å. The detector is a thinned, anti-reflection-coated 1200800 STA CCD with a pixel scale of 019 per pixel and a quantum efficiency of 0.85 in the filter bandpass. We obtained a total of 8.6 hours exposure time on B3 J2330+3927. For the calibration of the instrument, we observed unpolarized and polarized standard stars each night. We also observed CRL 2688 (the “Egg Nebula”) as an extended polarized source to investigate any unforeseen systematic effects across the 19″19″ field of view.
In SPOL, the telescope is fed through a half-wave plate and then to a Wollaston prism. The Wollaston prism is located in the optical path between a transmissive collimator and a plane mirror that substitutes for a diffraction grating when imaging polarimetry is desired. The narrowband filter is placed in the collimated beam between the collimator and the Wollaston prism. The half-wave plate retards one orthogonal component of the light and thus changes the polarization angle of the incoming light. The Wollaston prism splits the two orthogonal polarizations so the two polarizations are imaged separately, in our case in separate “panels” in one “image”. The difference between these two panels indicates the strength of the polarization.
Linear polarization measurements with SPOL are accomplished by stepping a wheel holding a semi-achromatic half-wave plate through two sequences that are aimed to measure Stokes parameters and , respectively. A -sequence yields two images ( and ): the first () consisting of two beams (panels) of four exposures at four orthogonal position angles of the waveplate (0°, 90°, 180°, 270°). The second image is taken at angles offset by 45 degrees from the first (45°, 135°, 225°, 315°). The -sequence follows the same progression ( and ) as the -sequence, but the waveplate position angles are offset by 22.5 deg from those of the -sequence. The redundancy in the data-taking sequences ensures that effects caused by imperfections in the waveplate and the waveplate’s positioning in the optical path are minimized. As a result, the instrumental polarization of SPOL is consistently and verified by our measurements of unpolarized standards during the nights that we observed B3 J2330+3927 (Section 3.3.1). We do not include this negligible polarization in the subsequent analysis of the data. In addition, the dual-beam design of SPOL eliminates the possibility of measuring spurious polarization arising from variable seeing and sky transparency during observing sequences.
For B3 J2330+3927, we took exposures of 300 sec per waveplate position angle, so we completed both and sequences in 80 min. In total, we obtained six full polarization sequences. We optimized the MMT optics between each measurement, except when the seeing remained ideal and the weather conditions did not change. The seeing was 1.0″ during most of the observations, rising to 1.5″ for the two sequences taken at the end of each of the two nights. We used the positions of the Ly blob center (R.A.=23h 30m 24.9s, decl. =39° 27′ 12″) and of a bright point source (R.A.=23h 30m 25.10s, decl. =39° 27′ 05.4″; 8″ to the southeast of the blob center) to register and align our images, as the field was dithered slightly between polarization sequences to minimize the effects of any poorly calibrated pixels. We measured the polarization efficiency of the system ( 0.973) by inserting a Nicol prism before the aperture plate and waveplate in the light path within the instrument. This efficiency is consistent with other measurements acquired over more than two decades for SPOL at 4980Å when used as a spectro-polarimeter.
3. The Data Reduction
3.1. Pre-processing
To prepare the images for polarization measurement, we perform overscan correction, bias subtraction, flat fielding, and cosmic-ray removal.
For flat-fielding, we obtained dome flats with all the polarization optics (Wollaston prism and half-wave plate) and construct a partial skyflat by median-combining the science images with the central Ly blob blocked out. The dome flats show a significant gradient across the image that the science exposures and partial skyflat do not. To correct the domeflat, we fit the gradient with a 2-D first-order polynomial and divide it out. We apply the resulting “flattened” dome flat to the partial skyflat and the science images. There are no significant gradients in the resulting images.
We use the L.A.COSMIC package (van Dokkum, 2001) to remove cosmic rays from our images. We examine the cosmic ray masks by eye to confirm that real signal from the nebula remains.
3.2. Polarization Calculation
As described in 2.2, from a full – sequence, we obtain a total of four images (, , , ), each with two panels (“up” and “down” beams), respectively. Here we explain the calculation of the polarization parameters from those images.
With the notation
| (1) |
and can be determined using the following formulae:
| (2) |
| (3) |
where and are the total intensities measured from the and sequences, respectively:
| (4) | |||||
| (5) | |||||
| (6) |
Ideally, is the same as and is the same as . The same applies for the images.
For each – sequence, we create these , and images (or and ), and combine them to increase the signal-to-noise (S/N). When combining the sequences, we scale the images to compensate for the variations arising from airmass and weather. From these final Stokes images (, , ), we calculate the polarization fraction ( ) and angle () using the following formulae:
| (7) | |||||
| (8) |
Because the S/N of our target is low, we calculate and for large aperture sizes (1.2–1.5″) over the map. The error associated with the polarization due to photon noise is derived from propagating errors through the above formulae.
3.3. Calibrations
3.3.1 Standard Stars
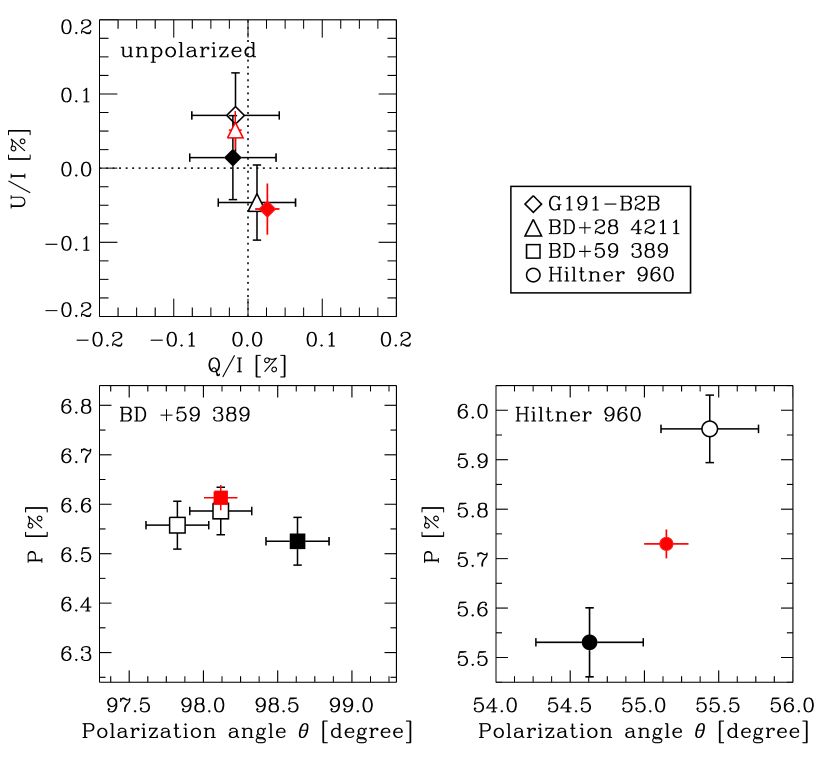
To calibrate and verify the linear polarization measurements with SPOL, we observed both polarized and unpolarized standard stars (Schmidt et al., 1992a) each night. These observations are summarized in Figure 1. For the unpolarized stars, G191-B2B and BD+28 4211, the instrumental polarization ( and ) at the MMT is indeed (top left panel), as previously found for SPOL at other telescopes. We also use these spectro-photometric standard stars to flux-calibrate the narrowband images.
We observed two interstellar polarized standards, BD+59 389 and Hiltner 960. Given that our narrowband filter is centered at a different wavelength (4980 Å) than previous measurements of these standards, we calculate the expected and within our bandpass by interpolating between the previous measurements with an interstellar polarization function (Serkowski, 1973). Our observations of BD+59 389 are consistent with historical measurements, i.e., our three measurements over two nights agree within 1.6 and 2.0 of the interpolated and from the literature, respectively,
For Hiltner 960, the observed ’s are also within 1.3 range, but the ’s are more discrepant (3.1) from the value derived from the literature. Possible reasons for this discrepancy include Hiltner 960’s variability, leading to a poorly-fit interstellar polarization curve (Schmidt et al., 1992a), and its close companion, which cannot be easily accounted for in the polarization measurement. Regardless of its source, this discrepancy ( 0.2%) is negligible compared with the errors in and arising from photon noise in the measurement of our science target, B3 J2330+3927.
3.3.2 Egg Nebula
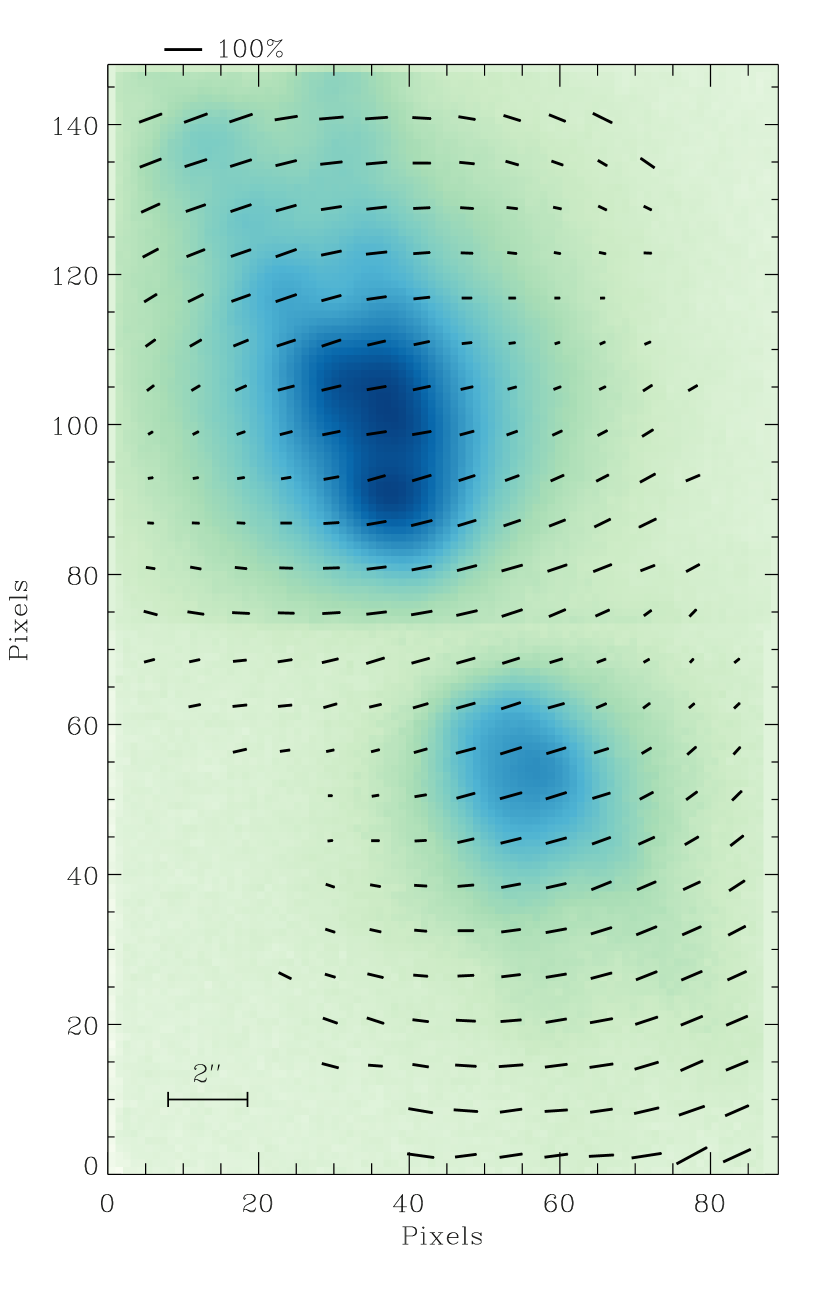
In addition to the polarization standard stars, we observe CRL 2688 as an extended polarization “standard” (Figure 2). The short ( sec) observations of both the north and south lobes test the polarization characteristics of SPOL over the entire field of view. We use these high S/N data to examine the images for unexpected systematic effects that would be hidden in the case of a nebula as faint as B3 J2330+3927. Our optical polarization map is roughly consistent with the NICMOS 2m polarization map from Sahai et al. (1998), e.g., the vectors along the axis connecting the two components are generally perpendicular to it (see their Fig. 5). Furthermore, our average for each lobe lies within of the value expected at 4980 Å, as interpolated from the optical polarization measurements of Shawl & Tarenghi (1976).
4. Results and Discussion
4.1. Total Polarization Map
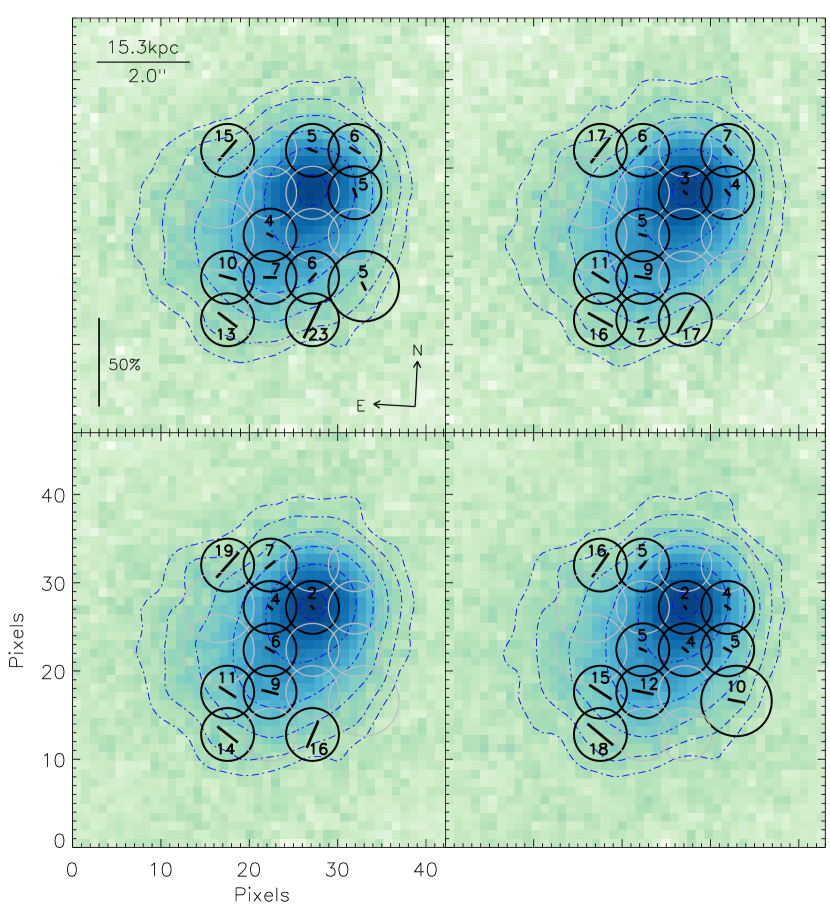
Figure 3 shows our polarization map of B3 J2330+3927 for the light in the narrowband image, i.e., Ly plus continuum centered at 4980 Å with a FWHM of 54 Å. We measure the polarization on a grid of circular apertures with minimum radius of pixels (i.e., , 4.4 kpc), comparable to the seeing. We enlarge three apertures far from the Ly peak from pixels to 4 pixels, so that they reach a similar flux signal-to-noise ratio as the other apertures.
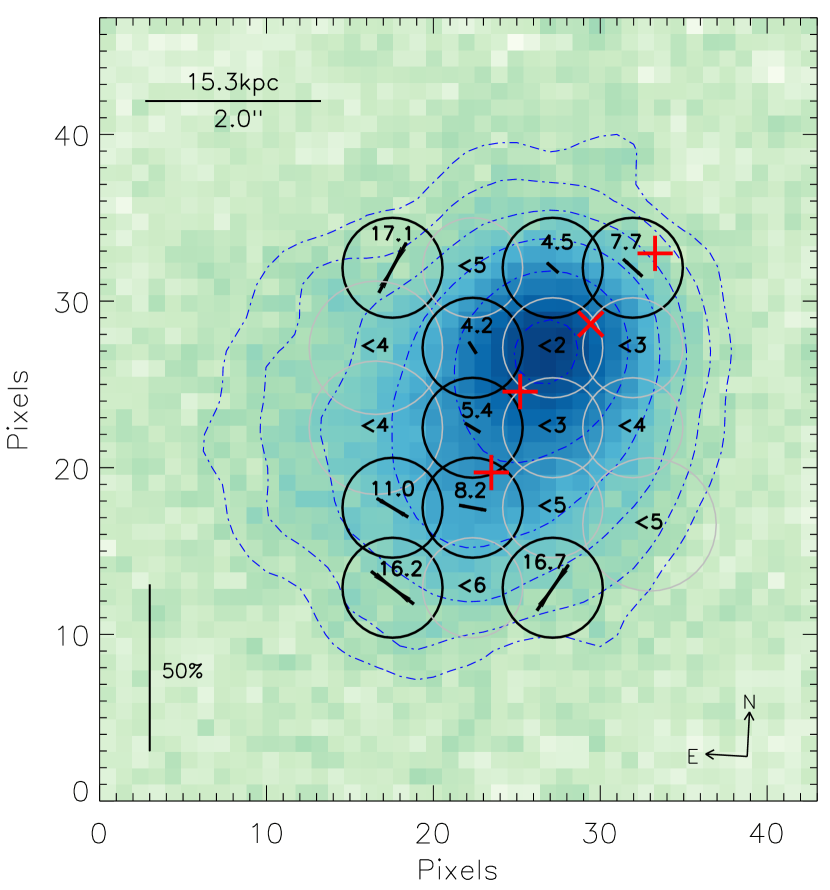
We detect significant ( 2) polarization in nine apertures and achieve strong upper-limits (i.e., as low as 2%) elsewhere, indicating varying polarization across the blob. There is little if any polarization at the blob center and to the southwest of the nebula. The significant detections are generally distributed along the blob’s major axis, which is also the radio lobe direction. Along that axis, increases from at 5 kpc from the blob center to roughly 17% at 15–25 kpc. The polarization angles tend to be perpendicular to that axis.
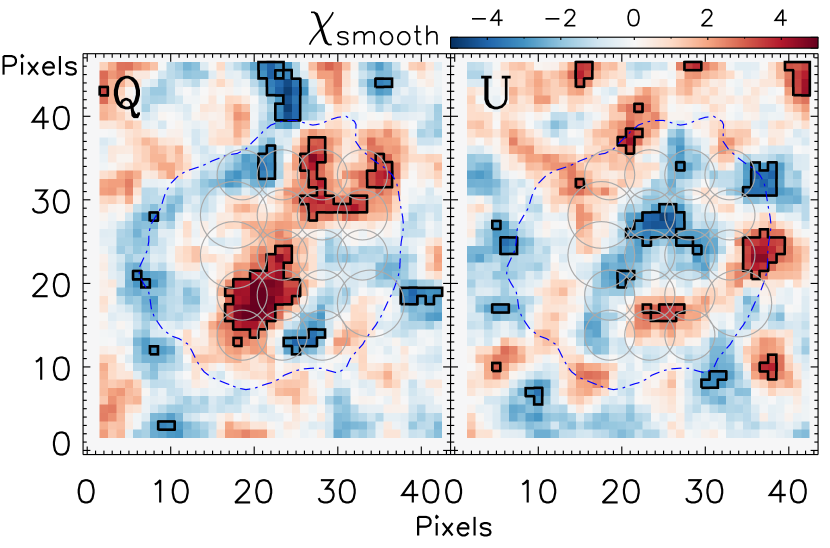
To test the significance of our polarization measurements, we show the smoothed- images for and fluxes in Figure 4. Here of an image is defined by
| (9) |
where is the convolved image with a smoothing kernel and is the variance of smoothed image that is propagated from the unsmoothed image. Given that should follow a normal distribution for random noise, is useful to visualize the low-S/N features. Here, we adopt a tophat kernel with a radius of 3 pixels to match the size of apertures used for the measurements of and . The image shows that the region with (outlined with solid contours) is roughly aligned with the major axis, demonstrating the significance of our polarization detections.
The errors shown in Fig. 3 are calculated purely from photon noise statistics. One additional source of uncertainty is the extent to which errors in image alignment, i.e., from shifts and rotations, affect the polarization map when we combine images. Polarization is calculated by taking the difference between different exposures. When images are not aligned correctly, the polarization may be affected. Between sequences and within sequences, the point source in the southeast shifts by 1 pixel and rotates relative to the blob center by only 0.5 degree. Thus the uncertainties in misalignment are dominated by translational errors. To estimate how much translational errors could affect our measurements, we introduce errors of this magnitude into our best-aligned images and repeat the entire reduction procedure. Figure 5 shows four random realizations of the total polarization maps after introducing random alignment errors with 1 pixel shifts. Our results do not change significantly.
4.2. Ly Line Polarization Map
The UV continuum aligned with the radio lobes of radio galaxies is sometimes polarized, with the continuum polarization fraction typically , but sometimes as high as 20–30% (Jannuzi & Elston, 1991; Vernet et al., 2001; Tadhunter, 2005). As a result, the relative contributions of continuum and Ly polarization to our total polarization map for B3 J2330+3927 are not clear. Future spectro-polarimetry, which could isolate the line-only polarization signal (e.g., Beck et al., 2016), is needed. For now, we make a conservative argument to place lower limits on the Ly contribution, asking whether at least some Ly polarization is required to explain the map in Fig. 3.
To separate out the polarization contributed by the continuum and to place a lower limit on the line polarization, we use the following simple formalism, where and refer to the total flux in the images from the continuum and Ly, respectively. This light is polarized by and for the continuum and Ly, respectively. Because the narrowband filter captures both the continuum and Ly fluxes at the same time, in one sequence, we measure the total parameter:
| (10) |
Likewise, in a -sequence, we have
| (11) |
If we assume that the polarization angles of the continuum and Ly are the same, using the relation
| (12) |
we can separate the total polarization into contributions from the continuum and Ly:
| (13) |
where is the fraction of the continuum relative to the total light captured by the narrowband filter:
| (14) |
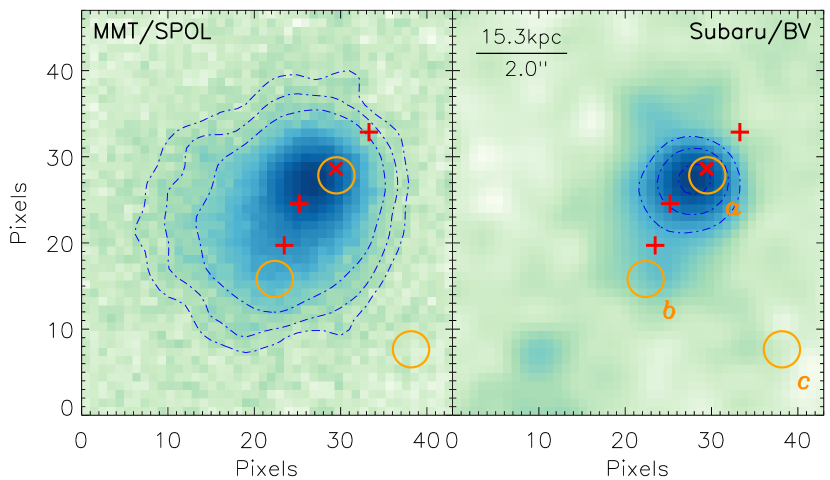
To estimate the continuum light fraction , we use a UV continuum image of B3 J2330+3927 constructed from broadband and images (Matsuda et al., 2009), which covers a rest-frame wavelength range of 980 –1450 Å. Figure 6 shows the SPOL (continuum + Ly) and the Subaru (continuum) images at the same stretch. The flux from the Ly line dominates that from the UV continuum in our narrowband filter. Using both the SPOL and Subaru images, we calculate for the same apertures where we measured the total polarization in Fig. 3. The continuum flux, which is somewhat extended along the radio lobe direction, is only 10% of the total flux at the blob’s center and drops off at larger radii.
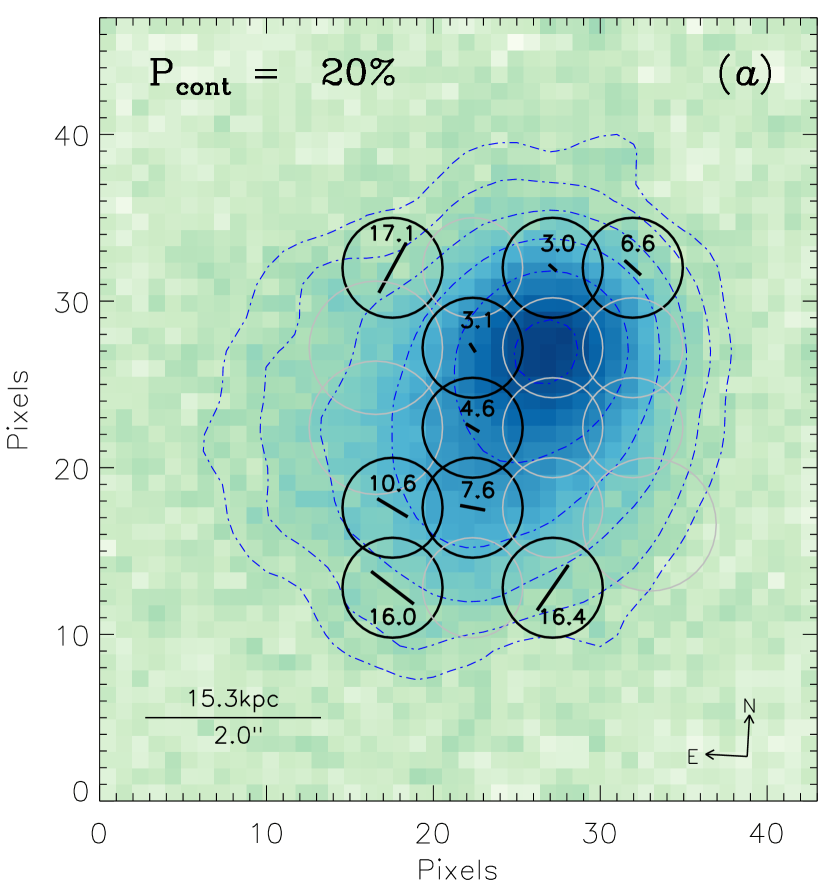
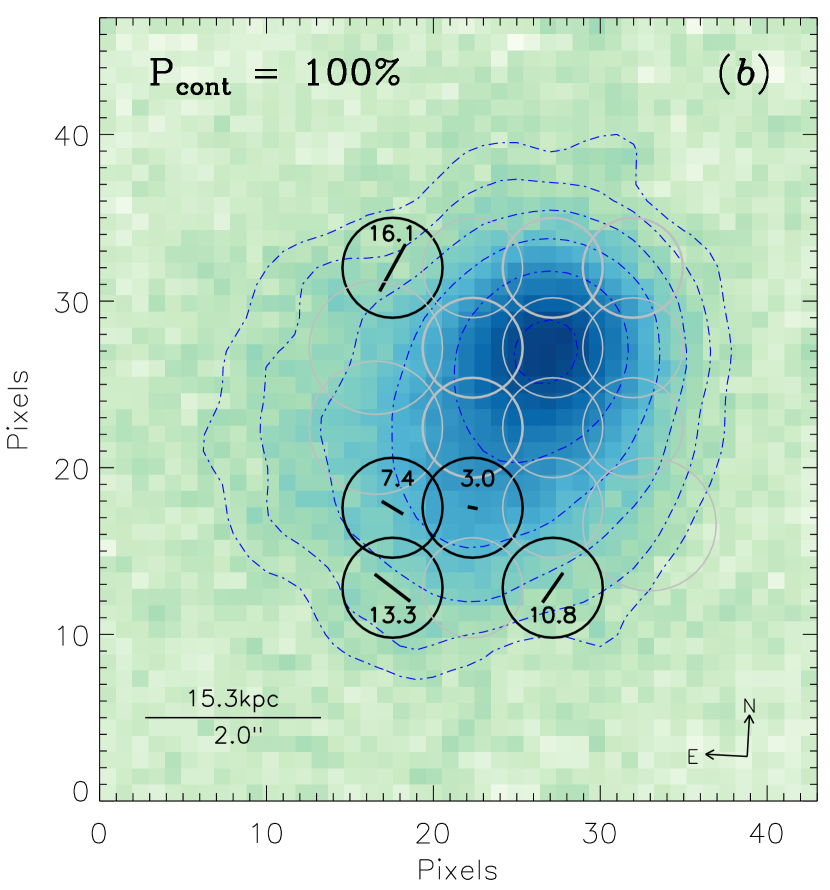
We then consider two cases to estimate the lower limit on within each aperture. First, we use Eq. (13) to determine under the highly conservative assumption that the UV continuum is 20% polarized and has a polarization direction aligned with the total polarization. A of 20% is typical of the highest values measured in radio galaxy lobes (Jannuzi & Elston, 1991; Vernet et al., 2001; Tadhunter, 2005), Even in this case (Figure 7), contributes significantly to in all nine apertures where significant is detected. The values here range from 3 to 17% at 10–25 kpc, with no significant Ly polarization detected near the blob center. Like the total polarization, the Ly polarization detections occur more often along the blob’s major axis. If we assume instead that is 100% (panel ), an assumption so extreme that it requires negative (unphysical) values for many apertures given , there remain five apertures in the southeast where is still detected at .
4.3. Physical Interpretation
From the first Ly imaging polarimetry of a radio-loud Ly nebula, B3 J2330+3927, we find that the total polarization fraction increases from 2% at the blob center to 17% at 15–25 kpc. Significant polarization is detected preferentially along the blob’s major axis at angles perpendicular to that axis. In this section, we briefly discuss the implication of our measurements. Future papers will focus on detailed comparisons with numerical models.
Imaging polarimetry is a useful tool to differentiate between a central powering geometry and an extended power source. In the former case, Ly photons are produced by a central point-source or sources (i.e., embedded star-forming galaxies or AGN) and transported to large radii. When the central source illuminates the surrounding neutral gas, the Ly photons do not experience much resonant or core scattering and escape the system via Rayleigh or wing scattering. The resultant Ly radiation is highly polarized at large radii and the polarization angle is aligned tangentially to the overall geometry of the system (Rybicki & Loeb, 1999; Dijkstra & Loeb, 2008). In contrast, in the latter case of extended emissivity, Ly photons are produced in situ in the extended gas through hydrogen recombination following ionization by photo-ionizing sources (e.g., AGNs) or superwind-driven shock-heating. Because the Ly photons have no preferential orientation with respect to the neutral medium and the observers, little or no polarization is expected.
In B3 J2330+3927, the observed high Ly polarization fraction (20% at the largest radii) and extended continuum emission suggest that Ly photons are produced in the center, instead of arising throughout the nebula itself.
Likewise, the observed increase in polarization with radius is consistent with theoretical predictions from Dijkstra & Loeb (2008) assuming a simple geometry and central source. In their expanding shell model, the Ly polarization gradient arises when photons at larger radii scatter by larger angles (closer to 90°) toward the observer. In an alternative model of an optically thick, spherically symmetric, collapsing gas cloud, the Ly radiation field becomes more anisotropic at larger radii. In other words, photons tend to propagate more radially outward prior to their last scattering events, requiring a larger scattering angle to reach the observer, and thus are more polarized.
While some of the polarization properties of B3 J2330+3927 (fractions, angles, and radial gradient) are qualitatively similar to those of SSA22-LAB1 (Hayes et al., 2011), one difference is that the significant polarization favors the major axis (and radio-jet direction). We speculate that the lack of polarization detected along the minor axis could be due to strong obscuration from an AGN torus perpendicular to the radio-jet. Another possibility is that ionization states and optical depths vary from one axis to the other due to photo-ionization along the jet or its interaction with the IGM. In this case, Ly photons can escape the system with fewer scatterings in the major axis direction. It is not known whether this polarization pattern is common for other giant Ly nebulae around high- radio galaxies. To investigate these issues further, we need deeper and higher spatial resolution observations of this system and a systematic survey of polarization for a larger sample.
5. Conclusions
We present the first narrow-band, imaging polarimetry of a Ly nebula, or “blob,” with an embedded, radio-loud AGN. The blob, B3 J2330+3927, lies at , extends over 150 kpc, and has a Ly luminosity of 2.5 erg s-1 (De Breuck et al., 2003; Matsuda et al., 2009). The AGN lies near the Ly emission peak and its radio lobes align roughly with the major axis of the blob’s extended Ly emission. Our findings are:
-
1.
We map the total (Ly plus continuum) polarization in a grid of circular apertures of radius (4.4 kpc), detecting significant () polarization in nine apertures and achieving strong upper-limits (as low as 2% in the total polarization fraction ) elsewhere.
-
2.
The gradient in the total polarization map increases from % at 5 kpc from the blob center to 17% at 15–25 kpc. The detections lie mostly along the blob’s major axis and the polarization angles are generally perpendicular to it.
-
3.
Comparing the total flux to that of the continuum, and assuming conservatively that the continuum is 20–100% polarized and aligned with the total polarization, we place lower limits on the Ly polarization fraction . Under these assumptions, is 3–17% at 10–25 kpc. No significant Ly polarization is detected at 5 kpc of the blob center. Like the total polarization, the Ly polarization detections tend to lie along the blob’s major axis.
Our polarization measurements for B3 J2330+3927 complement past polarization work, which focused on radio-quiet blobs and on radio galaxies within Ly clouds. For example, the polarization of SSA22–LAB1 is not measurable at its center, but rises to 10% at 30 kpc and to 20% at 45 kpc, forming an almost complete polarized ring (Hayes et al., 2011). While the polarization that we detect in B3 J2330+3927 is also tangentially-oriented and outside the blob center (and AGN), it is generally significant only along the blob’s major axis (and radio lobe direction).
Unlike previous studies, we have constrained and mapped the Ly contribution to the total polarization. The one spectro-polarization measurement isolating the Ly line in a radio-loud Ly blob also reveals its polarization fraction to be high (16%) and perpendicular to the radio lobe axis in a region 10–40 kpc from the nucleus, at least on one side of the nebula (Humphrey et al., 2013). Such a high has not been observed in radio galaxies (e.g., Dey et al., 1997; Cimatti et al., 1998), which might imply a physical difference or arise from being measured on smaller physical scales. Spatially-resolved measurements of for a larger sample of radio galaxies are required to discriminate between these scenarios.
A direct comparison of our narrow-band, imaging polarimetry in B3 J2330+3927 with our on-going survey of Ly blobs without known AGN and with radio-quiet AGN will improve greatly our understanding of the mysterious source of their extended Ly emission.
References
- Beck et al. (2016) Beck, M., Scarlata, C., Hayes, M., Dijkstra, M., & Jones, T. J. 2016, ApJ, 818, 138
- Cimatti et al. (1998) Cimatti, A., di Serego Alighieri, S., Vernet, J., Cohen, M., & Fosbury, R. A. E. 1998, ApJ, 499, L21
- De Breuck et al. (2003) De Breuck, C., Neri, R., Morganti, R., et al. 2003, A&A, 401, 911
- Dey et al. (1997) Dey, A., van Breugel, W., Vacca, W. D., & Antonucci, R. 1997, ApJ, 490, 698
- Dey et al. (2005) Dey, A., Bian, C., Soifer, B. T., et al. 2005, ApJ, 629, 654
- Dijkstra & Loeb (2008) Dijkstra, M., & Loeb, A. 2008, MNRAS, 386, 492
- Faucher-Giguère et al. (2010) Faucher-Giguère, C.-A., Kereš, D., Dijkstra, M., Hernquist, L., & Zaldarriaga, M. 2010, ApJ, 725, 633
- Fardal et al. (2001) Fardal, M. A., Katz, N., Gardner, J. P., et al. 2001, ApJ, 562, 605
- Ficarra et al. (1985) Ficarra, A., Grueff, G., & Tomassetti, G. 1985, A&AS, 59, 255
- Goerdt et al. (2010) Goerdt, T., Moore, B., Read, J. I., & Stadel, J. 2010, ApJ, 725, 1707
- Haiman et al. (2000) Haiman, Z., Spaans, M., & Quataert, E. 2000, ApJ, 537, L5
- Hayes et al. (2011) Hayes, M., Scarlata, C., & Siana, B. 2011, Nature, 476, 304
- Humphrey et al. (2013) Humphrey, A., Vernet, J., Villar-Martín, M., et al. 2013, ApJ, 768, L3
- Ivison et al. (2012) Ivison, R. J., Smail, I., Amblard, A., et al. 2012, MNRAS, 425, 1320
- Jannuzi & Elston (1991) Jannuzi, B. T., & Elston, R. 1991, BAAS, 23, 1334
- Loeb & Rybicki (1999) Loeb, A., & Rybicki, G. B. 1999, ApJ, 524, 527
- Matsuda et al. (2004) Matsuda, Y., Yamada, T., Hayashino, T., et al. 2004, AJ, 128, 569
- Matsuda et al. (2005) Matsuda, Y., et al. 2005, ApJ, 634, L125
- Matsuda et al. (2009) Matsuda, Y., Nakamura, Y., Morimoto, N., et al. 2009, MNRAS, 400, L66
- McCarthy et al. (1987) McCarthy, P. J., van Breugel, W., Spinrad, H., & Djorgovski, S. 1987, ApJ, 321, L29
- McCarthy (1993) McCarthy, P. J. 1993, ARA&A, 31, 639
- Mori et al. (2004) Mori, M., Umemura, M., & Ferrara, A. 2004, ApJ, 613, L97
- Pérez-Torres & De Breuck (2005) Pérez-Torres, M.-A., & De Breuck, C. 2005, MNRAS, 363, L41
- Prescott et al. (2008) Prescott, M. K. M., Kashikawa, N., Dey, A., & Matsuda, Y. 2008, ApJ, 678, L77
- Prescott et al. (2011) Prescott, M. K. M., Smith, P. S., Schmidt, G. D., & Dey, A. 2011, ApJ, 730, L25
- Prescott et al. (2012) Prescott, M. K. M., Dey, A., Brodwin, M., et al. 2012, ApJ, 752, 86
- Rosdahl & Blaizot (2012) Rosdahl, J., & Blaizot, J. 2012, MNRAS, 423, 344
- Rybicki & Loeb (1999) Rybicki, G. B., & Loeb, A. 1999, ApJ, 520, L79
- Sahai et al. (1998) Sahai, R., Hines, D. C., Kastner, J. H., et al. 1998, ApJ, 492, L163
- Schmidt et al. (1992a) Schmidt, G. D., Elston, R., & Lupie, O. L. 1992, AJ, 104, 1563
- Schmidt et al. (1992b) Schmidt, G. D., Stockman, H. S., & Smith, P. S. 1992, ApJ, 398, L57
- Serkowski (1973) Serkowski, K. 1973, Interstellar Dust and Related Topics, 52, 145
- Shawl & Tarenghi (1976) Shawl, S. J., & Tarenghi, M. 1976, ApJ, 204, L25
- Steidel et al. (2000) Steidel, C. C., Adelberger, K. L., Shapley, A. E., et al. 2000, ApJ, 532, 170
- Steidel et al. (2011) Steidel, C. C., Bogosavljević, M., Shapley, A. E., et al. 2011, ApJ, 736, 160
- Tadhunter (2005) Tadhunter, C. 2005, Astronomical Polarimetry: Current Status and Future Directions, 343, 457
- Taniguchi & Shioya (2000) Taniguchi, Y., & Shioya, Y. 2000, ApJ, 532, L13
- Trebitsch et al. (2016) Trebitsch, M., Verhamme, A., Blaizot, J., & Rosdahl, J. 2016, arXiv:1604.02066
- van Dokkum (2001) van Dokkum, P. G. 2001, PASP, 113, 1420
- Vernet et al. (2001) Vernet, J., Fosbury, R. A. E., Villar-Martín, M., et al. 2001, A&A, 366, 7
- Vigotti et al. (1989) Vigotti, M., Grueff, G., Perley, R., Clark, B. G., & Bridle, A. H. 1989, AJ, 98, 419
- Villar-Martín et al. (2003) Villar-Martín, M., Vernet, J., di Serego Alighieri, S., et al. 2003, MNRAS, 346, 273
- Yang et al. (2009) Yang, Y., Zabludoff, A., Tremonti, C., Eisenstein, D., & Davé, R. 2009, ApJ, 693, 1579
- Yang et al. (2010) Yang, Y., Zabludoff, A., Eisenstein, D., & Davé, R. 2010, ApJ, 719, 1654
- Yang et al. (2011) Yang, Y., Zabludoff, A., Jahnke, K., et al. 2011, ApJ, 735, 87
- Yang et al. (2014a) Yang, Y., Walter, F., Decarli, R., et al. 2014, ApJ, 784, 171
- Yang et al. (2014b) Yang, Y., Zabludoff, A., Jahnke, K., & Davé, R. 2014, ApJ, 793, 114