Detection of High Energy Cosmic Rays at the Auger Engineering Radio Array
Abstract:
Detection of (ultra-) high-energy cosmic rays with the use of radio frequency emission from extensive air showers has been proven as complimentary to existing ground array detection techniques. Great progress has been made in the understanding of the emission processes and in their Monte Carlo modelling. These have led to experimental results, notably also at the Auger Engineering Radio Array, on energy, angular and mass composition resolution of the primary cosmic rays. Recent results are reported. The measured resolutions turn out to be competitive with existing techniques and they have independent uncertainties. Implications for cross-calibration with existing techniques and for future large-scale applications of radio detection of ultra-high-energy cosmic rays are discussed.
1 Ultra-High-Energy Cosmic Rays and the Pierre Auger Observatory
The Pierre Auger Observatory [1] consists of a 3000 km2 area near Malargüe, Argentina, covered by more than 1660 water-Cherenkov stations in an hexagonal grid with 1.5 km spacing. The area is surrounded by four telescope stations, with 6 fluorescence telescopes each. Near one of the telescope stations, there is an area with several enhancements, including a higher water-Cherenkov station density, underground muon detectors and a radio detector array. The latest results on ultra-high-energy cosmic rays from the Telescope Array Collaboration [2] and the Pierre Auger Observatory [3] have been presented at this conference. In this contribution, the new technique of radio detection of cosmic rays is discussed, mostly based on the results of the Auger Engineering Radio Array (AERA) [1]. The basic quantities that can be measured of a cosmic ray are its energy, arrival direction, and particle type. The latter is also referred to as composition or mass of the cosmic ray.
2 Radio Detection of Cosmic Rays
When an extensive air shower develops it emits electromagnetic radiation,
with an important part of the spectrum in the 10-100 MHz range. For short this
is called radio emission.
There are two contributing emission mechanisms:
geomagnetic emission due to the deflection of the electrons and positrons when traversing
the Earth magnetic field,
and emission due to charge separation in the shower that is caused by the ionisation electrons that
tend to move with the shower front, leaving behind the positively
charged ions and the annihilation of the positrons in the shower. The geomag-

netic emission has the same polarisation at all points in space, perpendicular to the Earth magnetic field () and the shower axis (), the direction. The charge separation emission is polarised radially towards the shower axis. The emission occurs in a long path along the shower axis. This causes additional interference between early and late emission due to the finite refractivity of air for radio waves, resulting in a Cherenkov cone structure of the signal around the show axis. The two emission contributions interfere by vector addition in any given point in space, resulting in an asymmetric signal pattern around the shower axis. Both the Cherenkov ring in the signal amplitude, as well as the asymmetry around the shower axis are illustrated by a measurement presented in Fig. 1.
3 The Auger Engineering Radio Array
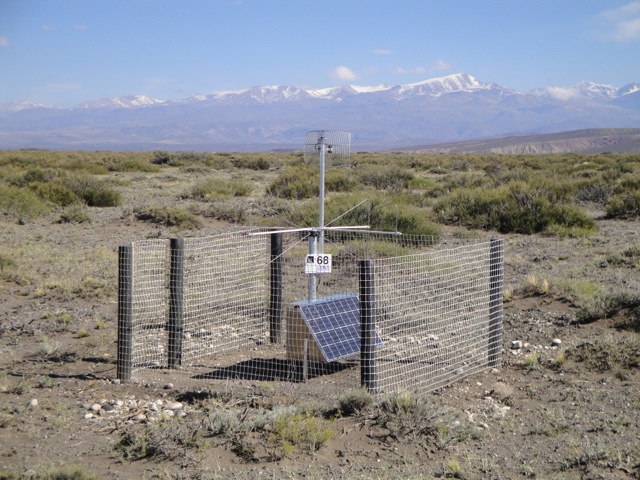

The Auger Engineering Radio Array consists of dipole antennas with the appropriate length to receive 30-80 MHz radiation. The left hand side of Fig. 2 shows the butterfly design, which applies to the majority of the stations in the array. Each detector station has digitizing electronics, is autonomously powered by a solar panel and battery, and communicates wirelessly. A GPS receiver takes care of a time stamp with an event.
The array was built in three phases: first 24 Log-Periodic Dipole Antennas (LPDA) were set up at relative small interstation spacing, shown as the red triangles in Fig. 2 on the right. In a second phase, butterfly antennas were added with two different electronics designs, one aimed at external triggering by the Auger surface and fluorescence detectors (blue triangles pointing down in Fig. 2) and one aimed primarily at self-triggering (open triangles in Fig. 2). In a third phase antennas were added recently at larger interstation spaces (blue triangles pointing right in Fig. 2), bringing the total number of antennas deployed in the array to 153 detector stations.
The signal voltage in a 30-80 MHz frequency window is determined from the digital time trace using a Hilbert envelope. Within the frequency window some frequency bands with anthropogenic noise are suppressed. The measured signal voltage is related to the electric field of the radio emission by , where is the antenna pattern for the polarisation directions 1 and 2. The antenna pattern can be calibrated by antenna simulation, by calibration with a point source, and by using the galactic center that emits radio frequency signals. All these calibration methods are being used in AERA. The energy density in eV/m2 is then measured by integrating the electric field squared over a signal window from to and subtracting a similar integral over a signal-free background time window preceding the signal from to : , where is the dielectric constant in vacuum, the speed of light and the width of the time bins.
4 Results
4.1 Emission Mechanisms
The good agreement of the predictions of the signal distribution compared to data such as presented in Fig. 1 shows that the emission mechanisms, their interference, and the propagation through the atmosphere of the radiation are well understood.
The two emission mechanisms may be disentangled using the polarization pattern in the - plane. The total electric field is given by , with G and C denoting the geomagnetic and charge excess components, respectively. The geomagnetic emission is proportional to the angle of the shower axis with the geomagnetic field . The average charge excess signal relative to the geomagnetic signal is then found as . For a certain selection of AERA events [5], , a small but non-negligible contribution.
4.2 Energy Measurement
For the energy measurement the signal is fit by an heuristic parametrisation that reproduces the the lateral distribution well .
The parameters are obtained from Monte Carlo simulation and are fixed for all data events. The core position of the shower, , the total signal strength , and a measure of the width of the shower, , are fit for each shower. See Fig. 1 for such a fit on an event measured in the LOFAR observatory. The total energy in the radio frequency emission in the 30-80 MHz range for each events is then obtained as . To first order the contributions of the charge excess emission cancel out in the integral and the total signal strength is determined by the geomagnetic emission.
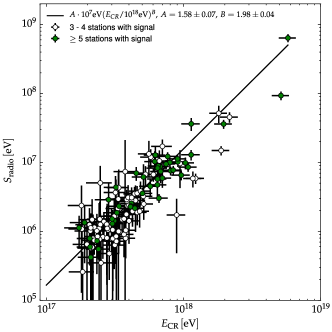
The comparison of the total energy measured in the radio signal to the energy observed by the fluorescence detectors of the Pierre Auger Observatory is shown in Fig. 3. From the slope in this figure it is measured that the total measured radio frequency emission energy as a function of the cosmic-ray energy, and the Earth magnetic field strength, , is given by , where the dominant systematic uncertainties are in nearly equal amount due to the uncertainty in the unfolding of the antenna pattern and energy scale uncertainty of the fluorescence detector [6]. The shower-to-shower uncertainty in the energy measurement from the radio signal is estimated to be 22% when at least three radio detector station are contributing to the measurement, going down to 17% for showers with five or more detector stations contributing to the fit [6].
Work is progressing to relate the energy of the extensive air shower to the energy in radio emission. This potentially allows an absolute calibration of cosmic ray energy that is completely independent from the fluorescence detectors and even may allow to fix the absolute energy scale of the fluorescence detector to a much better precision than currently known.
4.3 Direction Measurement
The arrival direction of the cosmic ray is determined by the direction perpendicular to the shower plane,
which requires excellent relative detector station timing.
This relative timing is calibrated and tracked using the signal from a beacon that is installed
on the nearby fluorescence telescope building. The beacon emits at four fixed
frequencies, causing a beat signal with period 1100 ns.
The relative station time is calibrated
to the
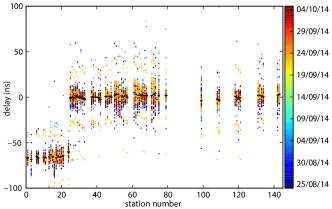
phase of this beat signal with respect to one chosen station [7]. Some air planes that emit signals in the 30-80 MHz range were used as point sources, because their position in time can be precisely followed. From these signal pulses, the relative timing of the stations was checked, as illustrated in Fig. 4. This figure shows that the timing resolution is of the order of a nanosecond for individual measurements. This procedure also revealed a fixed time offset between the LPDA and butterfly antennas of which the origin is not yet understood [7]. With a timing resolution of 1 ns an angular resolution for the cosmic ray of about is theoretically possible. The airplanes were tracked with a precision better than .
4.4 Particle Type Measurement
The primary observable to discern the different particle types of cosmic rays is the penetration depth in the atmosphere or position where the shower contains the maximum number of particles, , which is measured in g/cm2. So far only measurements from the fluorescence detector have been published. For the radio signal, several features of the signal pattern on the ground are sensitive to or the nucleus type of the cosmic ray. Using the lateral energy density profile, the width of the shower is the feature that is most sensitive to . In LOFAR, a method using the quality of the fit of the Monte Carlo simulations to the data for various trails has been developed [4].


This method has also been applied to AERA data in [8], where a comparison was made to the that was found for the same showers using the fluorescence detector. In Fig. 5 this comparison is shown. It results in a resolution of about 42 g/cm2.
Another method to determine the from radio signals uses the spectral index from each individual detector station [9]. The results from the individual stations are then combined into a result for the shower. On the right in Fig. 5 the uncertainty of this spectral index method is shown as a function of the number of active detector stations, and can get as good 40 g/cm2.
A third method that uses the arrival time at each radio detector to accurately fit the curved wave front, thereby allowing one to infer the position of is under study in AERA. The three methods use independent information and can be compared to study systematic uncertainties and combined to deliver better accuracy.
4.5 Horizontal Showers
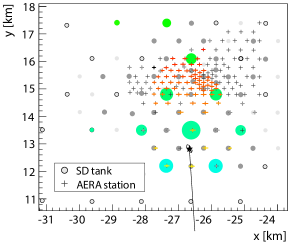
Radio detectors are also sensitive to horizontal showers, which make them also well suited for ultra-high-energy neutrino detection. As a proof of principle, horizontal showers in AERA have been shown in [10]. Figure 6 shows such an event with a zenith angle of 74.4∘ that produced a very elongated footprint, hitting 69 radio detector stations. Such showers can also be well reproduced with CoREAS simulations [10, 11].
5 Conclusion and Future Developments
Radio detection of cosmic rays has been established as a viable technique to measure the energy, direction, and particle type of (ultra-) high-energy cosmic rays. The signal emission has been understood and is well modelled in several Monte Carlo codes [11, 12, 13]. The one fundamental property that still has to be understood is the efficiency of the detection method.
For future large-scale applications, e.g. for ultra-high-energy neutrino detection [14], in addition to establishing the detection efficiency, more work is needed to make a robust trigger on the radio data alone. Also major effort still has to be put into making the detector station more robust and much cheaper. For the moment there are no apparent show stoppers to achieve these goals.
References
-
[1]
A. Aab et al., The Pierre Auger Collaboration,
The Pierre Auger Cosmic Ray Observatory,
NIM A798 (2015) 172.
-
[2]
C. Jui for the Telescope Array Collaboration,
Results from the Telescope Array Experiment,
These Proceedings.
-
[3]
O. Deligny for the Pierre Auger Collaboration,
Latest Results from the Pierre Auger Observatory,
These Proceedings.
-
[4]
S. Buitink et al.,
Method for high precision reconstruction of air shower
using two-dimensional radio intensity profiles, Phys. Rev. D90 (2014) 082003.
-
[5]
A. Aab, The Pierre Auger Collaboration,
Probing the radio emission from cosmic-ray-induced air showers by polarization measurements,
Phys. Rev. D89 (2014) 052002.
-
[6]
A. Aab, The Pierre Auger Collaboration,
Measurement of the Radiation Energy in the Radio Signal of Extensive Air Showers
as a Universal Estimator of Cosmic-Ray Energy,
Phys. Rev. Lett. 116 (2016) 241101;
A. Aab, The Pierre Auger Collaboration,
Energy Estimation of Cosmic Rays with the Engineering Radio Array
of the Pierre Auger Observatory,
Phys. Rev. D93 (2016) 122005.
-
[7]
A. Aab et al., The Pierre Auger Collaboration,
Nanosecond-level time synchronization of autonomous radio detector stations using
a reference beacon and commercial airplanes,
JINST 11 (2016) P01018.
-
[8]
J. Schulz, Cosmic Radiation—Reconstruction of Cosmic-Ray Properties from Radio
Emission of Extensive Air Showers, PhD thesis, Radboud University Nijmegen,
February 2016, ISBN 978-94-028-0017-3.
-
[9]
S. Jansen, Radio for the Masses—Cosmic ray mass composition measurements
in the radio frequency domain,
PhD thesis, Radboud University Nijmegen, April 2016, ISBN 978-94-028-0073-9.
-
[10]
O. Kambeitz for the Pierre Auger Collaboration,
Measurement of horizontal air showers with the Auger Engineering Radio Array,
To appear in Proc. ARENA2016 Conf., Groningen, 7–10 June 2016,
[arXiv:1609.05456];
O. Kambeitz ,
Weiterentwicklung der Radiodetektionstechnik für kosmische
Strahlung höchster Energien,
PhD thesis, Karlsruhe Institute of Technology,
June 2016, DOI(KIT):10.5445/IR/1000055758.
-
[11]
T. Huege, M. Ludwig, and C.W. James,
Simulating radio emission from air showers with CoREAS,
AIP Conf. Proc. 1535 (2013) 128.
-
[12]
J. Alvarez-Mu iz, W. R. Carvalho Jr., E. Zas,
Monte Carlo simulations of radio pulses in atmospheric showers using ZHAireS,
Astropart. Phys. 35 (2012) 325.
-
[13]
K. Werner and O. Scholten,
Macroscopic Treatment of Radio Emission from Cosmic Ray Air Showers based on Shower
Simulations, Astropart. Phys. 29 (2008) 393;
K. Werner and O. Scholten,
The EVA code: macroscopic modeling of radio emission from air showers based on full
MC simulations including a realistic index of refraction,
AIP Conf. Proc. Vol. 1535 No.1 (2013) 133.
-
[14]
O. Martineau-Huynh, et al., The Giant Radio Array for Neutrino Detection,
in proceedings of ICRC2015,
\posPoS(ICRC2015)1143.