An estimate of the magnetic field strength associated with a solar coronal mass ejection from low frequency radio observations
Abstract
We report ground based, low frequency heliograph (80 MHz), spectral (85-35 MHz) and polarimeter (80 and 40 MHz) observations of drifting, non-thermal radio continuum associated with the ‘halo’ coronal mass ejection (CME) that occurred in the solar atmosphere on 2013 March 15. The magnetic field strengths () near the radio source were estimated to be G at 80 MHz and G at 40 MHz. The corresponding radial distances () are (80 MHz) and (40 MHz).
1 Introduction
It is known that intense, long-lasting (tens of minutes to hours) non-thermal radio continuum are observed sometimes in association with the flares and CMEs in the solar atmosphere. Boischot (1957) had designated these events as type IV bursts. Further studies showed that there are two classes of type IV bursts: The first variety occurs after the impulsive phase of the flares and drifts in the spectrum to lower frequencies. Interferometer observations indicate that the radio source exhibits outward movement through the solar atmosphere with speeds in the range 200 - 1500 . Emission can be observed even when the source is located at large radial distances ( above the plasma level corresponding to the frequency of observation. The sources have low directivity and are partially circularly polarized. The sense of polarization correspond usually to the extraordinary mode (e-mode) of the magneto-ionic theory. These are called the moving type IV (type IVm) bursts. The second variety, called the stationary type IV bursts (type IVs), appear near the flare site during the impulsive phase at frequencies 300 MHz and in the post-flare phase at lower frequencies. The type IVs burst is characterized by a source whose position does not change and which is located close to or slightly above the plasma level corresponding to the frequency of observation. The emission is circularly polarized usually in the ordinary mode (o-mode) of the magneto-ionic theory. The cone of emission is narrow since type IVs bursts are rarely observed when the associated flare is near the limb of the Sun. The high directivity, location close to the plasma level, and the presence of fine structures suggest that the emission mechanism is related to the plasma frequency. The type IVs bursts at low frequencies may occur with or without a type IVm burst (Pick, 1961; Boischot & Pick, 1962; Weiss, 1963; Wild et al., 1963; Stewart, 1985; Aurass et al., 2005; Pick, 2008).
Compared to the type IVs bursts, the type IVm are more closely associated with the CMEs. It is also possible to infer the CME magnetic field using them. Gergely (1986) had noted that 5% of all CMEs are associated with type IVm bursts and % of type IVm bursts are associated with CMEs. But only a few estimates of the field strength have been reported in the literature. One of the reasons for this is the non-availability of simultaneous white light and radio observations close to the Sun (), and the relatively rare occurrence of the type IVm bursts White (2007). The bursts have been explained using either second harmonic plasma emission (Duncan, 1981; Stewart et al., 1982b; Gopalswamy & Kundu, 1989b; Kundu et al., 1989; Ramesh et al., 2013) or optically thin non-thermal gyro-synchrotron emission (Gopalswamy & Kundu, 1989a; Bastian & Gary, 1997; Bastian et al., 2001; Maia et al., 2007; Tun & Vourlidas, 2013) in the past. Using simultaneous whitelight, radio heliograph, radio polarimeter and radio spectral observations we have presented arguments to show that the type IVm burst associated with the ‘halo’ CME event of 2013 March 15 can be explained on the basis of non-thermal gyro-synchrotron emission and estimated the magnetic field strength near the source region of the burst.
2 Observations
The radio data were obtained on 2013 March 15 at 80 MHz with the Gauribidanur RAdioheliograPH (GRAPH; Ramesh et al., 1998; Ramesh et al., 1999a, b, 2006a) in the imaging mode, the Gauribidanur Radio Interference Polarimeter (GRIP; Ramesh et al., 2008) at 80 MHz and 40 MHz in the transit mode, and over the 85 - 35 MHz band with the Gauribidanur LOw frequency Solar Spectrograph (GLOSS; Ebenezer et al., 2001; Ebenezer et al., 2007; Kishore et al., 2014) in the spectral mode. All the aforementioned instruments are located in the Gauribidanur radio observatory111http://www.iiap.res.in/centers/radio, about 100 km north of Bangalore in India (Ramesh, 2011a). The co-ordinates of the array are Longitude = East, and Latitude = North. The GRAPH produces two dimensional images of the solar corona with an angular resolution of (Right Ascension, R.A. Declination, decl.) at 80 MHz. The integration time and the bandwidth of observation are 250 ms 2 MHz, respectively. GRIP is an east-west one-dimensional interferometer array and observes the circularly polarized flux density from the ‘whole’ Sun at 80 MHz and 40 MHz simultaneously. Linear polarization, if generated at the correspoding radio source region in the solar atmosphere, is presently difficult to detect at low radio frequencies because of the differential Faraday rotation of the plane of polarization within the typical observing bandwidths (Grognard & McLean, 1973). The GRIP has a broad response pattern (‘beam’) compared to the Sun in both R.A./east-west direction ( at 80 MHz) and decl./north-south direction (). So observations with the GRIP in the transit mode essentially reproduces its ‘east-west beam’ with amplitude proportional to the intensity of the emission from the ‘whole’ Sun, weighted by the antenna gain in the corresponding direction. The integration time and the observing bandwidth are the same as the GRAPH. The respone pattern of the GLOSS is very broad, () and hence the Sun is a point source for the latter. The integration time and the observing bandwidth are comparatively smaller here, 100 ms and 300 kHz (at each frequency), respectively. The width of the response pattern of the GLOSS in R.A. (i.e. hour angle) is nearly independent of frequency. The Sun is a point source for both the GRIP and the GLOSS. The optical data were obtained with the Large Angle and Spectrometric Coronagraph (LASCO; Brueckner et al., 1995) onboard the Solar and Heliospheric Observatory (SOHO), COR1 coronagraph of the Sun-Earth Connection Coronal and Heliospheric Investigation (SECCHI; Howard et al., 2008) onboard the Solar TErrestrial RElations Observatory (STEREO), and in 193 Å with the Atmospheric Imaging Assembly (AIA; Lemen et al., 2012) onboard the Solar Dynamics Observatory (SDO).
Figure 1 shows the dynamic spectrum obtained with the GLOSS on 2013 March 15 during the interval 06:15 - 08:15 UT in the frequency range MHz. Two types of enhanced radio emission with differing spectral characteristics are simultaneously noticeable in the spectrum: 1) a weak stationary continuum during the period 06:30 - 08:10 UT with fine structures, and 2) a comparatively intense patch of continuum drifting from 85 MHz to 35 MHz during the period 06:55 - 07:50 UT. The fine structures in the background of the latter are most likely part of the ongoing stationary continuum during the same interval. The stationary and the drifting continuum described above are the typical spectral signatures of the type IVs and type IVm bursts in the solar atmosphere, respectively (Stewart, 1985). The average duration () of the type IVm burst in Figure 1 increases with decreasing frequency. The increase in the temporal width with decrease in frequency of the region enclosed between the ‘black’ lines from 85 MHz to 35 MHz in the spectrum indicates this. The typical widths (i.e. duration) are 25 min and 45 min at 85 MHz and 35 MHz, respectively. These are consistent with the statistical results on the duration of type IVm bursts reported by Robinson (1978). The onset of the burst at 85 MHz is 06:55 UT and at 35 MHz is 07:05 UT.
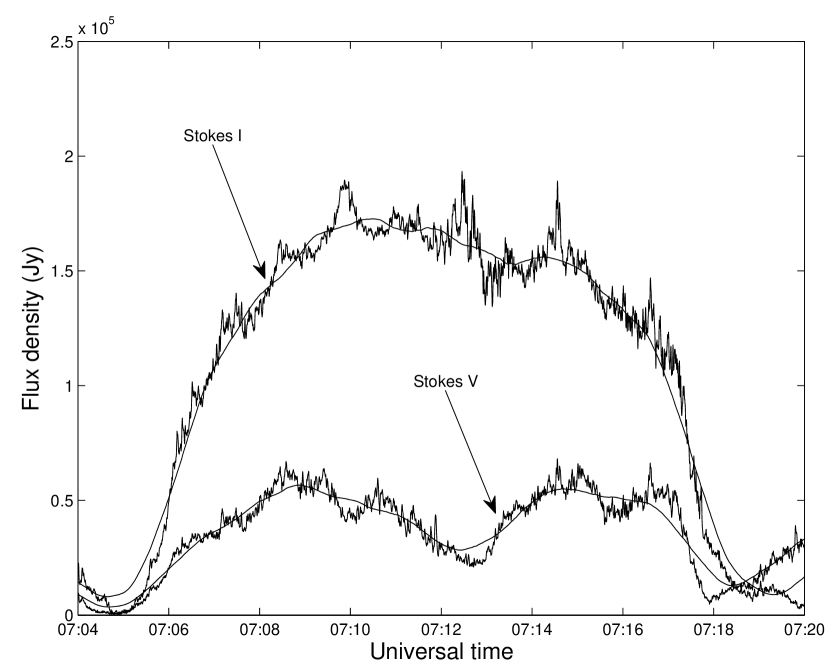
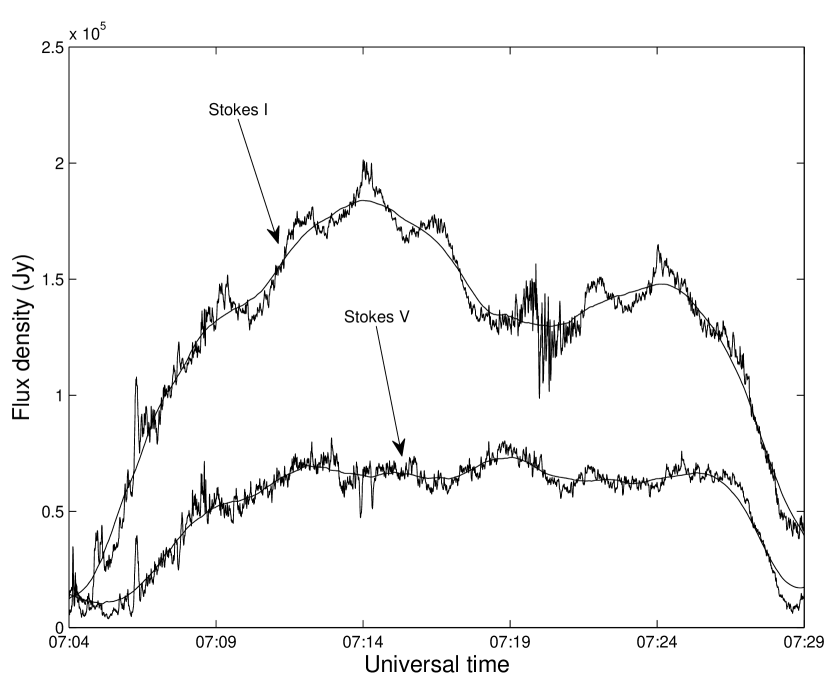
Figure 2 shows the time profile of the Stokes I & V radio emission from the solar corona at 80 MHz as observed with the GRIP on 2013 March 15. Similar observations at 40 MHz are shown in Figure 3. The observations were carried out in the transit mode and hence the observed time profile and their duration essentially corresponds to the east-west response pattern of the GRIP. The peak flux densities, estimated using the polynomial fit to the observations (see the overplotted smooth line in Figures 2 and 3), are 170,000 Jy (Stokes I) and 50,000 Jy (Stokes V) at 80 MHz, and 181,000 Jy (Stokes I) and 62,000 Jy (Stokes V) at 40 MHz. These values correspond mostly to that of the type IVm burst alone since we had subtracted the corresponding mean flux densities of the background type IVs burst fine structures using GRIP observations of the same outside the type IVm burst period. The respective values for the type IVs bursts are 110,000 Jy (Stokes I) and 53,000 Jy (Stokes V) at 80 MHz, and 117,000 Jy (Stokes I) and 61,000 Jy (Stokes V) at 40 MHz. That the flux density of particularly the Stokes I emission for the type IVs burst is a significant fraction of that of the type IVm burst in the present case is noticeable from their contrast with respect to the background in Figure 1 also. The 80 MHz flux densities are reasonably consistent with that reported earlier (Kai, 1969). The spectral index () between 40 MHz and 80 MHz for the type IVm burst using the above Stokes I flux densities is . Since the non-thermal spectral index is generally (Kraus, 1986; Subramanian & Sastry, 1988), the above value indicates that the observed emission in the present case is of non-thermal origin. The estimated degree of circular polarization () of the type IVm burst in Figures 2 and 3 are at 80 MHz and at 40 MHz. Note that due to instrumental limitations, we observed only with the GRIP and hence = /I in the present case.
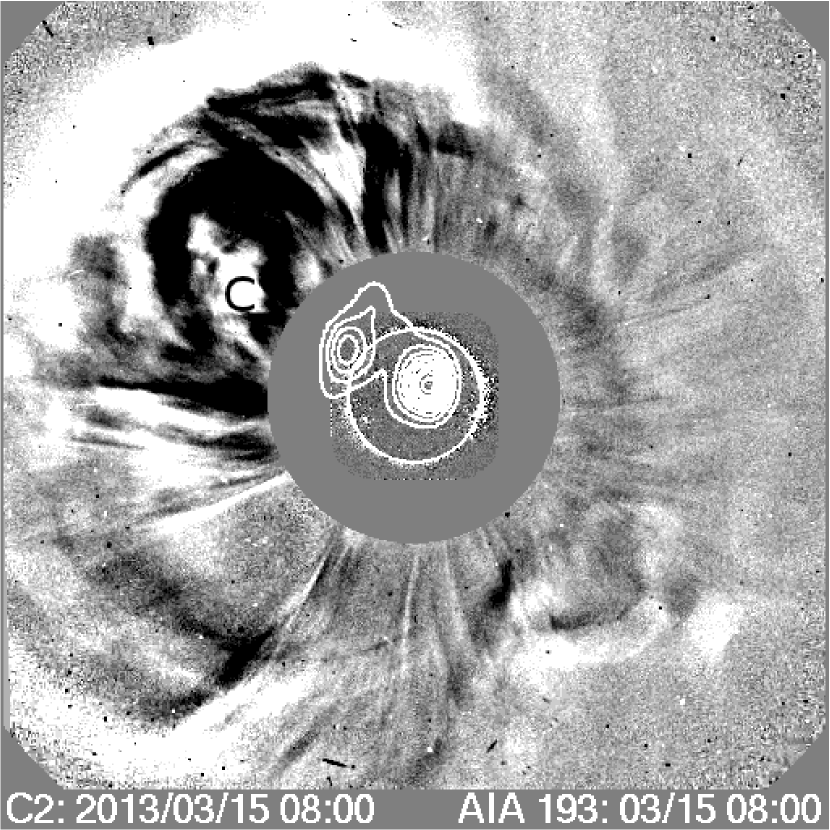
The above radio events were associated with a M1.1 class GOES soft X-ray flare during the interval 05:46 - 08:35 UT with peak at 06:58 UT, a 1F class H flare during the interval 06:13 - 08:33 UT with peak at 06:37 UT from the active region AR 11692 located at N11E12 on the solar disk222swpc.noaa.gov/warehouse/2013.html, and a ‘halo’ CME333umbra.nascom.nasa.gov/lasco/observations/halo/2013/130315. Figure 4 shows the composite of the GRAPH radioheliogram at 80 MHz, the SOHO-LASCO C2 image and the SDO-AIA 193 Å image, all obtained around 08:00 UT. Since the observations were during the type IVs burst period in Figure 1, the discrete radio source near the disk center is most likely the source region of the type IVs burst. Its peak brightness temperature () is K. Further details about the type IVs burst shall be reported elsewhere. We will limit ourselves to the type IVm burst in the rest of this paper. We would like to mention here that no GRAPH observations were available during the type IVm burst in Figure 1. The discrete source close to the limb in the north east quadrant in Figure 4 is presumably weak non-thermal radio noise storm activity often observed near the location of a CME in its aftermath (Kerdraon et al., 1983; Kathiravan et al., 2007). The peak of the source is K.
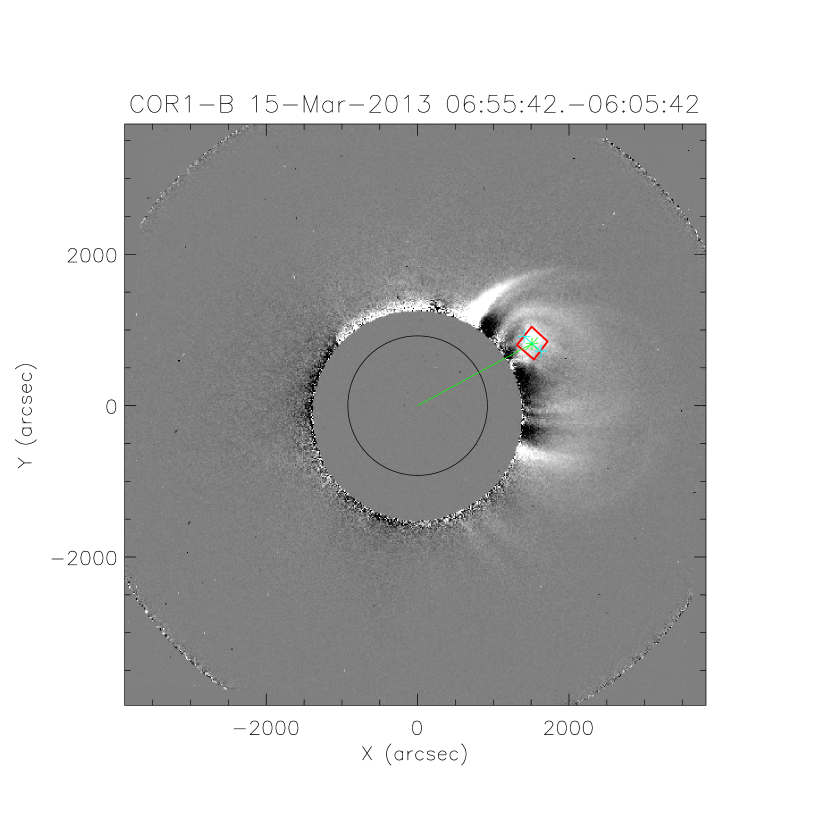
From the movies of the ‘halo’ CME, we find that the its leading edge (LE) was first observed in the STEREO-COR1B field of view (FOV) around 06:15 UT at . Later, at the onset time of the type IVm burst at 85 MHz around 06:55 UT (Figure 1), the LE was at . This gives a projected linear speed of for the CME LE. The SOHO-LASCO height-time (h-t) measurements indicate that the CME LE was located at around 07:12 UT444cdaw.gsfc.nasa.gov. These values are consistent with those extrapolated using the STEREO-COR1B measurements. We estimated the projected linear speed of the ejecta that moved outwards behind the CME LE observed in the STEREO-COR1B FOV (see the asterix marked feature in Figure 5). The centroid of the ejecta was at during its first appearance at 06:45 UT. Ten minutes later, i.e. at 06:55 UT close to the onset time of the type IVm burst at 85 MHz, the ejecta was at (see Figure 5). The above h-t measurements give a speed of for the ejecta. This is nearly the same as the speed estimated using SOHO-LASCO C2 observations of the same ejecta during 07:24 - 08:24 UT (see Figure 4). It appears from Figures 4 and 5 that the ejecta is close to the plane of the sky for both STEREO-COR1B and SOHO-LASCO C2. The close agreement between the measured projection speeds of the CME LE and the ejecta with the above two instruments indicate that the ejecta moved at the same angle to the Sun-Earth and Sun-STEREO/B lines. As STEREO-B and Earth were separated by an angle of about at the time of the event, we estimate this angle to be . So the angle between the ejecta and the plane of the sky for STEREO-COR1B or SOHO-LASCO C2 is .
Any error in the position/size of the type IVs burst in Figure 4 due to propagation effects in the solar corona and the Earth’s ionosphere is expected to be minimal () because: 1) positional shifts due to refraction in the ionosphere is expected to be at 80 MHz in the hour angle range 2h (Stewart & McLean, 1982a). The local noon at Gauribidanur on 15 March 2013 was around 07:00 UT and the GRAPH observations described above are within the above hour angle range; 2) the effects of scattering are considered to be small at 80 MHz compared to lower frequencies (Aubier, Leblanc & Boischot, 1971; Bastian, 2004; Ramesh et al., 2006b). High angular resolution observations establishing that discrete radio sources of angular size are present in the solar atmosphere from where radio emission at low frequencies originate (Kerdraon, 1979; Lang & Willson, 1987; Willson et al., 1998; Ramesh et al., 1999b; Ramesh & Sastry, 2000; Ramesh & Ebenezer, 2001; Mercier et al., 2006; Kathiravan et al., 2011; Ramesh et al., 2012), ray tracing calculations indicating that the turning points of the rays that undergo irregular refraction in the solar corona nearly coincide with the location of the plasma (‘critical’) layer in the non-scattering case even at high frequencies like 73.8 MHz (Thejappa & MacDowall, 2008), that the maximal positional shift (for discrete solar radio sources) due to scattering is at 80 MHz (Riddle, 1974; Robinson, 1983) also constrain scattering.
3 Results and Analysis
3.1 Emission mechanism
The type IVm burst in the present case is most likely associated with the CME core like ejecta behind the CME LE because: 1) the CME LE was located at a large radial distance () at the onset time of the type IVm burst at 85 MHz. The above value is close to the outer limit of the radial distance up to which the type IVm bursts have been observed (Smerd & Dulk, 1971; Robinson, 1978); 2) the location of the ejecta () close to the onset of the type IVm burst at 85 MHz around 06:55 UT (see Figure 1) is consistent with the statistical estimate of the radial distance of the type IVm bursts during their onset at 80 MHz (Smerd & Dulk, 1971); 3) no other bright moving structures were noticeable in the STEREO-COR1B FOV during 06:55 - 07:50 UT over , the interval over which the radio emission was observed in Figure 1; 4) based on a statistical study of the type IVm bursts at 80 MHz, Gergely (1986) had earlier concluded that majority of the type IVm bursts move out with the ejecta behind the CME LE.
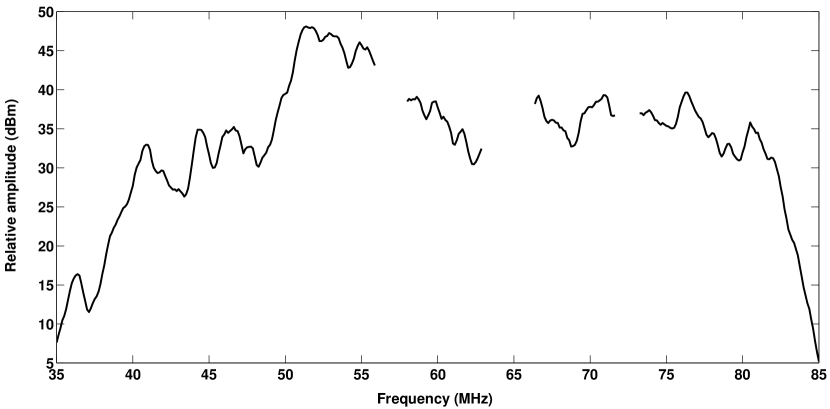
Second harmonic plasma emission and/or optically thin gyro-synchrotron emission from mildly relativistic electrons have been reported as the likely mechanisms for the type IVm bursts. Amongst the above two, we find that the latter is the cause in the present case because: 1) Wild & Smerd (1972); Dulk (1973); Melrose (1985) had shown that the gyro-synchrotron emission is strongly suppressed at frequencies , where is the plasma frequency, in the presence of a medium. We estimated the total coronal electron density (i.e., the density of the background corona and the CME together) using STEREO-COR1B pB measurements at the location of the ejecta at 06:55 UT. The density of the background corona was determined to beginwith from a pre-CME pB image at 06:05 UT using the spherically symmetric inversion method (Wang & Davila, 2014). The electron density of the ejecta was derived from the background-subtracted pB radiation averaged over a selected region on the ejecta (see Figure 5) and assuming the line of sight (LOS) column depth of the ejecta equal to its width for pB inversion. The value is . This corresponds to 24 MHz. Therefore if the type IVm burst of 2013 March 15 were because of gyro-synchrotron mechanism, emission at frequencies 48 MHz should have been progressively weaker at 06:55 UT. The present observations are consistent with this. The spectral profile of the type IVm burst in Figure 6) clearly shows a reduction in the observed intensity at frequencies 52 MHz. However at later times the burst is observable at lower frequencies (see Figure 1). This is because the ejecta had moved outward in the solar atmosphere as well as expanded in size with time (see Figures 4 and 5). As a consequence there is a gradual decrease in the total density at the location of the ejecta and hence the cut-off frequency for gyro-synchrotron emission. Probably this shift in the cut-off towards lower frequencies with time is also responsible for the observed drift of the type IVm burst in Figure 1. Note that the total density when the ejecta was first observed in the STEREO-COR1B FOV around 06:45 UT at was . Comparing this with the corresponding measurements at 06:55 UT, we find that the ejecta had moved a radial distance of in 10 min and the total density during that period had decreased by about a factor of two. Note that the densities of the other rising structures (above the occulter of the coronagraph) of the CME like the ‘legs’ and the frontal loop which are comparitively fainter (see Figure 5) are . This indicates that the corresponding MHz. Therefore if the type IVm burst had been due to any of the aforementioned structures of the CME, the reduction in the intensity of the burst at 06:55 UT should have been at lower frequencies than MHz. But this is not the case; 2) the estimated is larger compared to that for reported for type IVm bursts due to second harmonic plasma emission (Gary et al., 1985); 3) the spectral index of the type IVm burst between 40 MHz and 80 MHz as estimated from the GRIP observations is -0.1 (see Section 2). This is nearly the same as the expected spectral index for gyrosynchrotron emission over the frequency range MHz (Gopalswamy & Kundu, 1990).
3.2 Magnetic field
Dulk (1985) had shown that for optically thin non-thermal gyro-synchrotron emission, the and are related as follows:
| (1) |
where is the viewing angle between the LOS and the magnetic field, is the frequency of observation, and is the electron gyro-frequency. The power-law index can be estimated from the radio flux spectral index () through the relationship (Dulk, 1985). In the present case . This implies . The angle between the ejecta and the plane of the sky in the present case is (see Section 2). This indicates that the ejecta is nearly normal to the LOS and the associated field lines are likely to be radial. So we assumed the viewing angle between the LOS and the magnetic field in the type IVm burst source region to be the same as the positional angle from the LOS to the ejecta. Hence (see Section 2). Substituting for the different parameters in equation (1), we get G at 80 MHz and G at 40 MHz. The corresponding radial distances are most likely (80 MHz) and (40 MHz). We estimated this from the location of the ejecta () during the onset of the type IVm burst at 85 MHz ( 06:55 UT), the projected speed of the ejecta (, and the onset of the type IVm burst at 35 MHz ( 07:05 UT). The and the values are consistent with the results of the model calculations reported by Robinson (1974) for . The sense of polarization is in the e-mode. Gary et al. (1985) had remarked that gyro-synchrotron emission is a possible mechanism at 80 MHz if conditions like G at are satisfied. The above estimates of at 80 MHz in the present case agree reasonably with this.
4 Summary
A type IVm radio burst and type IVs radio burst occurred simultaneously on 2013 March 15 in association with a ‘halo’ CME and a M1.1/1F class soft X-ray/H flare. Radio imaging, spectral and polarimeter observations of the same at low frequencies ( 100 MHz) have been reported in this work. Our results indicate that the type IVm burst can be explained as due to optically thin gyro-synchrotron emission from the non-thermal electrons in the CME core like ejecta behind the CME LE. The estimated magnetic field strength near the type IVm burst source region is G and G at 80 MHz and 40 MHz, respectively. The corresponding radial distances are (80 MHz) and (40 MHz). The following results reported earlier indicate that the above values of are plausible: 1) Dulk et al. (1976) estimated the average field strength to be in the range G over by assuming gyro-synchrotron mechanism for similar CME associated non-thermal radio continuum; 2) Stewart et al. (1982b) reported 0.6 G at for the type IVm burst observed by them at 80 MHz in association with the CME core. The authors had attributed the radio emission to be either at the fundamental or the second harmonic of the plasma frequency. Note that if the density requirements for particularly the second harmonic plasma emission are nearly the same as that for the gyro-synchrotron emission, then it is possible that the corresponding values could be similar (Dulk et al., 1976); 3) Gopalswamy & Kundu (1989a); Bastian et al. (2001) evaluated G at based on similar non-thermal radio continuum due to gyro-synchrotron emission from the associated CMEs; 4) low frequency (77 MHz) polarimeter observations of a coronal streamer associated radio source indicate that magnetic field in the former at is 5 G. The present estimates of are reasonably consistent with this. That both the CMEs and streamers are primarily density enhancements in the solar atmosphere could be a reason for this; 5) for a similar type IVm burst event explained on the basis of optically thin gyro-synchrotron emission from the mildly relativistic non-thermal electrons in the magnetic field of the associated CME core, Tun & Vourlidas (2013) showed that G at ; 6) type IVm radio bursts associated with the ‘leg’ of the corresponding CMEs and generated due to second harmonic plasma emission from the enhanced electron density there indicate that 4 G at (Ramesh et al., 2013). Considering that the coronal magnetic field associated with the active regions have a range of values (Dulk & McLean, 1978; Ramesh et al., 2003, 2011b; Sasikumar & Ramesh, 2013), the different estimates mentioned above can be regarded as reasonable. With measurements of the coronal magnetic field being very limited, particularly in close association with a CME, the results indicate that contemporaneous whitelight and radio observations of the solar corona close to the Sun () are desirable to understand the CMEs and the associated magnetic field.
References
- Aubier, Leblanc & Boischot (1971) Aubier, M., Leblanc, Y., & Boischot, A. 1971, A&A, 12, 435
- Aurass et al. (2005) Aurass, H. Rausche, G., Mann, G., & Hofmann, A. 2005, A&A, 435, 1137
- Bastian & Gary (1997) Bastian, T. S., & Gary, D. E. 1997, J. Geophys. Res., 102(A7), 14031
- Bastian et al. (2001) Bastian, T. S., Pick, M., Kerdraon, A., Maia, D., & Vourlidas, A. 2001, ApJ, 558, L65
- Bastian (2004) Bastian, T. S. 2004, Planet. Sp. Sci., 52, 1381
- Benz et al. (2009) Benz, A. O., Monstien, Ch., Meyer, H., Manoharan, P. K., Ramesh, R., et al. 2009, Earth, Moon and Planets, 104, 277
- Boischot (1957) Boischot, A. 1957, C. R. Acad. Sci., 244, 1326
- Boischot & Pick (1962) Boischot, A., & Pick, M. 1962, J. Phys. Soc. Japan, 17, 203
- LASCO; Brueckner et al. (1995) Brueckner, G. E., et al. 1995, Sol. Phys., 162, 357
- Dulk (1973) Dulk, G. A. 1973, Sol. Phys., 32, 491
- Dulk et al. (1976) Dulk, G. A., Smerd, S. F., MacQueen, R. M., Gosling, J. T., Magun, A., et al. 1976, Sol. Phys., 49, 369
- Dulk & McLean (1978) Dulk, G. A., & McLean, D. J. 1978, Sol. Phys., 57, 279
- Dulk (1985) Dulk, G. A. 1985, ARA&A, 23, 169
- Duncan (1981) Duncan, R. A. 1981, Sol. Phys., 73, 191
- GLOSS; Ebenezer et al. (2001) Ebenezer, E., Ramesh, R., Subramanian, K. R., Sundara Rajan, M. S., & Sastry, Ch. V., A&A, 367, 1112
- Ebenezer et al. (2007) Ebenezer, E., Subramanian, K. R., Ramesh, R., Sundara Rajan, M. S., & Kathiravan, C. 2007, Bull. Astron. Soc. India, 35, 111
- Gary et al. (1985) Gary, D. E., et al. 1985, A&A, 152, 42
- Gergely (1986) Gergely, T. E. 1986, Sol. Phys., 104, 175
- Gopalswamy & Kundu (1989a) Gopalswamy, N., & Kundu, M. R. 1989a, Sol. Phys., 122, 91
- Gopalswamy & Kundu (1989b) Gopalswamy, N., & Kundu, M. R. 1989b, Sol. Phys., 122, 145
- Gopalswamy & Kundu (1990) Gopalswamy, N., & Kundu, M. R. 1990, Sol. Phys., 128, 377
- Grognard & McLean (1973) Grognard, R. J.-M. & McLean, D. J. 1973, Sol. Phys., 29, 149
- SECCHI; Howard et al. (2008) Howard, R. A., et al. 2008, Space Sci. Rev., 136, 67
- Kai (1969) Kai, K. 1969, Publ. Astron. Soc. Aust., 1(5), 189
- Kathiravan et al. (2007) Kathiravan, C., Ramesh, R., & Nataraja, H. S. 2007, ApJ, 656, L37
- Kathiravan et al. (2011) Kathiravan, C., Ramesh, R., Indrajit V. Barve, & Rajalingam, M. 2011, ApJ, 730, 91
- Kerdraon (1979) Kerdraon, A. 1979, A&A, 71, 266
- Kerdraon et al. (1983) Kerdraon, A., Pick, M., Trottet, G., Sawyer, C., Illing, R., Wagner, W., House, L. 1983, ApJ, 265, L19
- Kishore et al. (2014) Kishore, P., Kathiravan, C., Ramesh, R., Rajalingam, M., & Indrajit V. Barve 2014, Sol. Phys., 289, 3995
- Kraus (1986) Kraus J. D. 1986, Radio Astronomy, Second Edition, (Ohio: Cygnus-Quasar), 8-13
- Kundu et al. (1989) Kundu, M. R., Schmahl, E. J., Gopalswamy, N., & White, S. M. 1989, Adv. Space Res., 9(4), 41
- Lang & Willson (1987) Lang, K. R., & Willson, R. F. 1987, ApJ, 319, 514
- AIA; Lemen et al. (2012) Lemen, J. R., et al. 2012, Sol. Phys., 275, 17L
- Maia et al. (2007) Maia, D. J. F., Gama, R., Mercier, C., Pick, M., Kerdraon, A., Karlický, M. 2007, ApJ, 660, 874
- Melrose (1985) Melrose, D. B. 1985, in Solar Radio Physics, ed. D.J.McLean & N.R.Labrum, (Cambridge: Cambridge University Press), 211
- Mercier et al. (2006) Mercier, C., et al. 2006, A&A, 447, 1189
- Pick (1961) Pick-Gutmann, M., 1961, Ann. Astrophys., 24, 183
- Pick (2008) Pick, M. 2008, Astron. Astrophys. Rev., 16, 1
- GRAPH; Ramesh et al. (1998) Ramesh, R., Subramanian, K. R., Sundara Rajan, M. S., & Sastry, Ch. V. 1998, Sol. Phys., 181, 439
- Ramesh et al. (1999a) Ramesh, R., Subramanian, K. R., & Sastry, Ch. V. 1999a, A&AS, 139, 179
- Ramesh et al. (1999b) Ramesh, R., Subramanian, K. R., & Sastry, Ch. V. 1999b, Sol. Phys., 185, 77
- Ramesh & Sastry (2000) Ramesh, R., & Sastry, Ch. V. 2000, A&A, 358, 749
- Ramesh & Ebenezer (2001) Ramesh, R., & Ebenezer, E. 2001, ApJ, 558, L141
- Ramesh et al. (2003) Ramesh, R., Kathiravan, C., Sastya Narayanan, A., & Ebenezer, E. 2003, A&A, 400, 753
- Ramesh et al. (2006a) Ramesh, R., Sundara Rajan, M. S., & Sastry, Ch. V. 2006a, Exp. Astron., 21, 31
- Ramesh et al. (2006b) Ramesh, R., Nataraj, H. S., Kathiravan, C., & Sastry, Ch. V. 2006b, ApJ, 648, 707
- GRIP; Ramesh et al. (2008) Ramesh, R., Kathiravan, C., Sundara Rajan, M. S., Indrajit V. Barve, & Sastry, Ch. V. 2008, Sol. Phys., 253, 319
- Ramesh et al. (2010) Ramesh, R., Kathiravan, C., & Sastry, Ch. V. 2010, ApJ, 711, 1029
- Ramesh (2011a) Ramesh, R. 2011a, in Proc. of the 1st Asia-Pacific Solar Physics Meeting, ed. A.R.Choudhuri & D.Banerjee (Astron. Soc. India Conf. Ser.), 2, 55
- Ramesh et al. (2011b) Ramesh, R., Kathiravan, C., & Satya Narayanan, A. 2011b, ApJ, 734, 39
- Ramesh et al. (2012) Ramesh, R., Kathiravan, C., Indrajit V. Barve, & Rajalingam, M. 2012, ApJ, 744, 165
- Ramesh et al. (2013) Ramesh, R., Kishore, P., Sargam M. Mulay, Indrajit V. Barve, Rajalingam, M., Kathiravan, C., & Wang, T. J. 2013, ApJ, 778, 30
- Riddle (1974) Riddle, A. C. 1974, Sol. Phys., 35, 153
- Robinson (1974) Robinson, R. D. 1974, Publ. Astron. Soc. Aust., 2(5), 258
- Robinson (1978) Robinson, R. D. 1978, Sol. Phys., 60, 383
- Robinson (1983) Robinson, R. D. 1983, Proc. Astron. Soc. Aust., 5, 208
- Sasikumar & Ramesh (2013) Sasikumar Raja, K., & Ramesh, R. 2013, ApJ, 775, 38
- Smerd & Dulk (1971) Smerd, S. F., & Dulk, G. A. 1971, in Solar Magnetic Fields, ed. R. Howard, (Dordrecht: Reidel), IAU Symp. 43, 616
- Stewart & McLean (1982a) Stewart, R. T., & McLean, D. J. 1982a, Proc. Astron. Soc. Aust., 4(4), 386
- Stewart et al. (1982b) Stewart, R. T., et al. 1982b, A&A, 116, 217
- Stewart (1985) Stewart, R. T. 1985, in Solar Radio Physics, ed. D.J.McLean & N.R.Labrum, (Cambridge: Cambridge University Press), 361
- Subramanian & Sastry (1988) Subramanian, K. R., & Sastry, Ch. V. 1988, J. Astrophys. Astron., 9, 225
- Thejappa & MacDowall (2008) Thejappa, G., & MacDowall, R. J. 2008, ApJ, 676, 1338
- Tun & Vourlidas (2013) Tun, S. D., & Vourlidas, A. 2013, ApJ, 766, 130
- Wang & Davila (2014) Wang, T. J., & Davila, J. M. 2014, Sol. Phys., 289, 3723
- Weiss (1963) Weiss, A. A. 1963, Aust. J., Phys., 16, 526
- White (2007) White, S. M. 2007, Asian J. Phys., 16, 189
- Wild et al. (1963) Wild, J. P., Smerd, S. F., & Weiss, A. A. 1963, ARA&A, 1, 291
- Wild & Smerd (1972) Wild, J. P., & Smerd, S. F. 1972, ARA&A, 10, 159
- Willson et al. (1998) Willson, R. F., Redfield, S. L., Lang, K. R., Thompson, B. J., & St. Cyr., O. C. 1998, ApJ, 504, L117