| (1) | |||
| (2) | |||
| (3) | |||
| (4) | |||
| (5) | |||
| (6) |
[Xu:2001].Sections3.1to3.3describethreeMCDAmethods,namelySAW,TOPSISandVIKORalgorithmsforMCDA.Section3.4proposestheuseofthePareto-OptimalitybasedontheproposedcriteriontoevaluatetheappliedMCDAstoselectasubsetofsensors.
3.1 SAW
TheSimpleAdditiveWeighting(SAW)methodisoneofthemostpopularMCDAmethods[Memariani:2009, Abdullah:2014].Itprovidestheadditivepropertiestocalculatethefinalscoreofalternativesusedforweightdeterminationsandpreferences,whichisthebasisofotherMCDAmethodssuchastheAnalyticHierarchyProcess(AHP)andPreferencerankingorganizationmethodforenrichmentevaluation(PROMETHEE)[Memariani:2009].Accordingto[Abdullah:2014],SAWisusedinseveralapplicationdomainssuchassupplychainmanagement,personnelselectionproblems,projectmanagerselectionandfacilitylocationselection.
[Afshari:2010].SAWalgorithmcanbesummarizedbythefollowingthreesteps[Tzeng:2011]:
-
1.
Normalize the analysis matrix Q described in Equation 6 to Q’ according to Equation 7 if the criterion should be maximized or the Equation 8 if the criterion should be minimized.
for a criterion to be maximized (7) for a criterion to be minimized (8) -
2.
Compute the score vector of each available option. Each score can be calculated using Equation 9, where wj corresponds to the criterion weight and represents the number of criteria in the evaluation matrix.
(9) -
3.
Sort options in decreasing order according to the score () to get the ranking of suitable options.
3.2 TOPSIS
TOPSISexplorestheattributeinformationtoprovideasetofrankedalternativesandrequiresindependentthatattributepreferences.TheapplicationdomainsthatusestheTOPSISmethodhasbeenSupplyChainManagementandLogistics,Design,EngineeringandManufacturingSystems,BusinessandMarketingManagement,Health,SafetyandEnvironmentManagement,HumanResourcesManagement,EnergyManagement,ChemicalEngineeringandWaterResourcesManagement[Behzadian:2012].TOPSISsortsasetofoptionsaccordingtotheEuclideandistancefromtheidealandnegative-idealsolutions.Eachoptionisnormalizedusingaspecificcriterionvalue.Theidealsolutionrepresentsthemostdesirablelevelofeachcriterionacrosstheoptionsunderconsideration,whilethenegative-idealsolutionreflectstheworst-desirablelevelofeachcriterion.Theoptionsarerankedregardingtheirclosenesstotheidealsolutionandfarnesstothenegative-idealsolution[Tzeng:2011].TheTOPSISalgorithmcanbesummarizedinthefollowingsteps[Opricovic:2004]:
-
1.
Normalize the analysis matrix Q to Q’ according to the Equation 10:
(10) where N represents the number of options in the evaluation matrix.
- 2.
- 3.
-
4.
Calculate the relative closeness to the ideal solution. The relative closeness of q to and represented by () can be calculated according to Equation 15.
(15) -
5.
Sort options in increasing order according to the relative closeness to .
3.3 VIKOR
ThebasicconceptsofVIKORisacompromiseprogrammingusedtogetthemostsatisfactoryoptionbytheresultsoftheindividualandgroupregrets.Thismethodhasbeenwidelyusedinseveralapplicationsfields,suchas:locationselection,environmentalpolicyanddataenvelopmentanalysis[Huang:2009].
[Tzeng:2011],[Opricovic:2004]:
-
1.
Determine the best and the worst values for all criteria in Q. For a maximization criterion, the best and worst criteria values represented by and can be calculated respectively according to Equations 16 and 17:
(16) (17) -
2.
Compute the utility measure and the regret measure. The utility measure represented by is used to show the average gap of our options and can be calculated according to Equation 18, where corresponds to the criteria weights, expressing their relative importance. A regret measure represented by is used to show the maximal gap for improvement priority and it can be calculated according to Equation 19.
(18) (19) -
3.
Compute the group utility represented by of each solution. The parameter is used to represent the weight of the strategy of ”the majority of criteria”. Equation 20 is used to calculate .
(20) where
-
4.
Sort options in decreasing order according to the values , and . The results are three ranking lists.
-
5.
Propose as a compromise solution the alternative , which is ranked the best by the measure Q(minimum) if the following two conditions are satisfied:
C1. Acceptable advantage:
where ; and N is the number of options
C2. Acceptable stability in decision making:
The alternative must also be the best ranked by S or/and R.
If one of the conditions is not satisfied, then a set of compromise solutions is proposed, which consists of:
-
•
Alternative and if only condition C2 is not satisfied, or
-
•
Alternative , , … , if condition C1 is not satisfied; and is determined by the relation for maximum .
-
•
3.4 ProposalofEvaluationofMCDAmethods
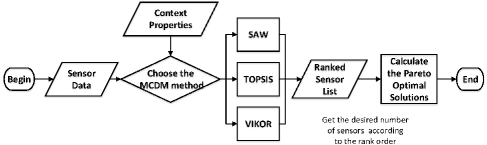
ThisSectionpresentstheresearchmethodologyusedintheexperiments.AsabaseofourstudyweassumetheSAWalgorithmusedbyGaoetal.[Gao:2014]andcompareitwithotherpopularMCDA(TOPSISandVIKOR)algorithms.OurevaluationapproachisbasedonasetofsensordatathatwillberankedaccordingtoanMCDAmethodandcontextproperties.ThedesirednumberofsensorsareretrievedfromthetopoftherankedlistandthePareto-optimalfrontsarecalculated.Figure2synthesizesthewholeprocessingproposalforevaluatingMCDAs.
Pareto-optimalitycriterion[Marler:2004]isusedtocomparethequalityofthesolutionsobtainedbyeachmethod.Itusesthedominanceconcepttodeterminewhenasolutionisbetterthenother.Forexample,giventwosolutionsxandy,xdominatesy(x⪰y)iftwoconditionsarerespected:
-
1.
The solution is better than in at least one objective function;
-
2.
The solution is at least equal to in all objective functions;
Pareto-optimalset,whichrepresentsthesetofoptimalavailablesolutionsfortheproblem.TheParetofrontsisthesetofvaluesoftheobjectivefunctionsofthePareto-optimalsolutionsset.ThesolutionsthataredominatedonlyforthePareto-optimalsolutionsarelocatedinthesecondParetofront.ThenumberofParetofrontsthatareusedinanexperimentaredirectlyproportionaltothenumberofnon-dominatedsolution.Inthissense,ourevaluationprocesswillconsiderthenumberofusedsensorsinthePareto-optimalsetandthenumberofParetofrontsusedbyeachMCDAsolution.TheParetofrontsarecomputedthroughthefast-non-dominated-sortalgorithmdescribedbyDebetal.(2002)[Deb:2002].
[Collette:2004]metricwhichshowsthenumberofoptimalsolutionsintheParetofrontasaproportionofthenumberofsolutionsproposedbytheMCDAmethodsineachfront.AsclosertheONVGRvalueistoonebetteristhesolutionproposedinthatfront.
1describethehardwareandsoftwarespecificationusedtoperformtheexperiments.
| Hardware/Software | Specification |
|---|---|
| Processador | AMD Processor Vishera 4.2 Ghz |
| Memory | 32 GB RAM DDR3 Corsair Vegeance |
| Hard Disk | HD 2TB Seagate Sata III 7200RPM |
| Operating System | Linux Ubuntu Server 14.04 64 Bits LTS |
| Java | JDK 1.7 |
| Database | MongoDB 3.0 |
2showstheusedexperimentalfactorsandlevels,wherethecombinationofthelevelsofeachfactorgivesatotalof45experiments.
| Factor | Level |
|---|---|
| Number of Sensors Descriptions | 100,000 |
| MCDA Method | SAW, TOPSIS and VIKOR |
| Number of Selected Sensors | 1,000 , 5,000 and 10,000 |
| Number of Context Properties | 2,3,4,5 and 6 |
4 EvaluationResultsandLessonsLearned
InthisSection,wepresentthegathereddataoftheperformedexperiments.Inordertomakethedatavisualisationandtheirmeaningeasier,wewillpresenttheresultsofeachmethodregardingthenumberofcontextproperties.4.1 EvaluationResults
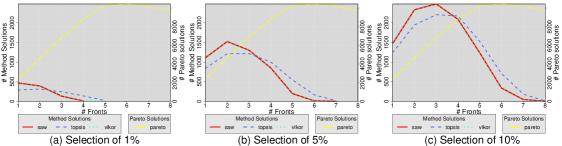
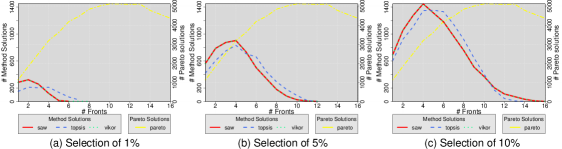
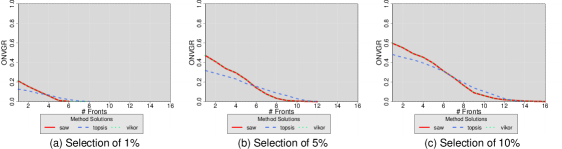
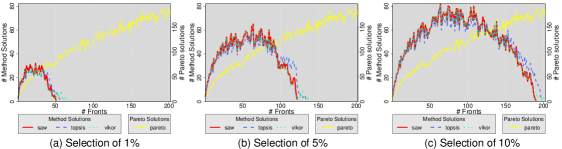
WewillanalysetheresultsregardingtheSAW,TOPSISandVIKORmethods.TwographicsrepresentthenumberofusedfrontsandtheONGVRmetric.Torepresentthenumberofusedfrontthegraphichavetwoordinateaxis.TheabscissaaxishastheindexesoftheParetofrontsfromthefirstfronttothelastone.Theleftordinateaxispresentsthenumberofsolutionsretrievedbyeachmethod(differentcolourslines)fromeachParetofront.TherightordinateaxiscorrespondstonumberofParetofrontsneededtocoveragivensubsetofsensors.TorepresenttheONVGRmetricagraphicwithoneordinateaxisandoneabscissaaxisisused.TheordinateaxiscorrespondstotheONVGRvalueandtheabscissaaxishastheindexesoftheParetofronts.
4.1.1 Selectionusingsixcontextproperties:
Figure3presentsthequalitybehaviouroftheselectionof1,000(Figure3.a),5,000(Figure3.b)and10,000(Figure3.c)ofavailablesensorsconsideringsixcontextproperties(asdefinedinSection3.4).ThenumberofParetofrontslightlyincreasesasthenumberofselectedsensorsisraised.Also,thenumberofoptimalsensorsavailableineachfrontincreasesaccordingtothenumberofselectedsensors.TheMCDAmethodsconcentratesthemajorpartofthesolutionsinthefirstfrontsduetoahighnumberofconflictsbetweentheusedcriteria.
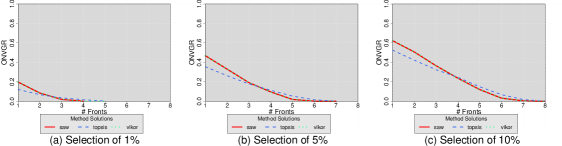
4showstheONVGRvalueineachfrontoftheselectionof1,000(Figure4.a),5,000(Figure4.b)and10,000(Figure4.c).Theratiovalueinthefirstfrontsincreasesproportionaltothenumberofselectedsensors.Ontheotherhandtheratiovalueshowsahighlossofoptimalsensors,astheratiovalueschangesfrom0.2to0.6intheworstandbestscenariosrespectively.
Paretooptimalityconcepttoselectthesensors.Theyaimtoselectsensorsthatpresentacertainlevelofstabilitybetweenthecontextpropertiesvalues.While,theParetooptimalitysolutionsdonotcareaboutthestabilitybetweenthecontextpropertiesvaluesbuttrytogetthegreatestnumberofcontextpropertieswiththebestpossiblevalues.
4.1.2 Selectionusingfourandfivecontextproperties:
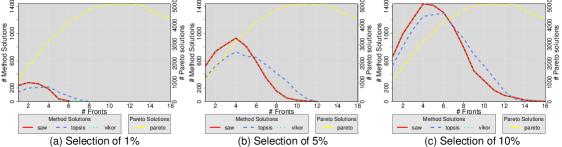
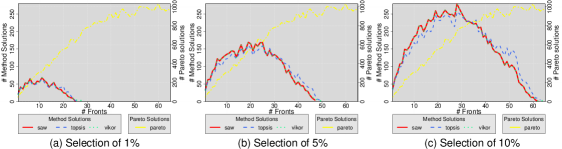
Figures5and6presentsthequalitybehaviouroftheselectionof1,000(Figure5.aand6.a),5,000(Figure5.band6.b)and10,000(Figure5.cand6.c)ofavailablesensorsconsideringfourandfivecontextpropertiesrespectively.AnalogoustoSection4.1.1,thenumberofParetofrontandthenumberofoptimalsolutionsincreasesproportionaltothenumberofselectedsensors.ForfourandfivecontextpropertiesthenumberofParetofrontsistwiceastheresultspresentedinSection4.1.1andarenotsodifferent,itvariesfrom6to16.
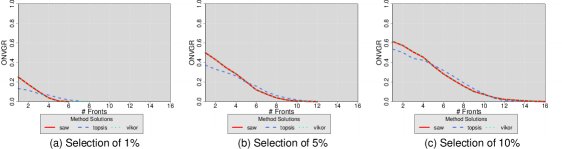
7and8showtheONVGRvalueineachfrontoftheselectionof1,000(Figure7.aand8.a),5,000(Figure7.band8.b)and10,000(Figure7.cand8.c).AlthoughthenumberofsolutionsfoundbyeachmethodandthenumberofParetosolutionsaredifferentfromSection4.1.1,theratiobetweenthenumberofselectedsensorsandthenumberofParetosolutionsarepracticallythesameaspresentedinFigure4.Theyalsoshowalowratiovaluethatchangesapproximatelyfrom0.2to0.6inthebestandworstscenariosrespectively.
4.1.3 Selectionusingthreecontextproperties:
Figure9presentsthequalitybehaviouroftheselectionof1,000(Figure9.a),5,000(Figure9.b)and10,000(Figure9.c)ofavailablesensorsconsideringthreecontextproperties.AsseeninSection4.1.2,thenumberofParetofrontincreasesproportionaltothenumberofselectedsensors.Thisobservationarejustifiedbecausewithlesscontextpropertieswealsoreducethenumberofcontextpropertiesconflicts,thenumberofParetooptimalsolutionsperfrontandthenumberofsolutionsfoundperfront,whichincreasestheprobabilityforfindingsolutionswithahigherlevelofstability.
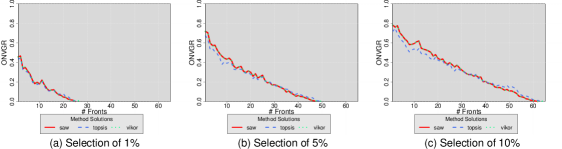
10showstheONVGRvalueineachfrontoftheselectionof1,000(Figure10.a),5,000(Figure10.b)and10,000(Figure10.c).TheratiovalueinthefirstfrontsareslightlyhigherthantheratiovaluespresentedinSection4.1.2duetothereductionofthenumberofcriteria.Inthissense,theratiovalueschangesfromapproximately0.4to0.8intheworstandbestscenariosrespectively.
Paretofronts.SimilartoSection4.1.2,theTOPSISmethodpresentedthesolutionwithlowqualityasithadlesssolutionsthantheSAWandVIKORmethodsinthetopfirstfronts.
4.1.4 Selectionusingtwocontextproperties:
Figure11presentsthequalitybehaviouroftheselectionof1,000(Figure11.a),5,000(Figure11.b)and10,000(Figure11.c)ofavailablesensorsconsideringtwocontextproperties.AnalogoustoSection9,thenumberofParetofrontsandthenumberofoptimalsolutionsincreasesdirectlyproportionaltothenumberofselectedsensors.
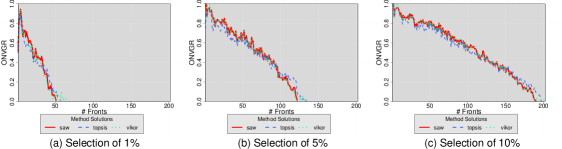
12showstheONVGRvalueineachfrontoftheselectionof1,000(Figure12.a),5,000(Figure12.b)and10,000(Figure12.c).Duetotheminimalnumberofcriteriaconflicts,theratiovaluetendstogetclosertooneasitlessoptimalsolutionsareavailable.Inthissense,theratiochangesfromapproximately0.8to1intheworstandbestscenariosrespectively,whichshowsthatalloptimalsolutionsareselected.
4.2 LessonsLearned
Inthissection,wehavecomparedthebehaviourandqualityofdifferentMCDAmethodsforsensorsearchandselection.Firstly,itisimportanttohighlightthenumberofoptimalsolutionsavailableineachscenario.Asexpected,thenumberofoptimalsolutionsincreasesproportionaltothenumberoffronts.Itoccursduetothenon-dominatedsolutionconceptusedtocomputetheoptimalsolutionssetineachfront.Inthissense,thenumberofoptimalsolutionsisnotinfluencedbythenumberofselectedsensors.Ontheotherhand,thenumberofselectedsensoraffectsthenumberofoptimalsolutionsthatarefoundedbytheMCDAalgorithms.Theinfluenceofthenumberofselectedsensorscanbejustified,becauseitincreasesthechancesoftheMCDAfindtheoptimalsensorsset.Inallscenarios,theONVGRmetricclearlyshowsthesignificantincreaseoftheratiobetweenthenumberofoptimalsensorsandthenumberofsensorsfoundbyeachMCDAalgorithmwhenmoresensorsareselected.ThecontextpropertiesalsoinfluencethenumberofoptimalsolutionsobtainedbyeachMCDAalgorithm.Thenumberofcontextpropertiesisdirectlyproportionaltonumberofoptimalsolutionsavailableineachfront.Itisbecauseasmorecontextpropertiesareusedthenumberofconflictsbetweenthecriteriaincreasesandconsequentlythenumberofnon-dominatedsolutionsincreases.Inotherwords,wereducethechancestofindasmallsetofsolutionswhichpresentthebesttrade-offbetweentheanalysedcontext-properties.Also,theONVGRmetricallowstocomparehowthenumberofcontextpropertiesinfluencethenumberofoptimalselectedsensors.Althoughthenumberofselectedsensorsineachfrontisdifferentforsix,fiveorfourcontextpropertiestheONVGRvalueispracticallythesameforallandindicatesthatalownumberofoptimalsensorsisfoundedineachone.Whenthreeortwocontextpropertiesareused,theONVGRvalueishigherforallscenariosandconsequentlyahighernumberofoptimalsensorsisfoundedwhenlesscontextpropertiesisused.RegardingtheanalysedMCDAmethodsitispossibletoobservethatforallanalysedscenariostheSAWmethod,whichusesregulararithmeticaloperationsofmultiplicationandadditiontoranktheoptions,presentedatleastanequalnumberoffrontsandtheONVGRvaluethanTOPSISandVIKORmethod.TheVIKORmethod,whichapplythecompromiseprogrammingconceptprovidingamaximum‘‘grouputility’’forthe‘‘majority’’andaminimumofanindividualregretforthe‘‘opponent’’,presentedasolutionprettyclosertotheproposedsolutionbySAWalgorithmbutinsomescenariositsolutionhasmorefronts.Finally,theTOPSISmethodwhichranksthesolutionsaccordingtothedistancetotheidealsolutionandthegreatestdistancefromthenegative-idealsolutionwithoutconsidertherelativeimportanceofthesedistances,presentedthepoorestsolutionasinthemajorpartofthescenariositusesmorefrontsandpresentedalowONVGRvaluethanSAWandVIKORmethods.5 RelatedWork
Todaythereareseveralapproachesthatenablethesensormanagement.Pereraetal.[Perera:2014a]andRömeretal.[Romer:2010]presentsurveysthatdescribesseveraltechniques,methods,models,features,systems,applications,andmiddlewaresolutionsrelatedtotheIoTcontext.Thesesurveysshowsthatthealgorithmsusedtoperformthesensorsearchandselectioncanbesplittedintwogroups:predictionmodelsandkeywordorcontextinformation.InthisSectionwepresentthemainworkrelatedtoeachgroup.
[Elahi:2009]presentsaprimitivecalledsensor rankingtoperformthesensorsearchinanefficientway.Themainideaofsensor rankingprimitiveistoexploretheperiodicitypresentedbythesensorinsomecasesusingpredictionmodelsthatrankthesensorsaccordingtotheprobabilitytomeetauserquery.TheSingle-PeriodandtheMulti-Periodpredictionsmodelsareusedinthispaperandthegathereddataallowtoobserveaperformanceimprovementtoselectthesensors.Ostermaieretal.[Ostermaier:2010]presentasearchenginefortheWebofThingscalledDysertoconductsearchesinscalableenvironmentswithhighlydynamiccontent.Dyserisabletocollectandstoredataandinformationfromsensorstoallowsearchbasedonmetadata.ItalsoextendstheworkpresentedbyElahiet.al.[Elahi:2009]usingtheAggregatedPredictionModel.Theresultsshowedthatthealgorithmspresentedabetterqualityselectionwhencomparedwiththerandommodel.
[Truong:2013]alsoextendstheworkpresentedbyElahiet.al.[Elahi:2009]andproposeapredictionmodelbasedonfuzzylogicnamedTime-IndependentPredictionModel.Thismodelisabletodetectanomaliesaboutsensorbehaviorusingmetricsofdensityandstability.Thedensitymetricisusedtoestimatetheprobabilityofacertainvaluebelongtoaspecificsensorwhilethestabilitymetricestimatesthestabilityofthesesensorsinthepast.Thecombinationofthesemetricsallowtorankthesensorsandchecktheirstate.Thus,thesolutionpresentedisabletoreducethenecessarycommunicationforsensorsearchandselection.
[Carlson:2014]presentasearchenginenamedAmbientOceantosearchandselectsensorsusingcontextinformation.Thesearchengineusesmetadata,whichisstoredinaglobalrepository,toestablishthesensorscontextandcarryoutthesearchinamoreefficientandeffectivemanner.AmbientOceanusesmulti-tasksimilaritymodelsbasedontheWeightedSlopeOnealgorithmtoselectthesensors.Inscenarioswherethecharacteristicsofthesensorsaredifficulttomodel,collaborativefilteringtechniquesareemployedtocomputesimilaritiesbetweenusersorsensorsbasedoninformationhistory.
[Ding:2012]proposeahybridsearchenginetoIoTenvironments,abletoperformsearchesusingquantitativevalues,keywordsandspatio-temporalrelations.Thearchitectureofthissearchengineisbasedonabottom-upmodelwiththreelayers,thefirstlayerisresponsibleforsensingandmonitortheequipment.Thesecondlayerisresponsibletostorethedatainadistributedform.Thethirdlayerprovidesoptimizedaccesstodatafromthesensors.ThesearchforkeywordsandquantitativevaluesisoptimizedbyaB+treeandthesearchbaseontime-spacerelationshipsusesaRtree.Thissearchengineallowsthediscoveryoftheobjectsstateatrun-timeasthesensorssendscontinuousdatatothestoragelayer,whichindexthesedataaccordingtodata-structureused.
[Guinard:2010]proposeamodulefortheintegrationarchitecturenamedSOCRADES,whichaimstoenableubiquitousintegrationservicesrunningonembeddedwithotherbusinessprocessesdevices.TheproposedmoduleisbasedonthemodelPublish/Subscribeandusesaglobalrepositorytostoremeta-dataabouttheavailabledevices.TherepositoryworkswithamonitorthatisresponsibletoupdatethedevicesstatesandtheirQoSattributes.ThesensorsearchismadebykeywordsandissortedaccordingtotheQoSattributesprioritizedbytheuser.Kotharietal.[Kothari:2014]presentsanarchitecturedenominatedDQS-Cloudtooptimizethesensorsearch,provideresiliencetofaultsandQoSdegradationandalsooptimizesystemperformancemanagingsensordatastreams.ThesensorsearchisbasedonkeywordsandconsiderstheQoSattributesspecifiedbyusers.Moreover,inordertoreducecommunicationoverhead,theauthorsproposesanoptimizationmechanismtoreusesensorsflowstosimilarrequests.Theresultsshowedthattheoptimizationmoduleisabletoreducethebandwidthandprocessingrateoftheproviders.
[Shah:2012]presentsasearchmechanismbasedonCoordinateVirtualSystemtofindprocessinP2Pnetworks.Acoordinateisassignedtoanoderepresentingaphysicallocationinrelationtoothernodes.ThesensorsearchuseskeywordsandthereturnedsensorsarerankedaccordingtotheeuclideandistancetotheQoSattributesspecifiedbytheuser.Aqualitativeapproachshowsthattheproposedsearchmechanismwastheonlyoneabletoperformaprecisionqueryatrealtime.Rutaetal.[Ruta:2013]proposesaframeworktomanagesemanticnotationsofdatastreams,devices,highleveleventsandservices.TherequestsusestheCoAPprotocolbasedontheRESTfularchitecturalstyle,whichallowtouseinferencetosupportthesensorsearchandtheircompositions.Adataminingmechanismwasusedtoretrievethesensorsearchinrealtimetoimprovethesensorselection.ThesensorselectionisbasedintheConceptCoveringinferencefollowedbyarankingalgorithm.
[Perera:2013]proposesaframeworknamedCASSARAM,whichperformsthesensorsearchandselectionregardingtheQoSattributesspecifiedbytheuser.Theselectionprocessisdividedintwophases.Inthefirstphase,thestaticsensorattributes,suchasmanufacturerortype,areusedtolimittheuserspacesearch.Inthesecondphase,theresultqueryofthefirstphaseisevaluatedinamulti-dimensionalspacewhereeachaxiscorrespondstoaQoSuserattribute.ThesensorsareindexedregardingtheComparativePriority-basedWeightedIndexandrankedaccordingtotheireuclideandistancetotheoptimalpoint.TheauthorsalsoproposesaheuristicnamedComparativePriority-basedHeuristicFiltering,whichremovesthesensorsthatarefarfromtheidealpointprioritizingtheTOP-Kselection.Theresultsshowsthatusingupto10,000sensors,theframeworkpresentsasatisfactoryperformancewithahighprecision.
[Gao:2014]proposestheAutomatedComplexEventImplementationSystemtomanagesdifferentrun-timedatastreams.ThesensorsandtheirdatastreamsaredescribedaccordingtoSSNontologyandstoredinarepositorywiththeirQoSattributes.Thesystemactssuchasamiddlewarebetweenasensordatastreamandanapplication.ThemiddlewareareabletoperformthesensorsearchandselectusingtheSimple-Additive-Weightingalgorithmtofindthebesttrade-offbetweenthespecifiedQoSattributes.
| Paper | Search Technique | Search | Selection Method | QoS |
|---|---|---|---|---|
| [Elahi:2009] | Prediction Model | Sensor State | Single-Period and Multi-Period | No |
| Prediction model | ||||
| [Ostermaier:2010] | Prediction Model | Sensor State | Aggregated Prediction model | No |
| [Truong:2013] | Prediction Model | Sensor State | Time-Independent Prediction Model | No |
| [Carlson:2014] | Prediction Model | Context Information | Weighted Slope One Algorithm | No |
| [Ding:2012] | Index | Keywords, Sensor State | B+ tree and | No |
| Context Information | R tree | |||
| [Guinard:2010] | Score and Ranking | Keywords | Not specified | Yes |
| [Kothari:2014] | Score, Ranking | Keywords | Not specified | Yes |
| and Similarity | ||||
| [Ruta:2013] | Inference and Ranking | Keywords | Concept Covering | No |
| [Shah:2012] | Score and Ranking | Keywords | Euclidean Distance | Yes |
| [Perera:2013] | Score and Ranking | Context Information | Euclidean Distance and Comparative | Yes |
| Priority-based Heuristic Filtering | ||||
| [Gao:2014] | Score and Ranking | Context Information | Simple-Additive-Weighting | Yes |
3summarizesthemaincharacteristicsoftheworkspresentedinthisSection.[Elahi:2009],[Ostermaier:2010],[Truong:2013]e[Carlson:2014]usespredictionmodelsanddonotconsiderQoSattributestochoosethesensorsastheyarejustinterestinginthesensorstate.[Ding:2012]alsodonotconsiderQoSattributesbutworryabouttoofferefficientdatastructurestostorethesensorstateatrun-time.Ontheotherhand,[Guinard:2010]e[Kothari:2014]highlighttheimportancetoselectthesensorsbasedontheirQoSproperties,butdonotpresentaspecificmethodforsensorsearchandselection.[Shah:2012],[Perera:2013]and[Gao:2014]usesmethodstoscoreandrankingtheirsensors.[Shah:2012]and[Perera:2013]usetheEuclideandistanceofthesensortotheoptimalpointtoscoreandrankwhile[Gao:2014]appliestheSAWmethod.