Nanodiamond-enhanced MRI
Abstract
Nanodiamonds are of interest as nontoxic substrates for targeted drug delivery and as highly biostable fluorescent markers for cellular tracking. Beyond optical techniques however, options for noninvasive imaging of nanodiamonds in vivo are severely limited. Here, we demonstrate that the Overhauser effect, a proton-electron double resonance technique developed to detect free radicals in vivo, can enable high contrast magnetic resonance imaging (MRI) of nanodiamonds in water at room temperature and ultra-low magnetic field. The technique transfers spin polarization from paramagnetic impurities at nanodiamond surfaces to 1H spins in the surrounding water solution, creating MRI contrast on-demand. We further examine the conditions required for maximum enhancement as well as the ultimate sensitivity of the technique. The ability to perform continuous hyperpolarization via the Overhauser mechanism, in combination with excellent in vivo stability, raises the possibility of performing noninvasive tracking of nanodiamonds over indefinitely long periods of time.
Nanoparticles are rapidly emerging as powerful theranostic substrates Min2015 for the targeted delivery of vaccines Reddy2007 , chemotherapy agents Gaur2014 , immunotheraputics Almeida2014 and as a means of tracking tumor distribution on whole-body scales Liu2016 ; Harisinghani2003 . Biocompatible nanodiamonds (NDs) are ideal examples, featuring surfaces that are readily functionalized to enable tissue growth and their selective uptake by disease processes Chow2011 ; Xi2014 ; Thalhammer2010 ; Zhang2011 . Imaging NDs in vivo, however, has been to date, mostly limited to sub-cellular environments that are optically accessible Schrand2007 ; Mcguinness2011 . Without imaging modalities beyond optical florescence, realization of the full theranostic potential of ND to track and investigate complex disease processes, such as metastatic disease, is unlikely.
Magnetic resonance imaging (MRI) is the gold standard for noninvasive high-contrast imaging of disease in radiology, but has proven ineffective for directly detecting NDs in vivo due to the low abundance and small gyromagnetic ratio of spin-active 13C nuclei that comprise the carbon lattice. Hyperpolarization of the 13C nuclei at cryogenic temperatures can, in principle, overcome the inherently weak signal from diamond by boosting it some 10,000 times to enable MRI contrast from nanoparticle compounds Rej2015a ; Casabianca2011 ; Dutta2014 . Despite these prospects, hyperpolarized nuclei always relax to their thermal polarization in a time that, for the smaller sub-micron particles, is currently short enough to limit the usefulness of the method in an imaging context Cassidy2013 ; Rej2015a .
An alternative approach to tracking concentrations of ND involves functionalizing the ND surface with paramagnetic Gd(III)-chelates to create complexes that could potentially be imaged in vivo with conventional -weighted MRI Manus2010 . However, this approach faces the challenges of a large background signal and concerns over the potential toxicity of gadolinium-based compounds in the long term McDonald2015 .
Here, we demonstrate a viable means of imaging and tracking water-ND solutions in vivo using Overhauser magnetic resonance imaging (OMRI) Lurie2002 ; Golman2002 ; Koonjoo2014 ; Ichikawa2012 . Operation at ultra-low magnetic field (ULF) enables efficient and biocompatible Overhauser polarization transfer between electronic and nuclear spins. RF pulsing of the electron paramagnetic resonance (EPR) transition between MRI signal acquisitions continually transfers spin polarization from the paramagnetic centers at the surface of ND to 1H nuclei in the surrounding water Sarracanie2013a . The presence of ND in the solution thus leads to an enhancement in the 1H MRI signal that can readily produce images with contrast sensitive to ND concentrations. Our approach overcomes the limitations imposed by short spin relaxation times of smaller particles and enables switchable tracking of ND solutions over indefinite timescales. In addition to producing images to demonstrate the approach, we investigate the conditions under which this technique leads to maximum sensitivity to the presence of ND, presenting data characterising the efficiency of the Overhauser mechanism as a function of particle concentration and size. These results significantly enhance the theranostic capabilities of non-toxic, bio-functionalized ND, opening the possibility that MRI can be used to monitor and track ND-compounds in vivo.
The Overhauser effect in nanodiamond solutions
Various types of ND were used in this study, including high-pressure, high-temperature (HPHT), natural (NAT) and detonation (DET) NDs in sizes from 4 nm - 125 nm. We focus on results obtained from HPHT 18 nm and HPHT 125 nm NDs as typical representatives of the general behaviour observed. An air oxidization process, known to etch the ND surface, produces additional variants of NDs for comparison with the commercially sourced varieties Gaebel2012 . Aqueous solutions of ND in deionized (DI) water were prepared using high power probe sonication, with HPHT NDs exhibiting the most stability in solution. HPHT 125 nm solutions show no aggregation over a period of months and a zeta potential of -55 mV [see methods for further details on ND preparation].
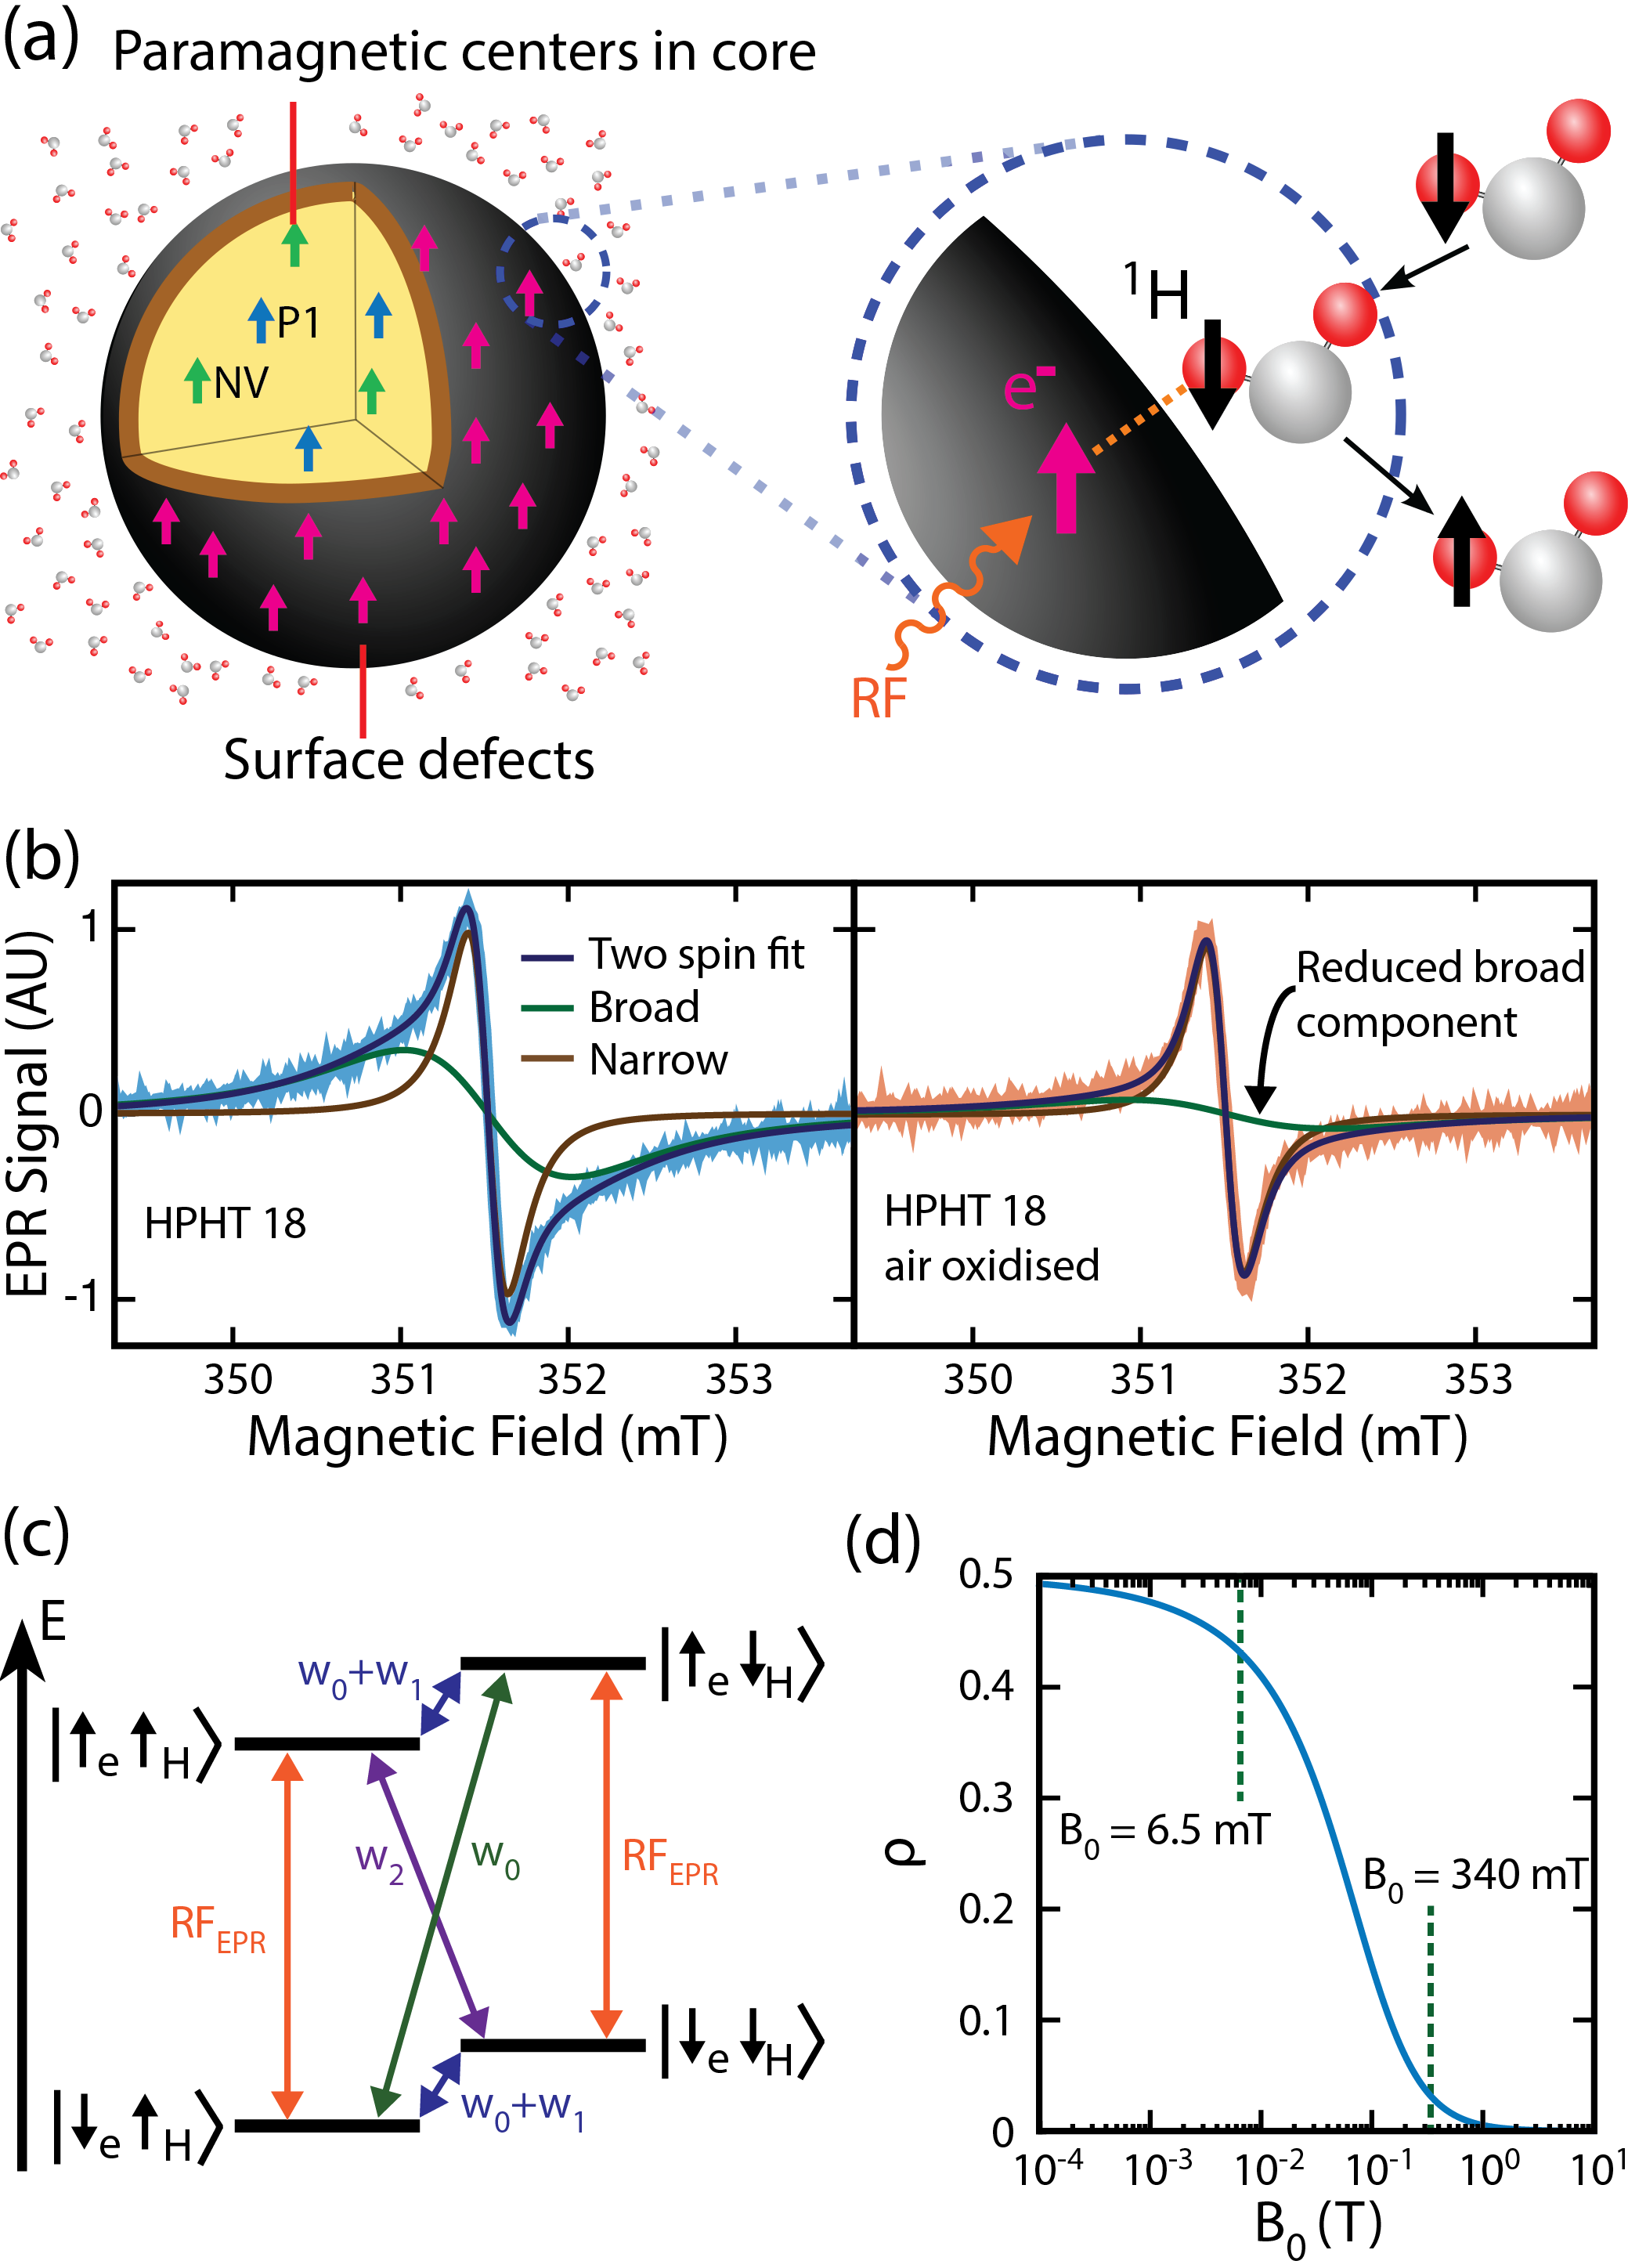
The basis for detecting and imaging ND in solution is shown in Fig. 1(a). Image contrast arises from the Overhauser effect, which as a starting point, requires a reservoir of partially polarized electron spins Ravera2016 . Driving these electrons with a resonant ac magnetic field transfers spin polarization to the interacting 1H nuclei in the surrounding solution, (see Fig. 1(a)) Clarkson1998 ; Ardenkjaer-Larsen1998 . NDs provide such a reservoir in the form of paramagnetic impurities such as nitrogen vacancy centers, substitutional nitrogen (P1) centers, and unpaired electrons at the nanoparticle surface Panich2015 ; Cui2014 . We first characterize our NDs using EPR spectroscopy, determining their impurity content and suitability for Overhauser imaging.
The EPR spectra of our HPHT 18 nm ND solution is shown in Fig. 1(b) and fits a two-component spin-1/2 model comprising a broad (1.2 mT) component and a narrow (0.2 mT) component (solid lines in figure) Stoll2006 . Air oxidation of NDs reduces the amplitude of the broad component in the spectra, presumably by removing the paramagnetic centers at the surface. Our results are consistent with previous studies suggesting that the broad component is due to disordered dangling bonds at the surface of the ND with the narrow component arising from lattice defects in the crystalline core Yavkin2015 . Other types of ND studied here demonstrate similar spectral components [see SI for further details].
Having established that ND provides a paramagnetic reservoir suitable for the Overhauser effect, we turn now to address the additional conditions that must be satisfied to enable imaging. Given the ensemble average of the z-component of the nuclear spin over the nuclear moment, the enhancement, , generated by the Overhauser mechanism is a function of four parameters Gunther2011 :
| (1) |
where is the coupling factor between electron and nuclear spins, the leakage factor, the saturation factor, and and are the electron and nuclear gyromagnetic ratios. Addressing first the coupling factor , we note that, when there is dipolar coupling but no hyperfine contact interaction between spins, takes a positive value determined by the correlation time of the two spins, diffusion coefficients and the EPR frequency. Relatively long correlation times are expected at ND surfaces due to the formation of a nanophase of water with 1 nm thickness at the ND-water interface Korobov2007 . Assuming free diffusion of water at a distance of 1 nm from the ND surface, we follow refs. Armstrong2009 ; Toth2002 ; Hwang1975 ; Freed1978 and plot the field dependence of for a calculated correlation time of 430 ns, as shown in Fig. 1(d) [see SI for details of calculation]. Not surprisingly, given the long correlation time between spins, increasing the magnetic field above a few milli-Tesla rapidly suppresses the mutual flip-flip of dipolar coupled electron and nuclear spins and thus the nuclear enhancement possible via the Overhauser effect. Our choice of magnetic field for Overhauser imaging is thus constrained to the ULF regime, where serendipitously, the frequency of the EPR field produces minimal heating from dielectric loss associated with water at C Gabriel1998 .
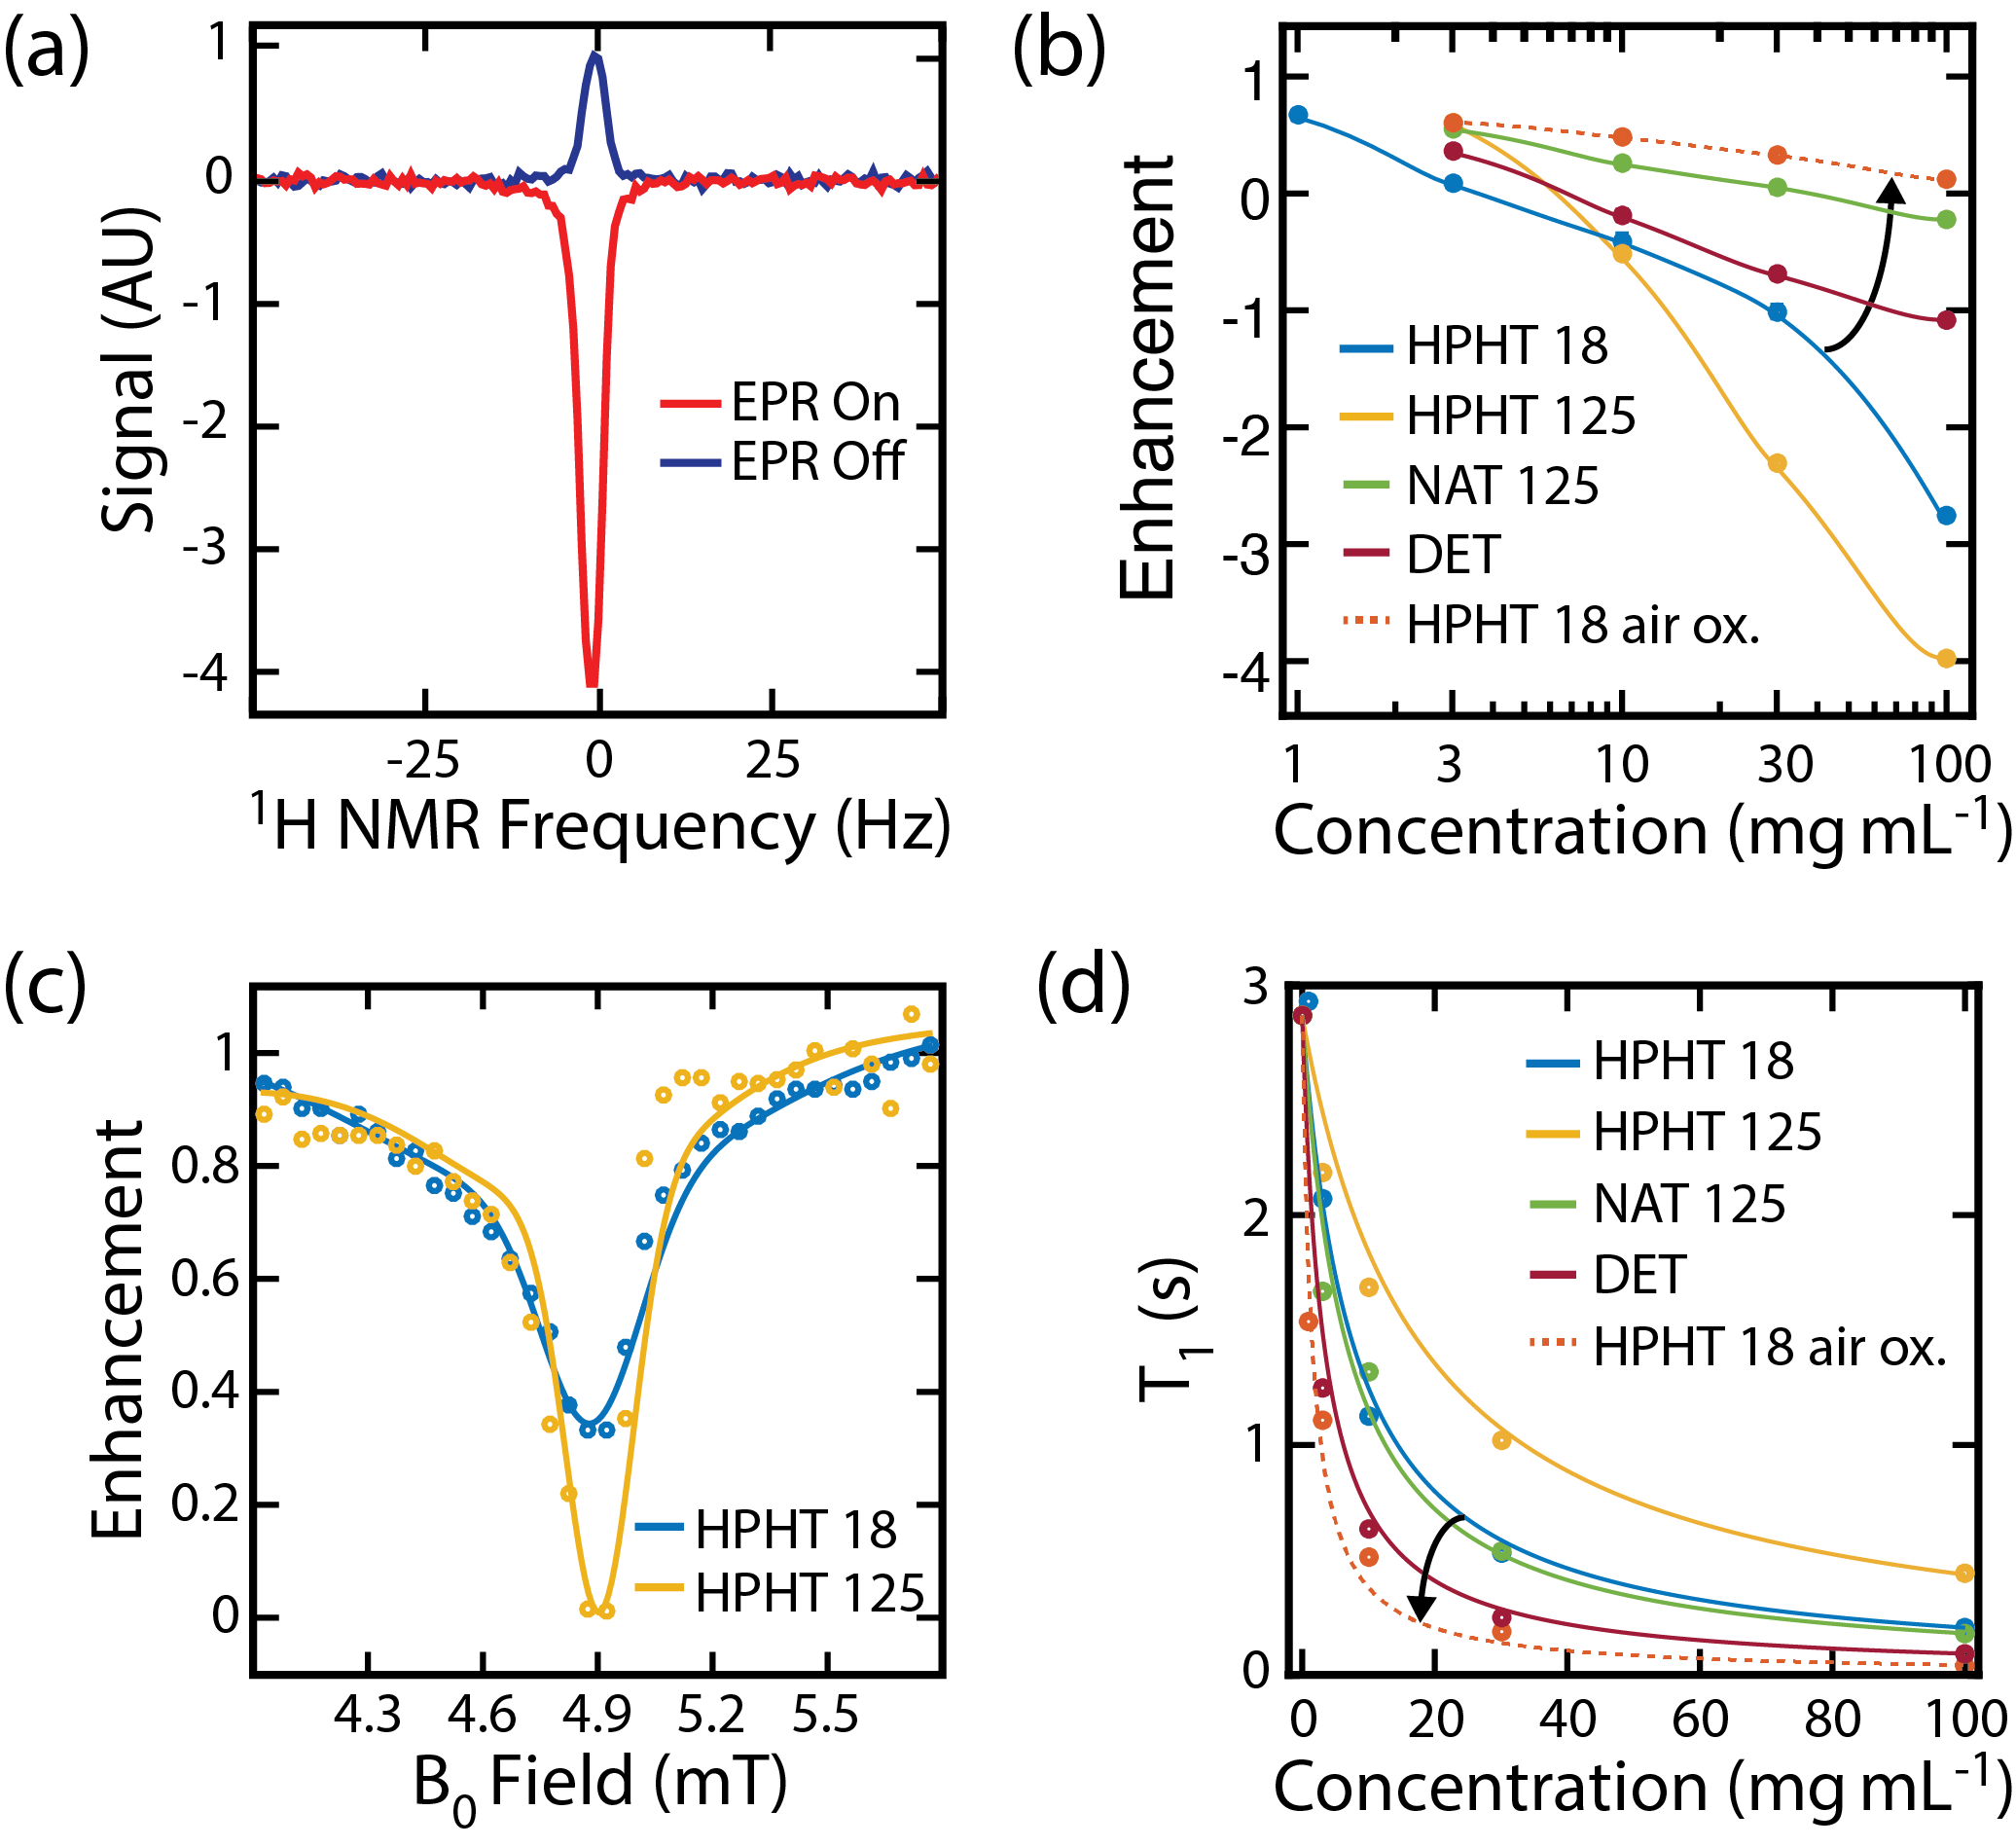
To demonstrate that NDs can be detected via the Overhauser effect at ULF, we set = 6.5 mT and apply an RF magnetic field at the EPR frequency of 190 MHz to a HPHT 125 nm, 100 mgmL-1 sample. The 1H signal from the water surrounding the ND is then detected through standard inductive NMR techniques after the 1H system has reached equilibrium [see methods]. Under these conditions we observe an enhancement of -4.0 in the 1H spin polarization when EPR power is applied, as shown in Fig. 2(a).
Examining the enhancement produced by different types of ND, Fig. 2(b) shows the sensitivity of the technique to nanoparticle concentration. We draw attention to the data for the HPHT 18 nm NDs, which indicates that at concentrations of 1 mgmL-1, a 33 % change in polarization can be observed. Natural NDs produce a relatively small enhancement, probably due to a relatively low concentration of paramagnetic defects, as seen in their EPR spectra [see Fig. S1(c) for spectra].
Having demonstrated that Overhauser enhancement is possible with ND, we return to Eq. 1 to further consider the conditions needed for optimal imaging. The saturation factor describes the proportion of the EPR linewidth that is driven and takes a maximum value of 1 when the electron transitions are completely saturated at high RF power. To measure the EPR linewidth at ULF we sweep while driving electron transitions at 140 MHz. As shown in Fig. 2(c), HPHT 18 nm and HPHT 125 nm solutions show a linewidth for the enhancement of 0.3 mT at a frequency consistent with the gyromagnetic ratio of a free electron. This result indicates that the paramagnetic centers responsible for the Overhauser effect can be saturated with an ac field, , of 1 mT, which is easily achieved in our spectroscopic probe Mispelter2006 .
Finally, the remaining parameter in Eq. 1 is the leakage factor which describes how effectively electrons relax the nuclear spin environment, taking a maximum value of 1 when all nuclear spin relaxation is via paramagnetic centers. Measuring the spin relaxation time of 1H spins in ND solutions (without applying EPR power) provides a means of characterizing in these systems, as shown in Fig 2(d). We note that ND solutions with shorter , and hence larger , do not necessarily give a higher Overhauser enhancement. For example, NAT 125 nm NDs show a relaxivity more than double that of HPHT 125 nm NDs, despite showing a much smaller enhancement in Fig. 2(b). Presumably, is suppressed in the quasistatic nanophase by slow diffusion of water molecules and the increased paramagnetic nuclear relaxation rate Rej2016 . 1H nuclei ‘trapped’ in the nanophase will experience rapid spin-lattice relaxation, giving the we observe and an overall enhancement that depends on the specifics of each ND surface.
Solutions prepared with air oxidized ND consistently exhibit reduced enhancements and higher relaxivity, as shown for 18 nm HPHT air oxidized NDs in Figs. 2(b) and 2(d). The increased nuclear spin-lattice relaxation rate will contribute to a reduction in Overhauser enhancement and we speculate that the enhancement is further reduced due to a lower concentration of paramagnetic centers after removal of surface impurities by air oxidation.
Overhauser MRI with Nanodiamond
With the conditions that lead to near optimal Overhauser enhancement now established, we turn to demonstrate that this approach can indeed be used as the basis for detecting ND solutions using ultra-low field MRI. Imaging is performed using a custom proton-electron, double resonant probe in an open-access, low-field, human MRI scanner operating at a of 6.5 mT Sarracanie2015 . To display the MRI contrast possible between a ND solution and water we make use of the phantom illustrated in Fig. 3(a), which consists of glass vials filled with 500 L of either DI water or aqueous solutions of HPHT 125 nm ND at 100 mgmL-1 and organized in a diamond-shaped pattern.
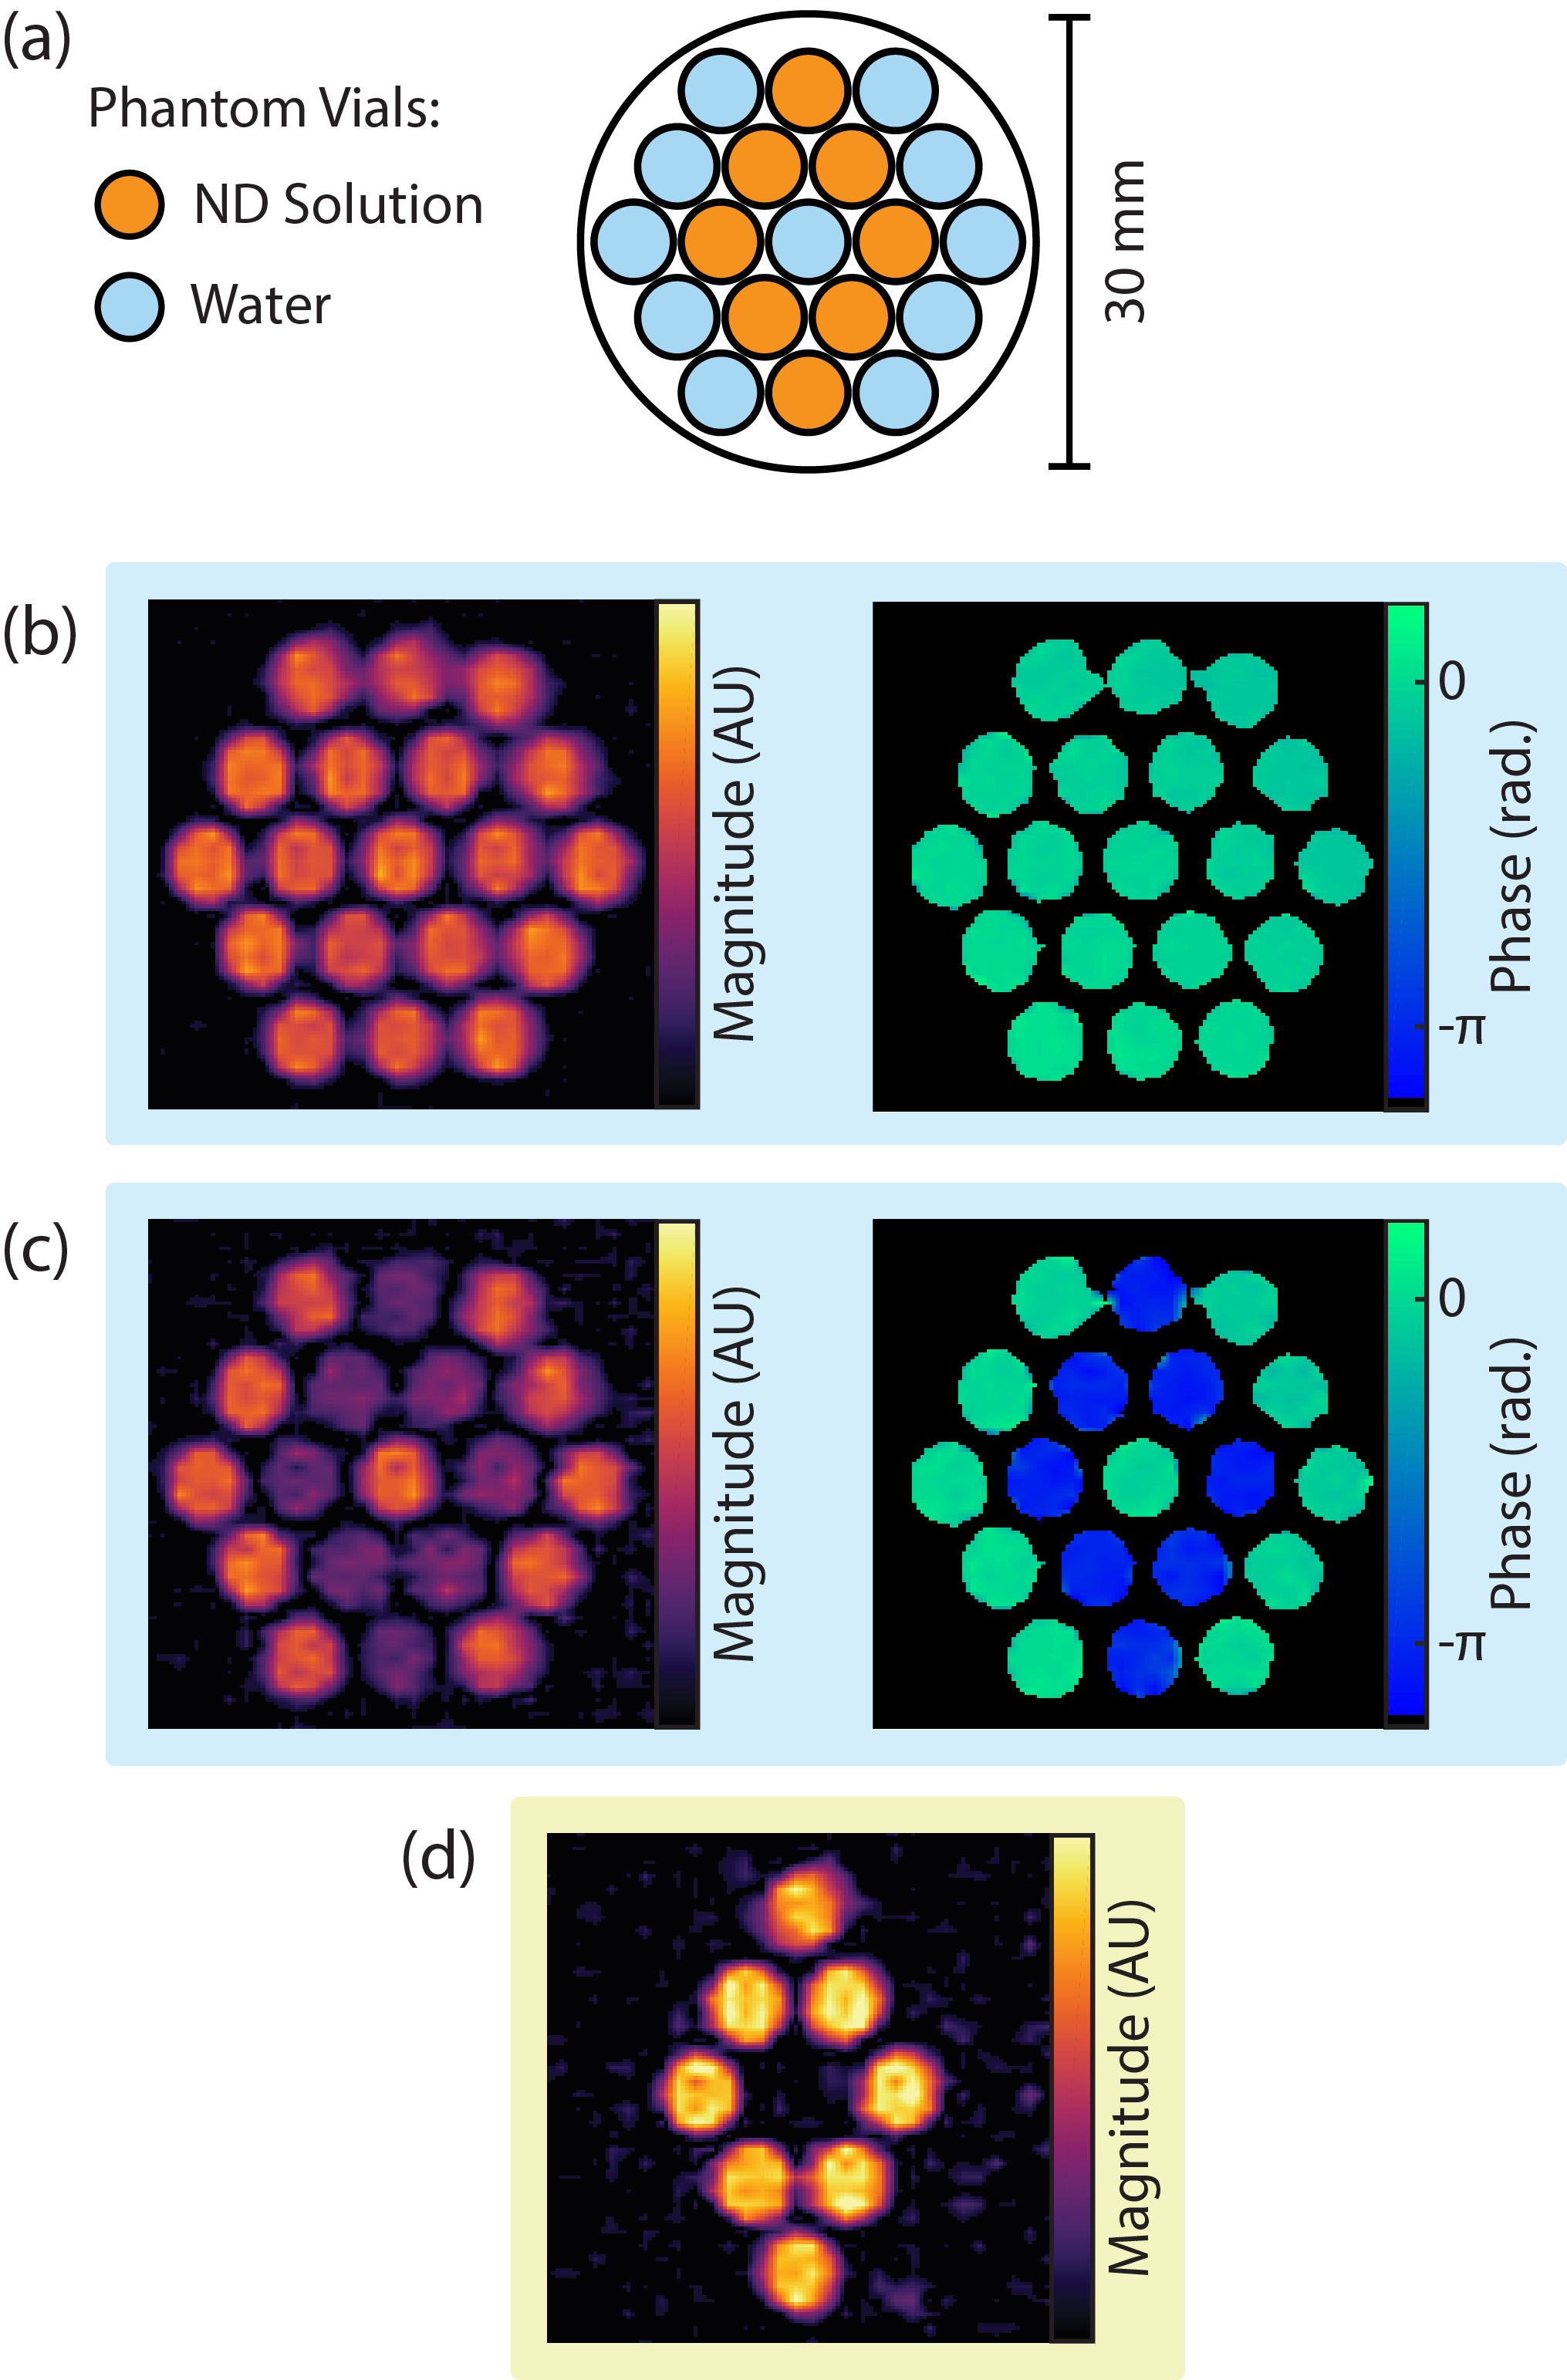
To overcome the low sensitivity of MRI at ultra-low field, the phantom is imaged with a conventional 2D b-SSFP (balanced steady state free precession) MRI sequence in which of the imaging time is spent acquiring signal [see methods for details] Scheffler2003 . Although good spatial resolution is achieved, no discernible contrast is evident between ND solution vials and water vials, as shown in Fig. 3(b). This is not surprising given that contrast using the b-SSFP sequence is produced via 1H concentration and the ratio , which are approximately equal for all vials in the phantom [see Fig. 2(d) for and Fig. S1(b) for ]. We note that obtaining contrast with b-SSFP at ULF is usually challenging, as when , it is a general result that Bottomley1984 .
The phantom is then imaged with a 2D OMRI b-SSFP sequence, as shown in Fig. 3(c). The OMRI b-SSFP sequence is equivalent to the regular b--SSFP sequence except the EPR transition of the ND solution is driven during the phase encode period Sarracanie2013a . The appearance of water vials in the OMRI b-SSFP image is unchanged from the regular b-SSFP image. However, the ND solutions demonstrate significant relative contrast, with a change in magnitude and inversion of signal phase, as a result of the negative enhancement from the Overhauser effect.
The switchable nature of the Overhauser contrast allows us to take the difference of the signal in MRI and OMRI images to generate the image in Fig. 3(d). Such a difference image suppresses the background signal, clearly showing the spatial distribution of NDs. For this difference image we calculate a contrast to noise ratio (CNR) of 30, with the OMRI scan comprising 80 averages, taking 3 min 40 s to complete.
Having shown the feasilibity of ND imaging with OMRI, we can derive the concentration sensitivity limit of the technique from the magnitude of the Overhauser effect and the MRI sensitivity in our setup. Images in Fig. 3 were acquired with 1.5 mg ND per pixel. Assuming a minimum detectable CNR of 2, the magnitude of the Overhauser effect must be 7% of that used in Fig. 3. Our measurements indicate that, under this criteria, HPHT 18 nm NDs should be still detectable at concentrations of 1 mgmL-1 (see Fig. 2(a)). This sets a lower limit for detection of 15 g of ND per pixel, or a particle molar sensitivity of 150 nM. We note that this particle mass sensitivity is equivalent to that reported for other hyperpolarized MRI particle imaging modalities Cassidy2013 .
Discussion and Conclusion
NDs are non-toxic at high concentrations and resist in vivo degradation for periods of over a month Vaijayanthimala2012 . Thus, the results presented here illustrate the potential of nanodiamond OMRI as a practical methodology for long-term biological imaging providing new types of contrast and functionality. All imaging was performed on systems designed for in vivo OMRI with RF powers acceptable for use in vivo Massot2012 , raising the possibility of several exciting biological applications, for example, in the accurate detection of lymph node tumors, which is vital to the treatment of metastatic prostate cancer Harisinghani2003 . Given that nanoparticles 25 nm in size are known to preferentially accumulate only in healthy lymphatic tissue, the ability to detect and image ND in vivo may enable isolation of the disease Reddy2007 . OMRI using NDs of selective size ranges could also allow targeted probing of the permeability of the blood brain barrier, giving a quantifiable measure of disruption in the acute stage of ischemic stroke Roney2005 .
Finally, we remark that surface functionalization could be used to tailor the Overhauser contribution produced by the ND. In this way therapeutic agents attached to the surface could suppress the Overhauser effect by increasing the distance between radicals at their surface and free water, leaving them ‘dark’ in OMRI scans. After targeted drug release, the Overhauser effect could return to normal, showing up ‘bright’ with OMRI and enabling effective tracking of the site of drug delivery. The OMRI approach may also enable the hyperpolarization of fluids flowing across the surface of diamond nanostructures Lingwood2012 ; Abrams2014 ; Meriles2014 .
In conclusion, we have used recent advances in ULF MRI to extend the usefulness of OMRI to nanoparticle imaging. The ability to noninvasively image biocompatible NDs with switchable contrast at biologically relevant concentrations is promising for a range of diagnostic applications. Switchable contrast allows suppression of the background signal present in other and based nanoparticle MRI modalities Bouchard2009 ; Manus2010 ; Xing2009 . Furthermore, the long term biological stability of nanodiamonds in vivo, as well as the unlimited repeatability of the hyperpolarization sequence, raises the possibility of imaging metabolic processes over dramatically longer timescales than is possible with ex situ hyperpolarization techniques Cassidy2013 ; Rej2015a .
Materials and Methods
Spectroscopic measurements at 6.5 mT. The 1H enhancement of ND solutions was measured by saturating the EPR transition at 190 MHz for a period of using 31 W of RF power before a standard NMR FID acquisition. The magnitude of the hyperpolarized FID is compared to an FID taken at thermal equilibrium. A high filling factor Alderman-Grant Resonator was used for EPR with an orthogonal solenoid used for NMR detection. relaxation times were measured using a conventional inversion recovery acquisition.
Overhauser MRI. Imaging was performed at 6.5 mT in our ultra-low field MRI scanner Sarracanie2015 using a b-SSFP Overhauser-enhanced MRI (OMRI) sequence at room temperature Sarracanie2013a . A homebuilt imaging probe was constructed from an Alderman-Grant resonator (EPR: 190 MHz) and a solenoid (1H: 276 kHz). The EPR resonator was pulsed on during the phase encode steps, with 62 W delivered to the EPR resonator at a duty cycle of 52%. Gradient strength was a maximum of 1 mTm-1. Images in Fig. 3 were acquired with a 256 x 40 matrix size and cropped. Data was acquired in 2D with a pixel size of 1.0 mm x 0.76 mm over a 30 mm x 30 mm field of view and interpolated onto 0.25 mm x 0.19 mm pixels. The phantom thickness was 20 mm. The standard MRI was acquired with 200 averages (9 minutes) and the OMRI image with 80 averages (3 minutes 40 seconds). Image magnitude was scaled for an accurate comparison.
Nanodiamond Solution Preparation. NDs used in this study were sourced from Microdiamant, Switzerland. Nanodiamond types used were; monocrystalline, synthetic HPHT NDs in 18 nm (0-30 nm, median diameter 18 nm) and 125 nm (0-250 nm, median diameter 125 nm) sizes; monocrystalline, 125 nm NAT NDs (0-250 nm, median diameter 125 nm); and polycrystalline DET ND (Cluster size 250-1000 nm, median 500 nm. Individual particle size 4-8 nm). Size specifications were provided by the manufacturer. Air oxidized NDs were prepared by placing them in a furnace at standard pressure for one hour at 550 °C after an initial temperature ramp Gaebel2012 . ND samples were mixed with DI water and sonicated with a Branson probe sonicator at 120 W and 50% duty cycle for 40 minutes to disaggregate ND clusters.
Particle size and zeta potential measurements were performed on ND solutions in a Beckman Coulter Delsa Nano C Particle Analyzer. Particle size measurements confirmed that monocrystalline NDs were well dispersed in water after sonication. Particle sizes of monocrystalline NDs were found to be consistent with manufacturer specifications. DET NDs still displayed some clustering and inconsistent particle size in solution after probe sonication.
DNP Linewidth Measurements - B0 Field Sweep. The linewidth of the Overhauser effect was studied by measuring the 1H enhancement at various magnetic field strengths whilst driving the EPR resonator at a frequency of 140 MHz and 25 W. The EPR frequency was lowered from 190 MHz in order to capture the enhancement profile either side of the peak without exceeding the maximum field accessible in our ULF magnet. 1H enhancement was measured as the magnetic field was stepped between 4 mT and 7 mT. NMR detection was performed at the 1H resonance for any given field strength, with a low solenoidal coil.
EPR Measurements. CW EPR measurements were performed on 100 mgmL-1 ND samples in a Bruker ElexSys E500 EPR system. Modulation frequency was 100 kHz at an amplitude of 0.1 G and incident microwave power of 0.6725 mW. Sample volumes in the cavity were kept consistent to allow comparison of relative peak heights. Individual EPR components were simulated in EasySpin Stoll2006 and a least squares analysis was used to find the best fit to the data while varying -factor, linewidth and amplitude.
Acknowledgements
We thank B.D. Armstrong for valuable discussions. This work was supported by the Australian Research Council Centre of Excellence Scheme (Grant No. EQuS CE110001013) ARC DP1094439, the Lockheed Martin Corporation, U.S. Army Medical Research and Materiel Command (USAMRMC), Defense Medical Research and Development Program (DMRDP) award W81XWH-11-2-0076 (DM09094) and the U.S. Army Research Office (ARO) Multidisciplinary University Research Initiative (MURI) award W911NF-15-1-0548. D.E.J.W. was supported by ANSTO and the Australian-American Fulbright Commison. N.S. was supported by the Swiss National Science Foundation (P300P2_147768).
Author Contributions
D.E.J.W., M.S., N.S. and M.S.R. performed the experiment. D.E.J.W., H.Z., E.R., T.G. and T.B. prepared samples and undertook sample characterization. H.Z. and D.R.G. performed the EPR experiments. All authors interpreted, processed and analysed the data. All authors contributed to writing the manuscript.
*Correspondence and requests for materials should be addressed to M.S.R (email: mrosen@cfa.harvard.edu).
References
- (1) Min, Y., Caster, J. M., Eblan, M. J. & Wang, A. Z. Clinical Translation of Nanomedicine. Chem. Rev. 115, 11147–11190 (2015).
- (2) Reddy, S. T. et al. Exploiting lymphatic transport and complement activation in nanoparticle vaccines. Nat. Biotechnol. 25, 1159–1164 (2007).
- (3) Gaur, S. et al. Pharmacodynamic and pharmacogenomic study of the nanoparticle conjugate of camptothecin CRLX101 for the treatment of cancer. Nanomed-Nanotechnol. 10, 1477–86 (2014).
- (4) Almeida, J. P. M., Figueroa, E. R. & Drezek, R. A. Gold nanoparticle mediated cancer immunotherapy. Nanomed-Nanotechnol. 10, 503–514 (2014).
- (5) Liu, Y. et al. Theranostic near-infrared fluorescent nanoplatform for imaging and systemic siRNA delivery to metastatic anaplastic thyroid cancer. Proc. Natl. Acad. Sci. U.S.A. 113, 7750–7755 (2016).
- (6) Harisinghani, M. G. et al. Noninvasive Detection of Clinically Occult Lymph-Node Metastases in Prostate Cancer. New Engl. J. Med. 348, 2491–2499 (2003).
- (7) Chow, E. K. et al. Nanodiamond therapeutic delivery agents mediate enhanced chemoresistant tumor treatment. Sci. Transl. Med 3, 73ra21 (2011).
- (8) Xi, G. et al. Convection-enhanced delivery of nanodiamond drug delivery platforms for intracranial tumor treatment. Nanomed-Nanotechnol. 10, 381–91 (2014).
- (9) Thalhammer, A., Edgington, R. J., Cingolani, L. A., Schoepfer, R. & Jackman, R. B. The use of nanodiamond monolayer coatings to promote the formation of functional neuronal networks. Biomaterials 31, 2097–2104 (2010).
- (10) Zhang, Q. et al. Fluorescent PLLA-nanodiamond composites for bone tissue engineering. Biomaterials 32, 87–94 (2011).
- (11) Schrand, A. M. et al. Are diamond nanoparticles cytotoxic? J. Phys. Chem. B 111, 2–7 (2007).
- (12) McGuinness, L. P. et al. Quantum measurement and orientation tracking of fluorescent nanodiamonds inside living cells. Nat. Nanotechnol. 6, 358–63 (2011).
- (13) Rej, E., Gaebel, T., Boele, T., Waddington, D. E. J. & Reilly, D. J. Hyperpolarized nanodiamond with long spin-relaxation times. Nat. Commun. 6, 1–7 (2015).
- (14) Casabianca, L. B., Shames, A. I., Panich, A. M., Shenderova, O. & Frydman, L. Factors Affecting DNP NMR in Polycrystalline Diamond Samples. J. Phys. Chem. C 115, 19041–19048 (2011).
- (15) Dutta, P., Martinez, G. V. & Gillies, R. J. Nanodiamond as a New Hyperpolarizing Agent and Its 13 C MRS. J. Phys. Chem. Lett. 5, 597–600 (2014).
- (16) Cassidy, M. C., Chan, H. R., Ross, B. D., Bhattacharya, P. K. & Marcus, C. M. In vivo magnetic resonance imaging of hyperpolarized silicon particles. Nat. Nanotechnol. 8, 363–368 (2013).
- (17) Manus, L. M. et al. Gd(III)-nanodiamond conjugates for MRI contrast enhancement. Nano Lett. 10, 484–9 (2010).
- (18) McDonald, R. J. et al. Intracranial Gadolinium Deposition after Contrast-enhanced MR Imaging. Radiology 275, 772–782 (2015).
- (19) Lurie, D. J., Li, H., Petryakov, S. & Zweier, J. L. Development of a PEDRI free-radical imager using a 0.38 T clinical MRI system. Magn. Reson. Med. 47, 181–186 (2002).
- (20) Golman, K., Leunbach, I., Petersson, J. S., Holz, D. & Overweg, J. Overhauser-enhanced MRI. Acad. Radiol. 9(suppl 1), S104–S108 (2002).
- (21) Koonjoo, N. et al. In vivo Overhauser-enhanced MRI of proteolytic activity. Contrast Media Mol. Imaging 9, 363–371 (2014).
- (22) Ichikawa, K. & Yasukawa, K. Imaging in vivo redox status in high spatial resolution with OMRI. Free Radical Res. 46, 1004–1010 (2012).
- (23) Sarracanie, M., Armstrong, B. D., Stockmann, J. & Rosen, M. S. High speed 3D overhauser-enhanced MRI using combined b-SSFP and compressed sensing. Magn. Reson. Med. 71, 735–745 (2013).
- (24) Gaebel, T. et al. Size-reduction of nanodiamonds via air oxidation. Diam. Rel. Mater. 21, 28–32 (2012).
- (25) Ravera, E., Luchinat, C. & Parigi, G. Basic facts and perspectives of Overhauser DNP NMR. Journal of Magnetic Resonance 264, 78–87 (2016).
- (26) Clarkson, R. B. et al. Electron paramagnetic resonance and dynamic nuclear polarization of char suspensions: surface science and oximetry. Phys. Med. Biol. 43, 1907–1920 (1998).
- (27) Ardenkjaer-Larsen, J. H. et al. EPR and DNP Properties of Certain Novel Single Electron Contrast Agents Intended for Oximetric Imaging. J. Magn. Reson. 133, MN981438 (1998).
- (28) Panich, A. M., Sergeev, N. A., Shames, A. I., Osipov, V. Y. & Boudou, J.-p. Size dependence of 13 C nuclear spin-lattice relaxation in micro- and nanodiamonds. J. Phys.: Condens. Matter 27, 72203 (2015).
- (29) Cui, J.-F., Fang, X.-W. & Schmidt-Rohr, K. Quantification of C=C and C=O Surface Carbons in Detonation Nanodiamond by NMR. J. Phys. Chem. C 118, 9621–9627 (2014).
- (30) Stoll, S. & Schweiger, A. EasySpin, a comprehensive software package for spectral simulation and analysis in EPR. J. Magn. Reson. 178, 42–55 (2006).
- (31) Yavkin, B. V., Mamin, G. V., Gafurov, M. R. & Orlinskii, S. B. Size-dependent concentration of N0 paramagnetic centres in HPHT nanodiamonds. Magn. Reson. Solids 17, 15101 (2015).
- (32) Günther, U. L. Dynamic Nuclear Hyperpolarization in Liquids. Top. Curr. Chem. 335, 23–69 (2011).
- (33) Korobov, M., V., A. N., Bogachev, A. G., Rozhkova, N. N. & Osawa, E. Nanophase of water in nano-diamond gel. J. Phys. Chem. C 111, 7330–7334 (2007).
- (34) Armstrong, B. D. & Han, S. Overhauser dynamic nuclear polarization to study local water dynamics. J. Am. Chem. Soc. 131, 4641–7 (2009).
- (35) Tóth, É., Helm, L. & Merbach, A. E. Relaxivity of MRI Contrast Agents. Top. Curr. Chem. 221, 61–101 (2002).
- (36) Hwang, L.-P. & Freed, J. H. Dynamic effects of pair correlation functions on spin relaxation by translational diffusion in liquids. J. Chem. Phys. 63, 4017–4025 (1975).
- (37) Freed, J. Dynamic effects of pair correlation functions on spin relaxation by translational diffusion in liquids. II. Finite jumps and independent T1 processes. J. Chem. Phys. 68, 4034–4037 (1978).
- (38) Gabriel, C., Gabriel, S., Grant, E. H., Halstead, B. S. J. & Mingos, D. M. P. Dielectric Parameters Relevant to Microwave Dielectric Heating. Chem. Soc. Rev. 27, 213–223 (1998).
- (39) Mispelter, J., Mikaela, L. & Briguet, A. NMR Probeheads for Biophysical and Biomedical Experiments (Imperial College Press, 2006).
- (40) Rej, E., Gaebel, T., Waddington, D. E. J. & Reilly, D. J. Hyperpolarized Nanodiamond Surfaces. arXiv 1606.06822, 1–19 (2016).
- (41) Sarracanie, M. et al. Low-Cost High-Performance MRI. Sci. Rep. 5, 15177 (2015).
- (42) Scheffler, K. & Lehnhardt, S. Principles and applications of balanced SSFP techniques. Eur. Radiol. 13, 2409–2418 (2003).
- (43) Bottomley, P. A., Foster, T. H., Argersinger, R. E. & Pfeifer, L. M. A review of normal tissue hydrogen NMR relaxation times and relaxation mechanisms from 1–100 MHz: Dependence on tissue type, NMR frequency, temperature, species, excision, and age. Med. Phys. 11, 425–448 (1984).
- (44) Vaijayanthimala, V. et al. The long-term stability and biocompatibility of fluorescent nanodiamond as an in vivo contrast agent. Biomaterials 33, 7794–7802 (2012).
- (45) Massot, P. et al. In vivo high-resolution 3D overhauser-enhanced MRI in mice at 0.2 T. Contrast Media Mol. Imaging 7, 45–50 (2012).
- (46) Roney, C. et al. Targeted nanoparticles for drug delivery through the blood-brain barrier for Alzheimer’s disease. J. Control. Release 108, 193–214 (2005).
- (47) Lingwood, M. D., Siaw, T. A., Chan, H. R. & Ross, B. D. Hyperpolarized Water as an MR imaging contrast agent : Feasibility of in Vivo Imaging in a Rat Model. Radiology 265, 418–425 (2012).
- (48) Abrams, D., Trusheim, M. E., Englund, D. R., Shattuck, M. D. & Meriles, C. A. Dynamic nuclear spin polarization of liquids and gases in contact with nanostructured diamond. Nano Lett. 14, 2471–8 (2014).
- (49) Meriles, C. A. & Doherty, M. W. Generation of spin-polarized currents via cross-relaxation with dynamically pumped paramagnetic impurities. Appl. Phys. Lett. 105, 022403 (2014).
- (50) Bouchard, L.-S. et al. Picomolar sensitivity MRI and photoacoustic imaging of cobalt nanoparticles. Proc. Natl. Acad. Sci. U.S.A. 106, 4085–4089 (2009).
- (51) Xing, Y. & Dai, L. Nanodiamonds for nanomedicine. Nanomedicine-UK 4, 207–218 (2009).