Testing the dark matter subhalo hypothesis of the gamma-ray source 3FGL J2212.5+0703
Abstract
N-body simulations predict that galaxies at the Milky Way scale host a large number of dark matter (DM) subhalos. Some of these subhalos, if they are massive enough or close enough to the Earth, might be detectable in rays due to the DM annihilation. 3FGL J2212.5+0703, an unidentified gamma-ray source, has been suggested to be the counterpart candidate of a DM subhalo by Bertoni et al. (2015, 2016). In this work we analyze the Fermi-LAT Pass 8 data of 3FGL J2212.5+0703 to independently test the DM subhalo hypothesis of this source. In order to suppress the possible contamination from two nearby very-bright blazars, we just take into account the front-converting gamma-rays which have better angular resolutions than that of the back-converting photons. In addition to the spatial distribution analysis, we have extended the spectrum analysis down to the energies of MeV, and thoroughly examined the variability of the emission during the past 8 years. We confirm that 3FGL J2212.5+0703 is a steady and spatially-extended gamma-ray emitter at a high confidence level. The spectrum is well consistent with that expected from DM annihilation into . The introduction of a phenomenological LogParabola spectrum just improves the fit slightly. All these results suggest that 3FGL J2212.5+0703 could be indicative of a DM subhalo.
pacs:
95.35.+dI Introduction
Compelling evidence indicates that dark matter (DM) plays a significant role in many gravitational phenomena such as the galactic rotation curves, the galaxy cluster dynamics, and the cosmic microwave background Jungman et al. (1996); Bertone et al. (2005); Bertone & Hooper (2016). The latest measurements suggest that DM constitutes 84.3% of the matter density in the current universe Ade et al. (2016). Abundant as DM is, its particle physics nature remains unknown. Various well-motivated DM candidates have been proposed in the literature and the leading candidate is the weakly interacting massive particles (WIMPs) Jungman et al. (1996); Bertone et al. (2005); Hooper & Profumo (2007); Feng (2010); Bertone & Hooper (2016); Charles et al. (2016). WIMPs may annihilate or decay and finally produce stable high-energy particle pairs, including for example electrons/positrons, protons/anti-protons, neutrinos/anti-neutrinos and gamma-rays. These stable particles contribute to the cosmic radiation. The identification of these DM-originated particles in the gamma-ray and cosmic ray data is the prime goal of dark matter indirect detection. DM induced rays are either from the decay or hadronization of the final state particles (i.e. prompt radiation), or from the final state particles interacting with interstellar medium or interstellar radiation field (i.e. secondary radiation). Unlike the charged particles that are deflected by the magnetic fields, gamma-rays travel straightforwardly and their morphology trace the distribution of the emitting sources directly. Therefore the searches for DM signal in the gamma-ray data, benefited from the spatial correlation with the DM distribution, have attracted wide attention. This is in particular the case after the successful launch of Fermi Gamma-ray Space Telescope in June 2008 Atwood et al. (2009); Charles et al. (2016). Great efforts have been made to analyze the Fermi-LAT (Large Area Telescope) data, but no reliable DM signal has been identified so far (see Charles et al. (2016) for a recent review).
Among various targets, the Milky Way dwarf spheroidal galaxies (dSphs), dominated by DM and in short of high energy astrophysical processes, are promising regions to identify the DM signal indirectly. The identification of dSphs in optical however is rather challenging due to their low luminosities. Until recently, only 25 dSphs were found by the Sloan Digital Sky Survey (SDSS) York et al. (2000) and the observations prior to it (see McConnachie (2012) and the references therein). Over the past two years, 23 more dSphs (including candidates) have been discovered due to new optical image surveys Bechtol et al. (2015); Drlica-Wagner et al. (2015a); Koposov et al. (2015); Kim et al. (2015a); Laevens et al. (2015a, b); Martin et al. (2015); Kim et al. (2015b) such as the Dark Energy Survey (DES) Abbott et al. (2005) and the Pan-STARRS1 3 survey Kaiser et al. (2002), or due to the reanalysis of the SDSS data. Although many analyses have been conducted in search for the -ray emission from these dSph sources and candidates Abdo et al. (2010); Ackermann et al. (2011); Geringer-Sameth et al. (2011); Tsai et al. (2013); Mazziotta et al. (2012); Cholis et al. (2012); Ackermann et al. (2014); Geringer-Sameth et al. (2015a, b); Drlica-Wagner et al. (2015b); Ackermann et al. (2015); Hooper and Linden (2015); Baring et al. (2016); Li et al. (2016); Ahnen et al. (2016); Liang et al. (2016); Albert et al. (2016), none of them displays a statistically-significant signal (Tentative gamma-ray emission signals were reported in Ret II Geringer-Sameth et al. (2015b); Drlica-Wagner et al. (2015b) and Tuc III Li et al. (2016); Albert et al. (2016)).
DM subhalos are also promising targets for DM indirect detection. In the standard hierarchical structure formation theory, dark matter particles accumulate to become small halos, and then merge repeatedly to form larger halos. Some of the halos, if survived from the tidal stripping and virialization, become subhalos of the main halo White et al. (1978, 1991). N-body simulations at the scale of Milky Way show much more subhalos than satellites observed at optical wavelength Diemand et al. (2007); Springel et al. (2008), indicating the majority of them contain little stars or gas. DM subhalos, either massive enough or close enough to the Earth, could be visible in the gamma-ray band Springel et al. (2008); Yuan et al. (2012). More specifically, if 40 GeV DM particles annihilate with a cross section near the latest upper limit, Fermi-LAT might have recorded DM subhalos Kuhlen et al. (2008); Anderson et al. (2010); Buckley et al. (2010); Belikov et al. (2012); Bertoni et al. (2015); Schoonenberg et al. (2016). Due to the short of stars and gas, DM subhalos may be only detectable in gamma-rays and hence are members of the unidentified gamma-ray sources. Dedicated efforts have been made to search for such objects Buckley et al. (2010); Mirabal et al. (2010); Belikov et al. (2012); Zechlin et al. (2012a); Ackermann et al. (2012); Mirabal et al. (2012); Zechlin et al. (2012b); Berlin et al. (2014); Bertoni et al. (2015); Schoonenberg et al. (2016); Bertoni et al. (2016); Mirabal et al. (2016); Hooper & Witte (2016). For instance, by fitting spectral energy distribution (SED) with DM spectra, bright high latitude point sources are investigated in Buckley et al. (2010); Belikov et al. (2012); Bertoni et al. (2015, 2016); Schoonenberg et al. (2016). Candidates are selected from the spectrally hard sources and their multi-wavelength counterparts are examined in Zechlin et al. (2012a, b). Independent source candidates created with looser assumptions on the spectrum are studied in Ackermann et al. (2012). Machine learning algorithms are also used to classify un-associated sources, and outliers, which are probably DM subhalos, are selected Mirabal et al. (2010, 2012, 2016). One very attractive finding is the identification of a spatially-extended source, 3FGL J2212.5+0703, among the unidentified sources Bertoni et al. (2015, 2016) in the Fermi-LAT third source catalog (3FGL). In astrophysical scenarios it is rather hard to give rise to a spatially-extended steady source without any association in other wavelength. Therefore 3FGL J2212.5+0703 is an interesting DM subhalo candidate, as stressed in Bertoni et al. (2016).
Independent analysis is thus necessary to check whether it is indeed the case. For such a purpose, in this work we re-analyze the spatial, temporal and spectral characters of 3FGL J2212.5+0703. The difference between this work and Bertoni et al. (2015, 2016) are the following: (1) In order to effectively suppress the possible contamination from two nearby extremely-bright blazars (3FGL J2254.0+1608 and 3FGL J2232.5+1143), we just take into account the front-converting gamma-rays that have angular resolutions better than the back-converting photons; (2) We have extended the spectrum analysis down to the energy MeV and special attention has been given to the possible improvement in the fit by introducing a phenomenological shape in comparison to the model. Note that if significant improvement is found, the astrophysical origin will be favored; (3) The variability of the emission in the past 8 years rather than just the first four years has been thoroughly examined to better test the stability.
II Observation and data analysis
Fermi-LAT Pass 8 is the most recent iteration of the event-level analysis, which reduces the ghost events (thus leading to an increased effective area and a better point-spread function), extends the energy reach, and introduces new event type partitions Atwood et al. (2013). In this work, we use the front-converting Pass 8 Source data set111ftp://legacy.gsfc.nasa.gov/fermi/data/lat/weekly/photon/ (irfs=P8R2_SOURCE_V6, evtype=1) and the up-to-date Fermi ScienceTools222version v10r0p5, available at http://fermi.gsfc.nasa.gov/ssc/data/analysis/software/. We select the data from October 27, 2008 to June 15, 2016 (i.e. Mission Elapsed Time (MET) range 246823875-487641604), and restrict the energy range from 100 to 500 . To avoid significant contamination from the Earth’s albedo, photons with zenith angle greater than 90∘ are excluded. Quality-filter cuts (DATA_QUAL==1 && LAT_CONFIG==1) are also applied so as to remove the events and time intervals while the instrument is not in science configuration, or when either bright solar flares or particle events occur.333http://fermi.gsfc.nasa.gov/ssc/data/analysis/documentation/Cicerone/Cicerone_Data_Exploration/Data_preparation.html We consider the photons within a box centered on the position (, Acero et al. (2015)) so as to include at least 95% photons444http://www.slac.stanford.edu/exp/glast/groups/canda/lat_Performance.htm of 3FGL J2212.5+0703 at 100 . In order to perform binned analyses, photons are divided into spatial bins and 30 logarithmic energy bins.
With the help of the user-contributed script make3FGLxml.py555http://fermi.gsfc.nasa.gov/ssc/data/analysis/user/, all 3FGL sources within 25∘ from the target source Acero et al. (2015) as well as the Galactic diffuse rays emission model gll_iem_v06.fits and the isotropic emission template for the front-converting Source data selection iso_P8R2_SOURCE_V6_FRONT_v06.txt666http://fermi.gsfc.nasa.gov/ssc/data/access/lat/BackgroundModels.html Acero et al. (2016) are included in the fit. We leave free the spectra of the sources within 10∘ around 3FGL J2212.5+0703, and the normalizations of the two diffuse emission backgrounds. Note that one of the brightest blazars in the -ray band, 3FGL J2254.0+1608 (3C 454.3), is at the edge of the region of interest (ROI), whose influence is too significant to be ignored. Therefore we leave its spectral parameters free, even though it is outside the radius circle. We convolve all these models with the instrument response functions (IRFs) using gtsrcmaps, and then perform the fittings with the pyLikelihood code utilizing the MINUIT algorithm James (1975). As recommended in Fermi Science Center777http://fermi.gsfc.nasa.gov/ssc/data/analysis/LAT_caveats.html, we take into account the energy dispersion of all free sources except the two diffuse emission models.
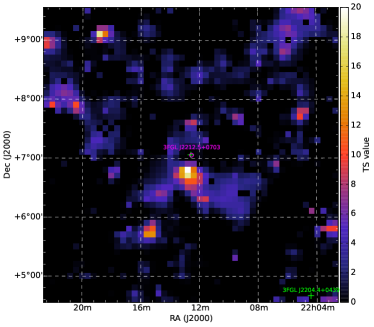
To check whether there is any significant residual in the ROI, we utilize the gttsmap tool to generate test statistic (TS) maps, which are shown in Fig.1. The TS is defined as Mattox et al. (1996), where and are the best-fit likelihood values of the alternative hypothesis (i.e. include a point source) and null hypothesis (i.e. background only), respectively. We make a TS map and find three new point sources within 10∘ distance from the ROI center with a TS value larger than 25. We first add these new point sources into the model with power-law spectra and coarse locations derived from the TS map, then do a fitting with energy dispersion turned off. Using that fitted model as an input, the positions of these point sources as well as the target source 3FGL J2212.5+0703 are optimized with gtfindsrc. With the best fit positions, we further fit the spectra with energy dispersion enabled and the results are summarized in Tab.1.
| Source Name | R.A.(∘) | Decl.(∘) | TS |
|---|---|---|---|
| 3FGL J2212.5+0703 (pts) | 333.13 | 7.06 | 320.2 |
| newpt0 | 327.22 | -1.33 | 25.9 |
| newpt1 | 329.05 | -0.61 | 146.7 |
| newpt2 | 332.77 | -0.06 | 36.3 |
Note that our spectral parameters of the center source are in agreement with the values listed in the 3FGL catalog (within the confidence level). Moreover, there is almost no shift in position for 3FGL J2212.5+0703.
II.1 Spatial Extension
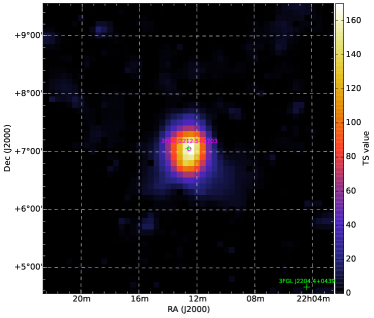
Spatial extension is an important property for a source. As argued in Bertoni et al. (2016), an unambiguously spatially extended source without multi-wavelength associations could be a nearby DM subhalo. In the left pannel of Fig.1, some residuals remain near 3FGL J2212.5+0703 when we model it with a point source template. To get a quick insight into the morphology of 3FGL J2212.5+0703, we exclude it from the model and calculate the TS map again. The TS map is exhibited in the right pannel of Fig.1. 3FGL J2212.5+0703 appears elliptical in TS map, and the residual in the left pannel of Fig.1 is caused by the incorrect spatial template.
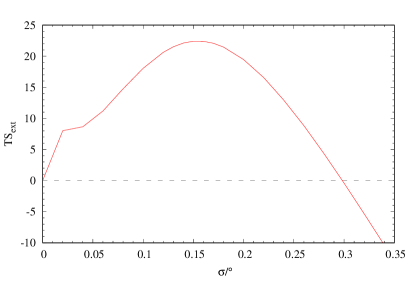
Following Bertoni et al. (2015), to quantify the spatial extension we use a series of 2-D Gaussian distributions with different widths as spatial templates. Based on the optimized model in the previous subsection, we change the spatial template and perform optimizations. The same likelihood ratio test is applied to achieve the best-fit spatial extension and the corresponding significance. We define the TS for spatial extension to be
| (1) |
where and are the best fit likelihood values for the point-source model and the Gaussian model, respectively Lande et al. (2012). Fig.2 depicts the relation between the widths and the TS values. We find that the Gaussian template with a width of 015 best describes the data and the corresponding value is 22.4, implying that the spatial-extended source model is better than the point-source model at a confidence level of Chernoff (1954); Lande et al. (2012). Such an improvement is smaller than that reported in Bertoni et al. (2016) since in this work different spatial templates are used and just the front-converting Pass 8 data have been taken into account.
II.2 The Light Curve and Variability
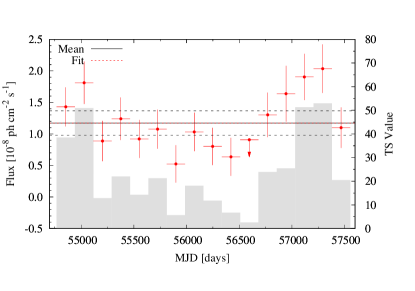
The -ray signal from DM annihilation in a subhalo should be steady while the astrophysical signal may be variable. With approximately 4 more years of data compared with 3FGL Acero et al. (2015), we can better test the compatibility of 3FGL J2212.5+0703 with a non-variable source. The data are separated into 16 time bins equally. We use the best-fit Gaussian template, and set free the normalization of the isotropic emission as well as the prefactors of the sources within 10∘ around 3FGL J2212.5+0703. To better model the nearby bright blazars, 3FGL J2254.0+1608 and 3FGL J2232.5+1143, we free both the normalizations and the indexes of them. A fitting is performed in each time bin, and the likelihood profile of the target source is calculated.
The flux in each time bin is computed and the light curve of 3FGL J2212.5+0703 is yielded, as shown in Fig.3. The variability index is defined as Nolan et al. (2012)
| (2) |
where for the i-th time bin, is the likelihood value, is the photon flux integrated over the energy range from 100 to 500 , is the statistical uncertainty888We use the upper error of the flux. of the flux . is the flux if the source is constant, and is the systematic correction factor. Following Acero et al. (2015) we also take into account a 2% systematic correction factor. Using the likelihood profile we fit in the above expression. The variability index is found to be 33.2 after the optimization, which corresponds to a significance of for the deviation from the non-variable hypothesis, for an approximate distribution with 15 degrees of freedom Wilks (1938). The variability at time scales shorter than 6 months may not be effectively reflected in the above analysis, so we further do similar calculation using the data with one-month’s time bin. To make the fitting stable, we fix the indexes of the two blazars mentioned above. The variability index is found to be 123.2, corresponding to a significance for 92 degrees of freedom.
II.3 Spectral Analysis
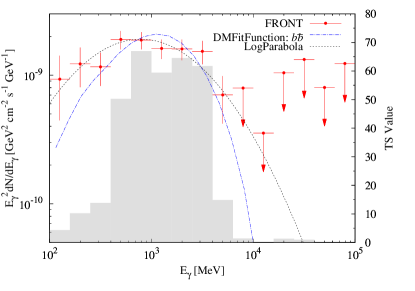
The rays from DM annihilation are characterized by a hard low-energy spectrum and a sharp cutoff at the mass of the DM particle, so it is possible to distinguish between the DM model and the astrophysical origin model with the spectral information. If an “astrophysical” spectrum model can significantly better fit the gamma-ray data than the DM one, and meanwhile give a flat spectrum in low energy range, a DM origin would be disfavored. We compute the SED of 3FGL J2212.5+0703 to illustrate the spectrum in a model-independent way. The data are binned with 15 equal logarithmic energy bins within the energy range from 100 to 100 . We set the indexes of all sources frozen, and optimize their normalizations in each energy bin. The intensity and TS value in each energy bin are shown in Fig.4. According to the derived SED, we find that the spectrum of the target source is curved and can be well described by a LogParabola spectrum, which is the phenomenological model given in the catalog. The DM spectrum model can well fit the data too (The spectrum might be a bit softer than the model at energies below 300 MeV. The error bars however are too large).
In order to compare the two spectral models quantitatively, we fit the data from 100 to 500 using the DMFitFunction with the primary decay channel and the LogParabola model999We use the table gammamc_dif.dat, which is required in DMFitFunction, contained in the FermiPy package. FermiPy can be downloaded from https://github.com/fermiPy/fermipy, respectively. The optimized spectra obtained in these fittings are also plotted in the Fig.4. In the DM model, observational data favor a DM particle with a mass of . Considering the probability function of DM mass may not be a Gaussian distribution, we make a likelihood profile to find a more accurate 1 confidence interval (CI) of DM mass. We use a series of DM annihilation spectra from different DM masses, and do the fittings. The edges of the 1 CI correspond to the models where the log-likelihood is 0.5 smaller than the maximum one Conrad (2015). We find the 1 CI of DM mass to be (15.7, 20.9) .101010We also use the DM spectra from the PPPC4 Cirelli et al. (2011) and make the likelihood profile. We find the best fit mass is about 20.0 and the 1 CI is (17.8, 23.2) . We note the CI is different from that in Bertoni et al. (2016), which is due to the different spatial morphology and analysis method. The spectral TS,
| (3) |
is calculated, where and are maximum likelihood values for the LogParabola model and the DMFitFunction model, respectively. Through the fit, we find to be 7.0, which indicates the LogParabola model is more compatible with the data. Please bear in mind that the two spectral models are not nested in parameter space, so a significance can not be obtained from the Wilks theorem Wilks (1938). Since the TS value is quite small, the preference of the LogParabola model is weak. More data are needed to draw a better conclusion.
III Discussion and conclusion
DM subhalos are interesting targets for dark matter indirect detection. In principle some DM subhalos with little stars and dust may be only detectable in gamma-rays and are thus members of unidentified gamma-ray sources. After the successful performance of Fermi-LAT, great efforts have been made to identify such sources and one very attractive finding is the identification of a spatially-extended source, 3FGL J2212.5+0703, among the unidentified sources Bertoni et al. (2015, 2016) in the Fermi-LAT 3FGL. Usually, the astrophysical processes are hard to give rise to a spatially-extended steady source without any signals in other bands. Therefore 3FGL J2212.5+0703 is an interesting DM subhalo candidate, as stressed in Bertoni et al. (2016). Extended and independent analysis is necessary to check whether it is indeed the case. In this work we re-analyze the spatial, temporal and spectral characteristics of 3FGL J2212.5+0703. In order to effectively reduce the possible contamination from two nearby extremely-bright blazars (3FGL J2254.0+1608 and 3FGL J2232.5+1143), just the front-converting gamma-rays (with better angular resolutions than the back-converting photons) have been taken into account. With such data we confirm that 3FGL J2212.5+0703 is indeed a spatially-extended source rather than a point-source and the optimized template has a width of 015. We have also extended the spectrum analysis down to the energy MeV and the main goal is to test whether an “astrophysical” spectrum model (i.e., the phenomenological LogParabola model) can significantly better fit the gamma-ray data than the simple DM channel model. No significant improvement is found (The increase in is just ), implying that both the astrophysical model and the DM model (with a rest mass GeV) work almost equally well. In principle, the spectral model can be better constrained as more data have been collected in the future. However, it is unlikely that the Fermi-LAT data for 3FGL J2212.5+0703 can be doubled. Even for the doubled gamma-ray data, it seems still challenging to distinguish between the two types of spectral models. Finally we checked the possible variability in the years’ data and did not find significant evidence for deviation from a constant flux.
If 3FGL J2212.5+0703 is indeed a DM subhalo, its parameters can not be too extreme compared with those in N-body simulations. Since the flux of the optimized DM model (with a rest mass ) from 100 to 500 is , if the velocity-averaged annihilation cross-section of DM particles is assumed to be , we can derive that , where is the mass density of the subhalo and is the distance between the Sun and the source. Referring to clump luminosity-distance plane shown in Fig. 2 of Brun et al. (2009), we find the target source is near the median distances calculated from a random sample of observer positions. Therefore a DM subhalo origin is not challenged.
Our conclusion is thus 3FGL J2212.5+0703 is indeed a steady spatially-extended un-identified gamma-ray source. These remarkable characteristics are compatible with the gamma-ray signal from a self-annihilating DM subhalo though how to yield such bright emission is still to be figured out. The other possibility that 3FGL J2212.5+0703 actually consists of two or more very nearby -ray sources also deserves a further investigation. More -ray data as well as deeper multi-wavelength observations are needed to draw a final conclusion.
Acknowledgements.
We would like to thank Dr. X. Li for useful discussions. This research has made use of data obtained from the High Energy Astrophysics Science Archive Research Center (HEASARC), provided by NASA Goddard Space Flight Center. This research has also used IPython Perez et al. (2007), NumPy, SciPy van der Walt et al. (2011), Matplotlib Hunter (2007), Astropy Robitaille et al. (2014), F2PY Peterson (2009), APLpy111111http://aplpy.github.com and iminuit121212https://github.com/iminuit/iminuit. This work was supported in part by the National Basic Research Program of China (No. 2013CB837000) and the National Key Program for Research and Development (No. 2016YFA0400200), the National Natural Science Foundation of China under grants No. 11525313 (that is the Funds for Distinguished Young Scholars), No. 11103084, No. 11303098 and No. 11303105, and the 100 Talents program of Chinese Academy of Sciences.∗Corresponding authors: liangyf@pmo.ac.cn (YFL), zqshen@pmo.ac.cn (ZQS), lishang@pmo.ac.cn (SL), yzfan@pmo.ac.cn (YZF).
References
- Jungman et al. (1996) G. Jungman, M. Kamionkowski, and K. Griest, Phys. Rept. 267, 195 (1996).
- Bertone et al. (2005) G. Bertone, D. Hooper, and J. Silk, Phys. Rept. 405, 279 (2005), hep-ph/0404175.
- Bertone & Hooper (2016) G. Bertone and D. Hooper, arXiv:1605.04909.
- Ade et al. (2016) P. A. R. Ade, et al. [Planck Collaboration], Astron. Astrophys. 594, A13 (2016).
- Hooper & Profumo (2007) D. Hooper and S. Profumo, Phys. Rept. 453, 29 (2007), hep-ph/0701197.
- Feng (2010) J. L. Feng, Ann. Rev. Astron. Astrophys. 48, 495 (2010).
- Charles et al. (2016) E. Charles, et al., Phys. Rept. 636, 1 (2016).
- Atwood et al. (2009) W. Atwood, et al. [Fermi-LAT Collaboration], Astrophys. J. 697, 1071 (2009).
- York et al. (2000) D. G. York, et al. [SDSS Collaboration], Astron. J. 120, 1579 (2000).
- McConnachie (2012) A. W. McConnachie, Astron. J., 144, 4 (2012).
- Bechtol et al. (2015) K. Bechtol, A. Drlica-Wagner, et al. [DES Collaboration], Astrophys. J., 807, 50 (2015).
- Drlica-Wagner et al. (2015a) A. Drlica-Wagner, K. Bechtol, et al. [DES Collaboration], Astrophys. J., 813, 109 (2015).
- Koposov et al. (2015) S. E. Koposov, V. Belokurov, et al., Astrophys. J., 805, 130 (2015).
- Kim et al. (2015a) D. Kim and H. Jerjen, Astrophys. J. Lett., 808, L39 (2015).
- Laevens et al. (2015a) B. P. M. Laevens, N. F. Martin, et al., Astrophys. J. Lett., 802, L18 (2015).
- Laevens et al. (2015b) B. P. M. Laevens, N. F. Martin, et al., Astrophys. J., 813, 44 (2015).
- Martin et al. (2015) N. F. Martin, D. L. Nidever, et al., Astrophys. J. Lett., 804, L5 (2015).
- Kim et al. (2015b) D. Kim, H. Jerjen, et al., Astrophys. J. Lett., 804, L44 (2015).
- Abbott et al. (2005) T. Abbott, et al. [DES Collaboration], arXiv:astro-ph/0510346.
- Kaiser et al. (2002) N. Kaiser, et al. Proc.SPIE Int.Soc.Opt.Eng. 4836, 154 (2002).
- Abdo et al. (2010) A. A. Abdo, et al. [Fermi-LAT collaboration], Astrophys. J. 712, 147 (2010).
- Ackermann et al. (2011) M. Ackermann, et al. [Fermi-LAT collaboration], Phys. Rev. Lett. 107, 241302 (2011).
- Geringer-Sameth et al. (2011) A. Geringer-Sameth and S. M. Koushiappas, Phys. Rev. Lett. 107, 241303 (2011).
- Tsai et al. (2013) Y.-L. S. Tsai, Q. Yuan, and X. Huang, J. Cosmol. Astropart. Phys. 03, 018 (2013).
- Mazziotta et al. (2012) M. N. Mazziotta, F. Loparco, F. de Palma, and N. Giglietto, Astropart. Phys. 37, 26 (2012).
- Cholis et al. (2012) I. Cholis and P. Salucci, Phys. Rev. D 86, 023528 (2012).
- Ackermann et al. (2014) M. Ackermann, et al. [Fermi-LAT collaboration], Phys. Rev. D 89, 042001 (2014).
- Geringer-Sameth et al. (2015a) A. Geringer-Sameth, S. M. Koushiappas, and M. G. Walker, Phys. Rev. D 91, 083535 (2015).
- Geringer-Sameth et al. (2015b) A. Geringer-Sameth, M. G. Walker, et al., Phys. Rev. Lett. 115, 081101 (2015).
- Drlica-Wagner et al. (2015b) A. Drlica-Wagner, A. Albert, et al. [Fermi-LAT collaboration], Astrophys. J. Lett. 809, L4 (2015).
- Ackermann et al. (2015) M. Ackermann, et al. [Fermi-LAT collaboration], Phys. Rev. Lett. 115, 231301 (2015).
- Hooper and Linden (2015) D. Hooper and T. Linden, J. Cosmol. Astropart. Phys., 9, 016 (2015).
- Baring et al. (2016) M. G. Baring, T. Ghosh, F. S. Queiroz, and K. Sinha, Phys. Rev. D 93, 103009 (2016).
- Li et al. (2016) S. Li, Y.-F. Liang, et al., Phys. Rev. D, 93, 043518 (2016).
- Ahnen et al. (2016) M. L. Ahnen, et al. [MAGIC collaboration], J. Cosmol. Astropart. Phys., 2, 039 (2016).
- Liang et al. (2016) Y.-F. Liang, Z.-Q. Xia, et al., Phys. Rev. D 94, 103502 (2016).
- Albert et al. (2016) A. Albert, et al. [Fermi-LAT collaboration and DES collaboration], arXiv:1611.03184.
- White et al. (1978) S. D. M. White and M. J. Rees, Mon. Not. R. Astron. Soc. 183, 341 (1978).
- White et al. (1991) S. D. M. White and C. S. Frenk, Astrophys. J. 379, 52 (1991).
- Diemand et al. (2007) J. Diemand, M. Kuhlen, and P. Madau, Astrophys. J. 657, 262 (2007).
- Springel et al. (2008) V. Springel, J. Wang, et al., Mon. Not. R. Astron. Soc. 391, 1685 (2008).
- Springel et al. (2008) V. Springel, S. D. M. White, C. S. Frenk, et al., Nature, 456, 73 (2008).
- Yuan et al. (2012) Q. Yuan, Y. Cao, J. Liu, et al., Phys. Rev. D 86, 103531 (2012).
- Kuhlen et al. (2008) M. Kuhlen, J. Diemand, and P. Madau, Astrophys. J. 686, 262 (2008).
- Anderson et al. (2010) B. Anderson, M. Kuhlen, et al., Astrophys. J. 718, 899 (2010).
- Buckley et al. (2010) M. R. Buckley and D. Hooper, Phys. Rev. D 82, 063501 (2010).
- Belikov et al. (2012) A. V. Belikov, M. R. Buckley, and D. Hooper, Phys. Rev. D 86, 043504 (2012).
- Bertoni et al. (2015) B. Bertoni, D. Hooper, and T. Linden, J. Cosmol. Astropart. Phys. 12, 035 (2015).
- Schoonenberg et al. (2016) D. Schoonenberg, J. Gaskins, et al., J. Cosmol. Astropart. Phys. 05, 028 (2016).
- Mirabal et al. (2010) N. Mirabal, D. Nieto, and S. Pardo, arXiv:1007.2644.
- Zechlin et al. (2012a) H.-S. Zechlin, M. V. Fernandes, et al., Astron. Astrophys. 538, A93 (2012).
- Ackermann et al. (2012) M. Ackermann, et al. [Fermi-LAT collaboration], Astrophys. J. 747, 121 (2012).
- Mirabal et al. (2012) N. Mirabal, V. Frias-Martinez, et al., Mon. Not. R. Astron. Soc. 424, L64 (2012).
- Zechlin et al. (2012b) H.-S. Zechlin and D. Horns, J. Cosmol. Astropart. Phys. 11, 050 (2012).
- Berlin et al. (2014) A. Berlin and D. Hooper, Phys. Rev. D 89, 016014 (2014).
- Bertoni et al. (2016) B. Bertoni, D. Hooper, and T. Linden, J. Cosmol. Astropart. Phys. 05, 049 (2016).
- Mirabal et al. (2016) N. Mirabal, E. Charles, et al., Astrophys. J. 825, 69 (2016).
- Hooper & Witte (2016) D. Hooper and S. J. Witte, arXiv: 1610.07587.
- Atwood et al. (2013) W. Atwood, et al. [Fermi-LAT collaboration], arXiv:1303.3514.
- Acero et al. (2015) F. Acero, et al. [Fermi-LAT collaboration], Astrophys. J. Suppl. Ser. 218, 23 (2015).
- Acero et al. (2016) F. Acero, et al. [Fermi-LAT collaboration], Astrophys. J. Suppl. Ser. 223, 26 (2016).
- James (1975) F. James and M. Roos, Comput. Phys. Commun. 10, 343 (1975).
- Mattox et al. (1996) J. R. Mattox, D. L. Bertsch, et al., Astrophys. J. 461, 396 (1996).
- Lande et al. (2012) J. Lande, M. Ackermann, et al., Astrophys. J. 756, 5 (2012).
- Chernoff (1954) H. Chernoff, Ann. Math. Stat. 25, 573 (1954).
- Nolan et al. (2012) P. L. Nolan, et al. [Fermi-LAT collaboration], Astrophys. J. Suppl. Ser. 199, 31 (2012).
- Wilks (1938) S. S. Wilks, Ann. Math. Stat. 9, 60 (1938).
- Cirelli et al. (2011) M. Cirelli, G. Corcella, et al., J. Cosmol. Astropart. Phys. 3, 051 (2011).
- Conrad (2015) J. Conrad, Astropart. Phys. 62, 165 (2015).
- Brun et al. (2009) P. Brun, T. Delahaye, et al., Phys. Rev. D 80, 035023 (2009).
- Perez et al. (2007) F. Perez and B. E. Granger, Computing in Science & Engineering 9, 21 (2007).
- van der Walt et al. (2011) S. van der Walt, S. C. Colbert, and G. Varoquaux, Computing in Science & Engineering 13, 22 (2011).
- Hunter (2007) J. D. Hunter, Computing in Science & Engineering 9, 90 (2007).
- Robitaille et al. (2014) T. P. Robitaille, et al., Astron. Astrophys. 558, 33 (2013).
- Peterson (2009) P. Peterson, International Journal of Computational Science and Engineering 4 (4), 296 (2009).