Soliton repetition rate in a silicon-nitride microresonator
Abstract
The repetition rate of a Kerr comb comprising a single soliton in an anomalous dispersion silicon nitride microcavity is measured as a function of pump frequency tuning. The contributions from the Raman soliton self-frequency shift (SSFS) and from thermal effects are evaluated both experimentally and theoretically; the SSFS is found to dominate the changes in repetition rate. The relationship between the changes in repetition rate and pump frequency detuning is found to be independent of the nonlinearity coefficient and dispersion of the cavity. Modeling of the repetition rate change by using the generalized Lugiato-Lefever equation is discussed; the Kerr shock is found to have only a minor effect on repetition rate for cavity solitons with duration down to 50 fs.
Optical frequency combs (OFCs) consist of a series of discrete, evenly spaced spectral lines, whose frequency is =, where is the repetition rate and is the carrier-envelope offset frequency Cundiff and Ye (2003). OFCs have become an indispensable tool in optical metrology, high precision spectroscopy, optical atomic clock etc. For many applications, highly stabilized OFCs are desired. OFCs based on mode-locked lasers have been shown to exhibit frequency uncertainty at the level of 10-19 Ma et al. (2004). Microresonator based Kerr combs Kippenberg et al. (2011) show potential as a compact replacement for mode-locked laser combs, but they generally do not reach similar stability. Since the integer is generally large, the frequency of an individual comb line is extremely sensitive to the fluctuation of . Hence, investigating the repetition rate of Kerr combs is important to the improvement of Kerr combs. Thermal effects and mechanical stretching have been exploited to stabilize the of Kerr combs Del’Haye et al. (2008); Papp et al. (2013); Huang et al. (2015); Del’Haye et al. (2016). Recently, cavity solitons (CSs) have been demonstrated in microresonators Herr et al. (2014); Brasch et al. (2016); Yi et al. (2015); Wang et al. (2016); Joshi et al. (2016). Unlike other coherent operation regimes of Kerr combs that are not soliton-like, CSs exhibit a soliton self-frequency shift (SSFS) induced by stimulated Raman scattering (SRS) Karpov et al. (2016); Yi et al. (2015); Wang et al. (2016); Yang et al. (2016). The center frequency shift arising through SSFS can affect via dispersion. This constitutes a new mechanism, in addition to thermal effects, which contributes to changes in the repetition rate. Therefore, it is important to compare the relative importance of SSFS and thermal contributions to repetition rate changes (denoted ) in the CS regime. In this Letter, we use frequency comb assisted spectroscopy Del’Haye et al. (2009); Xue et al. (2016a) to measure the for a 227 GHz soliton Kerr comb generated from a silicon-nitride (SiN) microresonator. We find that can vary 25 MHz as the pump frequency is tuned, while maintaining the single soliton state. The contributions from SSFS and thermal effects are isolated and compared, and the SSFS is found to dominate.
The Lugiato-Lefever equation (LLE) is now widely used to model Kerr combs Coen et al. (2013). However, it has seen little use for modeling of changes in repetition rate and pulse timing. Whether the LLE is capable of capturing such changes is an interesting question, since pulse propagation is averaged in the derivation of LLE. Changes in pulse timing have been modeled and compared to experiment quite recently in the normal dispersion regime Xue et al. (2016b). Here, we further show LLE is capable of modeling of the changes in we observe in experiments in the CS regime. In further simulations, we show that the Kerr shock has a minor effect on for pulses as short as 50 fs.
The optical path length and the group velocity determine of a pulse train emitted from a cavity. The group velocity in turn depends on the center frequency of the pulses. For mode-locked lasers, the center frequency is constrained by the net gain spectrum; a weak modulation of the pump power can only change the center frequency slightly by several tens GHz Wahlstrand et al. (2007); Bao et al. (2014). Hence, this center frequency shift will not change significantly; a piezoelectric actuator Cundiff and Ye (2003) or intracavity electro-optic modulator Hudson et al. (2005) is usually used to change the optical path length to control . Unlike mode-locked lasers and non-soliton coherent regimes of Kerr combs, the center frequency of CSs is strongly influenced by the interaction with the waveguide via SRS Karpov et al. (2016). Tuning the pump frequency can vary this SSFS over several THz Karpov et al. (2016), making the influence of center frequency shift on more important. Here, we measure the dependence of on the SSFS via tuning of the pump frequency within the single CS regime.
We study a SiN microresonator, with a 100 m ring radius, 8002000 nm waveguide geometry and a loaded Q-factor of 2.4106, with which we are able to generate a Kerr comb comprising single cavity solitons at 227 GHz repetition rate. The device has a drop-port (with power coupling coefficient of 1.610-4). More details about the microresonator and the characterization of the CS can be found in Wang et al. (2016). The drop-port allows convenient measurement of the intracavity power, defined as the total power including the pump line, without the strong, directly transmitted pump that is present at the through-port. Frequency-comb assisted spectroscopy is used to measure the line spacing of the generated comb Del’Haye et al. (2009); Xue et al. (2016a). A cw diode laser is used to sweep across the Kerr comb, generating beat notes that are recorded by an oscilloscope after bandpass filtering. A femtosecond frequency comb is used for calibration of the laser frequency sweep. This method has been shown to have MHz resolution and accuracy similar to that achieved using with the electro-optic modulation–assisted measurement of the line spacing Del’Haye et al. (2009); Xue et al. (2016a).
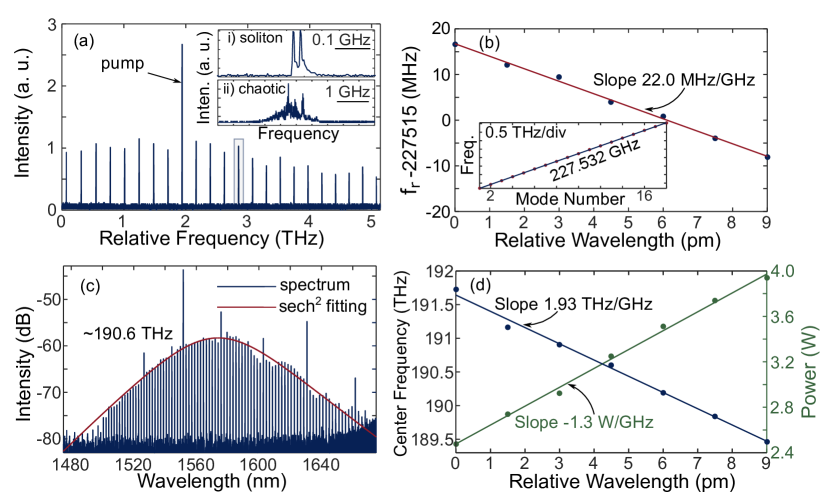
As an example, the relative frequencies for different comb lines are shown in Fig. 1(a). When we zoom into a single line in the CS regime, we can see two narrow peaks, since the cw laser generates a beat note that can pass the bandpass filter both when it is to the red and to the blue of comb line (inset (i) in Fig. 1). In contrast, if the Kerr comb is in the chaotic regime, the beat with the cw laser is broad and structured (inset (ii) in Fig. 1(a)). We can fit the measured relative frequencies of the Kerr comb lines to a line to get (inset of Fig. 1(b)). The power and SSFS of the CS will also change when we tune the pump frequency Herr et al. (2014); Karpov et al. (2016). For our device, the single CS can be maintained over a 1.1 GHz range of pump frequency; changes by 25 MHz in this range, with a slope of 22.0 MHz/GHz (Fig. 1(b)). Note that this slope for a 18 GHz SiN microresonator based Kerr comb was measured to be 57 kHz/GHz for a non-soliton state in Huang et al. (2015).
We also measure the spectrum of the generated CS, which fits well to a sech2 function, except some distortion from the mode-interaction (see Fig. 1(c)). The fit gives the center frequency of the CS. When the pump frequency varies, the center frequency of the CS also changes nearly linearly with the pump frequency Karpov et al. (2016) (Fig. 1(d)), having a slope of 1.93 THz/GHz. Using the drop port, we are also able to measure the average intracavity power; the power decreases nearly linearly with pump frequency, with a slope of 1.3 W/GHz.
The measurement of SSFS and intracavity power allows comparison between the influence of SSFS and thermal effects on . The SSFS contribution to repetition rate change, denoted , can be calculated as
| (1) |
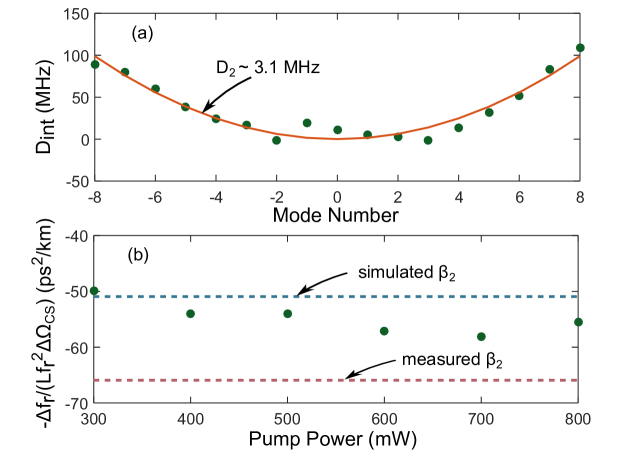
where is the length of the cavity, is the group velocity, is the group velocity dispersion, is the SSFS in angular frequency. The spectral recoil from mode-interaction in a MgF2 cavity affects in a similar way Lucas et al. (2016). From Eq. 1, we can see depends on dispersion of the cavity for a given SSFS. To check this relation, we measure the dispersion using frequency comb assisted spectroscopy Del’Haye et al. (2009). We show the deviation of the resonance from the equidistant spacing, , ( is the resonant frequency of mode , is the free spectral range, is the dispersion coefficient) in Fig. 2(a). From a quadratic fit, is found to be 3.1 MHz, equivalent to 66 ps2/km Yi et al. (2016), close to the simulated dispersion of 51 ps2/km Wang et al. (2016).
If we assume in Fig. 1(b) is driven solely by SSFS, we can extract by using Eq. 1. For an on-chip pump power of 800 mW, we obtain is -55 ps2/km. Furthermore, the obtained value remains nearly the same for CSs generated under different pump powers (see Fig. 2(b)). More importantly, these values are quite close to those obtained via waveguide simulations and via linear spectroscopy measurements. This agreement suggests that the chance in repetition rate is dominated by SSFS.
Furthermore, SSFS (denoted ) can be approximated as Yi et al. (2016),
| (2) |
where , are the resonance frequency of the cavity and frequency of the pump laser, respectively; is the Raman time constant; , , and are the effective group index, speed of light and quality factor respectively; is the pulse-width of the CS. The peak power (P0) of CSs follows the relationship, , ( is the nonlinear coefficient); P0 also scales linearly with pump frequency detuning Bao and Yang (2015),
| (3) |
where is the round-trip time. Combining Eqs. 1, 2, 3 and defining the pump frequency detuning as , we can get,
| (4) |
This relationship means / is immune to the dispersion or nonlinear coefficient of the cavity.
We now assess the contribution of the thermo-optic (TO) effect to the change in repetition rate, which we denote . This contribution can be expressed as
| (5) |
where is the change of the group index due to the TO effect. can be written,
| (6) |
Here d/dT is the derivative of effective group index with respect to temperature. To get a value for d/dT, we perform waveguide simulations to obtain the effective phase index () of the microresonator for different wavelengths and temperatures; the group index is Xue et al. (2016a). Using the same TO coefficient for SiN and SiO2 as Xue et al. (2016a), we find =3.210-5 K-1. =760 J/(kgK) is the heat capacity of SiN, =2.2103 kg/m3 is the density of SiN Ikeda et al. (2008); the time constant () was measured to be 0.25 s in a similar microresonator in our group’s previous work Wang et al. (2014); is the propagation loss coefficient (measured to be ), is the fraction of the absorbed energy that is converted to heat, is the effective mode area (extracted to be 0.67 m2 from the simulation based on the geometry of the ring), is the change of average intracavity power. Note that we neglect thermal expansion in the calculation; however, the SiN ring is embedded in a 4 m thick SiO2 layer and the expansion should be small Xue et al. (2016a). To get the upper bound estimate of , we set . Based on Eqs. 5, 6 the thermal induced is 3.1 MHz for a measured intracavity power change of 1.5 W. Even though overestimates the contribution from the TO effect, the estimated value for is still an order of magnitude smaller than the observed 25 MHz change in comb spacing, suggesting that the contribution from the TO effect is much weaker than that of SSFS.
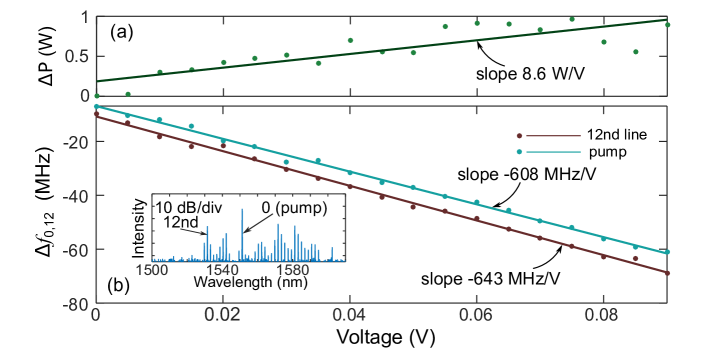
To further isolate the thermal contribution, we conduct another measurement of in the stable modulation instability regime (see the inset of Fig. 3(b) for a typical spectrum), where the Kerr comb does not experience SSFS. The pump line and the 12th line are filtered by a pulse-shaper to beat with the femtosecond comb, thus measuring 12. We record both the change of the frequencies of these two Kerr comb lines and the average comb power with respect to the voltage used to control the piezo of the external cavity diode pump laser in Fig. 3. Both the frequencies and the comb power are found to change nearly linearly. From the linear fits we find that the coefficient of repetition rate change with intracavity power is 0.3 MHz/W. Hence, for the measured 1.5 W change in intracavity power in Fig. 1(d), the contribution to is only 0.45 MHz, much smaller than the change in repetition rate observed.
Since is dominated by SSFS, which can be modeled by the generalized LLE Karpov et al. (2016); Yi et al. (2015, 2016), we perform simulations using the generalized LLE to look into the pulse timing dynamics. We write the generalized LLE Coen et al. (2013); Karpov et al. (2016); Bao et al. (2015a) as:
| (7) | ||||
where is the round-trip time, is the nonlinear response, including both the electronic and the delayed Raman response (), is the Raman fraction (chosen as 0.13), and are the intrinsic loss and the external coupling coefficient respectively and is the pump field at the frequency .
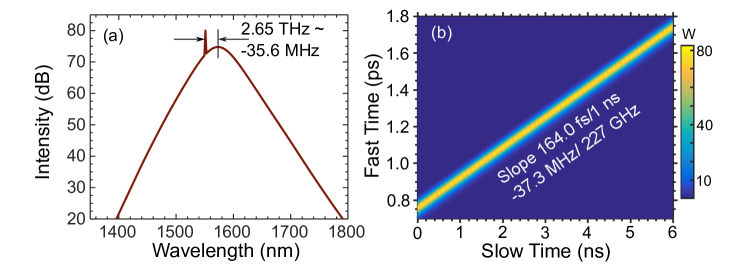
Here, we show simulation results for a typical CS generated at 305 mW pump power and detuning =0.0303 in a SiN microresonator with =0.9 (W m)-1, ps2/km, =0.002 and =0.0004. The spectrum of the CS is shown in Fig. 4(a), corresponding to a pulse-width =50 fs. The shift between the center frequency of the spectrum and the pump frequency, or SSFS, is 2.65 THz. According to Eq. 1, this leads to a change of repetition rate of 35.6 MHz for =227 GHz. To compare this value with the pulse timing dynamics in the LLE simulation, we show the temporal-spatial dynamics of the simulated CS in Fig. 4(b). Due to SSFS, the peak of the CS envelope experiences additional delay with a slope of 164.0 fs/ns; without SSFS the plot would appear as a horizontal line. From the relationship , this slope is equivalent to =37.2 MHz, in close agreement with the SSFS predicted 35.6 MHz. This supports the notion that pulse timing information is retained in the LLE, despite the inherent averaging in the derivation.
The slight difference in the two values of can be attributed to the inclusion of Kerr shock (KS) in the simulation, which affects the group velocity of the CS Haus and Ippen (2001); Wahlstrand et al. (2007); Bao et al. (2014); Bao and Yang (2015). The difference in the simulated and the SSFS predicted is equivalent to a change of round-trip time of =7.2 fs/ns. Since the change of group velocity () for sech-soliton induced by KS is Haus and Ippen (2001), the variation of the round-trip time induced by KS yields,
| (8) |
Based on Eq. 8, induced by KS is 8.8 fs/ns, which is close to the simulated 7.2 fs/ns. The residual discrepancy may result from the deviation of the simulated CS from the sech-pulse. Furthermore, when excluding KS in the simulation, the SSFS increases slightly to THz. The round-trip time change predicted from this SSFS is =161.6 fs/ns based on Eq. 1. On the other hand, if we extract the timing of the CS envelope peak from the simulation without KS, we find a slope of 161.7 fs/ns, in excellent agreement with the SSFS prediction. Hence, the generalized LLE can be used to model pulse timing and changes in repetition rate induced both by SSFS and by KS.
Since the pulse dynamics in nonlinear resonators strongly affect the comb performance Wahlstrand et al. (2007); Bao et al. (2014, 2015b), an accurate theoretical model to investigate the intracavity pulse dynamics is important to the optimization of frequency combs. For mode-locked lasers, the complex Ginzburg-Landau equation is usually used to model the pulse dynamics Haus (1975). However, effects such as gain relaxation, spectral filtering and the resulting mode-locking state etc. are usually hard to model accurately. Hence, investigation of pulse dynamics in mode-locked laser usually centers on experiment. For CSs in passive microresonators, the absence of active gain and nonlinear absorption makes it feasible to model the pulse timing dynamics accurately. If noise sources are added to the model correctly, we can expect a full characterization of the pulse dynamics.
In summary, the SSFS induces a considerable change in the repetition rate of Kerr combs operating in the single cavity soliton regime. Both experimental and modeling results suggest that the SSFS can lead to changes in repetition rate much larger than caused by the thermo-optic effect. Although the SSFS does make the repetition rate of CS combs more sensitive to changes in pump frequency than other, non-soliton coherent Kerr comb states, it may also provide a useful degree of freedom to broaden the locking range over which the repetition rate may be stabilized. Ultimately, understanding the pulse dynamics and noise behavior of soliton Kerr combs based on the LLE can be valuable for the improvement of Kerr comb stability.
Acknowledgment
Air Force Office of Scientific Research (AFOSR) (FA9550-15-1-0211), DARPA PULSE program (W31P40-13-1-0018) from AMRDEC, and National Science Foundation (NSF) (ECCS-1509578).
References
- Cundiff and Ye (2003) S. T. Cundiff and J. Ye, Rev. Mod. Phys. 75, 325 (2003).
- Ma et al. (2004) L.-S. Ma, Z. Bi, A. Bartels, L. Robertsson, M. Zucco, R. S. Windeler, G. Wilpers, C. Oates, L. Hollberg, and S. A. Diddams, Science 303, 1843 (2004).
- Kippenberg et al. (2011) T. J. Kippenberg, R. Holzwarth, and S. Diddams, Science 332, 555 (2011).
- Del’Haye et al. (2008) P. Del’Haye, O. Arcizet, A. Schliesser, R. Holzwarth, and T. J. Kippenberg, Phys. Rev. Lett. 101, 053903 (2008).
- Papp et al. (2013) S. B. Papp, P. Del’Haye, and S. A. Diddams, Phys. Rev. X 3, 031003 (2013).
- Huang et al. (2015) S.-W. Huang, J. Yang, J. Lim, H. Zhou, M. Yu, D.-L. Kwong, and C. Wong, Scientific Reports 5, 13355 (2015).
- Del’Haye et al. (2016) P. Del’Haye, A. Coillet, T. Fortier, K. Beha, D. C. Cole, K. Y. Yang, H. Lee, K. J. Vahala, S. B. Papp, and S. A. Diddams, Nat. Photonics 10, 516 (2016).
- Herr et al. (2014) T. Herr, V. Brasch, J. Jost, C. Wang, N. Kondratiev, M. Gorodetsky, and T. Kippenberg, Nat. Photonics 8, 145 (2014).
- Brasch et al. (2016) V. Brasch, M. Geiselmann, T. Herr, G. Lihachev, M. Pfeiffer, M. Gorodetsky, and T. Kippenberg, Science 351, 357 (2016).
- Yi et al. (2015) X. Yi, Q.-F. Yang, K. Y. Yang, M.-G. Suh, and K. Vahala, Optica 2, 1078 (2015).
- Wang et al. (2016) P.-H. Wang, J. A. Jaramillo-Villegas, Y. Xuan, X. Xue, C. Bao, D. E. Leaird, M. Qi, and A. M. Weiner, Opt. Express 24, 10890 (2016).
- Joshi et al. (2016) C. Joshi, J. K. Jang, K. Luke, X. Ji, S. A. Miller, A. Klenner, Y. Okawachi, M. Lipson, and A. L. Gaeta, Opt. Lett. 41, 2565 (2016).
- Karpov et al. (2016) M. Karpov, H. Guo, A. Kordts, V. Brasch, M. H. Pfeiffer, M. Zervas, M. Geiselmann, and T. J. Kippenberg, Phys. Rev. Lett. 116, 103902 (2016).
- Yang et al. (2016) Q.-F. Yang, X. Yi, K. Y. Yang, and K. Vahala, Optica 3, 1132 (2016).
- Del’Haye et al. (2009) P. Del’Haye, O. Arcizet, M. L. Gorodetsky, R. Holzwarth, and T. J. Kippenberg, Nat. Photonics 3, 529 (2009).
- Xue et al. (2016a) X. Xue, Y. Xuan, C. Wang, P.-H. Wang, Y. Liu, B. Niu, D. E. Leaird, M. Qi, and A. M. Weiner, Opt. Express 24, 687 (2016a).
- Coen et al. (2013) S. Coen, H. G. Randle, T. Sylvestre, and M. Erkintalo, Opt. Lett. 38, 37 (2013).
- Xue et al. (2016b) X. Xue, F. Leo, Y. Xuan, J. A. Jaramillo-Villegas, P.-H. Wang, D. E. Leaird, M. Erkintalo, M. Qi, and A. M. Weiner, arXiv:1607.02711 (2016b).
- Wahlstrand et al. (2007) J. Wahlstrand, J. Willits, T. Schibli, C. Menyuk, and S. Cundiff, Opt. Lett. 32, 3426 (2007).
- Bao et al. (2014) C. Bao, A. C. Funk, C. Yang, and S. T. Cundiff, Opt. Lett. 39, 3266 (2014).
- Hudson et al. (2005) D. D. Hudson, K. W. Holman, R. J. Jones, S. T. Cundiff, J. Ye, and D. J. Jones, Opt. Lett. 30, 2948 (2005).
- Lucas et al. (2016) E. Lucas, J. D. Jost, and T. J. Kippenberg, arXiv:1609.02723 (2016).
- Yi et al. (2016) X. Yi, Q.-F. Yang, K. Y. Yang, and K. Vahala, Opt. Lett. 41, 3419 (2016).
- Bao and Yang (2015) C. Bao and C. Yang, Phys. Rev. A 92, 053831 (2015).
- Ikeda et al. (2008) K. Ikeda, R. E. Saperstein, N. Alic, and Y. Fainman, Opt. Express 16, 12987 (2008).
- Wang et al. (2014) J. Wang, Y. Xuan, A. M. Weiner, and M. Qi, in CLEO (Optical Society of America, 2014) pp. STh1M–8.
- Bao et al. (2015a) C. Bao, L. Zhang, L. C. Kimerling, J. Michel, and C. Yang, Opt. Express 23, 18665 (2015a).
- Haus and Ippen (2001) H. Haus and E. Ippen, Opt. Lett. 26, 1654 (2001).
- Bao et al. (2015b) C. Bao, W. Chang, C. Yang, N. Akhmediev, and S. T. Cundiff, Phys. Rev. Lett. 115, 253903 (2015b).
- Haus (1975) H. Haus, IEEE Journal of Quantum Electronics 11, 736 (1975).