Currently at ]Escuela de Química, Universidad Industrial de Santander. Bucaramanga, Santander 680002, Colombia
Entangled two photon absorption cross section on the 808 nm region for the common dyes Zinc tetraphenylporphyrin and Rhodamine B
Abstract
We report the measurement of the entangled two photon absorption cross section, , at nm on organic chromophores in solution in a low photon flux regime. We performed measurements on Zinc tetraphenylporphyrin (ZnTPP) in Toluene and Rhodamine B (RhB) in Methanol. This is, to the best of our knowledge, the first time that is measured for RhB. Additionally, we report a systematic study of the dependence of on the molecular concentration for both molecular systems. In contrast to previous experiments, our measurements are based on detecting the pairs of photons that are transmitted by the molecular system. By using a coincidence count circuit it was possible to improve the signal to noise ratio. This type of work is important for the development of spectroscopic and microscopic techniques using entangled photons.
pacs:
42.50.Hz, 79.20.Ws, 83.85.EiI INTRODUCTION
Two photon absorption (TPA) is a non-linear process in which, by absorbing two photons, an specific electronic excited state of a system can be accessed Rumi and Perry (2010). In this process, energy conservation is satisfied given that the sum of the energy of the individual photons should be equal to the energy of the transition that is addresed. The TPA phenomena was theoretically proposed by Maria Goeppert Mayer on 1931 Goeppert-Mayer (1931) and it was experimentally demonstrated after the invention of the laser Kaiser and Garrett (1961). TPA has been studied using high intensity pulsed lasers on the femtosecond Xu and Webb (1996); Upton et al. (2013); Harpham et al. (2009) and picosecond Oulianov et al. (2001) regime and it has been extensively used for spectroscopic and microscopic techniques So et al. (2000) as well as in photoinduced phenomena on a wide variety of materials.Finikova et al. (2007); Chung et al. (2001)
In recent years, an interest to study TPA induced by sources with different statistical properties than lasers, such as thermal, Jechow et al. (2013) squeezed Georgiades et al. (1995) and entangled light,Lee and Goodson (2006); Harpham et al. (2009); Upton et al. (2013); Dayan et al. (2004) has appeared. Particularly, entangled light has been experimentally tested as a convenient source to induce two-photon transitions on molecules due to its non-classical properties. One of the motivations for this type of work is the possibility to induce TPA with a low photon flux. This capability may have important implications reducing photodestruction probability and photo-bleaching of the sample, allowing to develop less invasive methods to study TPA in biological samples.Hoover and Squier (2013); Kim and Cho (2015) Entangled light has also been used to induce TPA in semiconductors to study temporal correlations of twin beams Boitier et al. (2011). From a theoretical perspective, TPA induced by entangled light with different type of frequency correlations has been studied as a tool to learn about the spectral properties of a sample. Salazar et al. (2012); Saleh et al. (1998); Svozilík, Peřina Jr, and León-Montiel (2016)
In this paper, we study TPA induced in molecules by entangled light, generated by the process of Spontaneous Parametric Down Conversion (SPDC)Shih (2003) pumped by a cw laser, at a low photon flux. The probability of entangled TPA in a sample is quantified by means of the entangled TPA cross section, . We infer the value of for the commercially available compounds Zinc tetraphenylporphyrin (ZnTPP) and Rhodamine B (RhB) by measuring the absorption signal. Measurements of for ZnTTP have been previously reported Upton et al. (2013); however, this is, to the best of our knowledge, the first time that is measured for RhB. Additionally, we report, for these two molecules, a systematic study of the dependence of on the molecular concentration. In contrast to previous experiments, Upton et al. (2013); Lee and Goodson (2006); Harpham et al. (2009) our measurements are based on detecting, by means of a coincidence count circuit, the pairs of photons that are transmitted by the molecular system, improving the signal to noise ratio.
II THEORY
In this section, we present a theoretical model to obtain from experiments based on coincidence counts. In general, TPA can be induced by using entangled light and random light sources such as lasers. Considering a molecular system, the TPA rate per molecule, , can be written as:Fei et al. (1997); Lissandrin et al. (2004); Javanainen and Gould (1990)
| (1) |
where is the incident photon flux density (photons s) impinging on the molecule and is the random TPA cross section. The quadratic term in Eq. (1) represents the contribution of random sources to . Typicaly, is on the order of GM (1 GMcm4 s photon-1 molecule-1) and therefore, a high photon flux density ( photons s-1cm-2) is required to induce TPA. The term in Eq. (1) represents the contribution of entangled light to . A significant difference between random and entangled TPA rates is clearly seen by the dependence of on the incident photon flux. The linear dependence with for entangled light and the fact that can be on the order of cm2 molecule-1, allows to observe TPA with a photon flux density on the order of photons s-1 cm-2 as reported in Ref. [Harpham et al., 2009]. This values for photon flux density are significantly lower than the one for random sources.
Let us consider the case where TPA in a molecule is induce by a source of entangled light with a rate . In this case, the quadratic dependence on the photon flux in Eq. (1) can be neglected and . Considering a source of entangled light that produces pairs of photons, , with denoting the incident entangled photon pair flux density impinging on the molecule. In this case,
| (2) |
From the experimental point of view, the quantity can be estimated by measuring the rate of photon pairs absorbed by a molecular system, . For a sample containing molecules on a volume ,
| (3) |
Comparing the theoretical expression for , Eq. (2), with the experimental version in Eq. (3), and taking into account that , with the concentration of molecules in the sample and Avogadro’s number,
| (4) |
In particular, in a configuration where the detection system is based on measuring the coincidence rate of photon pairs, the incident entangled photon pair flux density becomes , where is the detected rate of photon pairs produced by the light source that interacts with the molecules in an area . Under these considerations,
| (5) |
For molecules studied in liquid solution, it is important to account for the signal scattered by the solvent. In order to do this, it is necessary to measure the rate of photon pairs transmitted through the solvent, , that becomes the incident entangled photon pair flux impinging on the molecules (); therefore, Eq. (5) becomes
| (6) |
Equation (6) allows to estimate for a molecule from variables that can be experimentally controlled. By measuring as a function of and performing a linear fit, it is possible to estimate for a given molecule at a particular concentration. The experimental procedure to infer will be described in detail in the following sections.
III EXPERIMENT
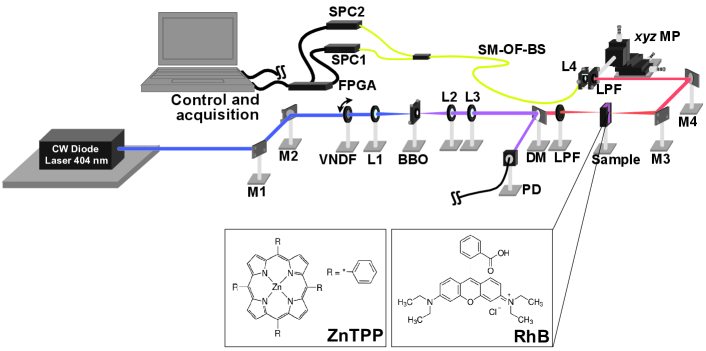
In this section, we describe the experiment to obtain for two different molecular systems. The experimental setup is shown in Fig. 1. Entangled photon pairs are produced by SPDC, send into a sample that can be ZnTPP or RhB, and finally detected by single photon counters that are connected to a FPGA (Field Programmable Gate Array) to measure single and coincidence count rates. In the following, a detailed description of the entangled light source and the molecular systems will be presented.
III.1 Entangled light source
The entangled light to induce TPA in molecules was generated by the process of SPDC on a non-linear crystal. Roughly speaking, SPDC is a process in which a photon from a pump beam with a wavelength impinges on a non-linear crystal and occasionally, pairs of photons, known as signal and idler, are produced with wavelengths and , respectively. In our setup, Fig. 1, a cw laser at 404 nm pumps a 1 mm BBO (-Barium Borate) type I crystal to produce SPDC photons on a degenerate and collinear configuration center at nm. The pump is focused into the crystal by L1 ( mm). The pump power is monitored by a photodiode (PD) and it is tuned from 1 mW to 20 mW by means of a motorized variable neutral density filter (VNDF) Thorlabs NDC-50C-4M. After the BBO, the SPDC light is collected by L2 ( mm) and then focused by L3 ( mm) to produce a beam waist m on the position of the sample. Following L3, a dichroic mirror (DM) and a long pass filter (LPF), with cutoff wavelength at 750 nm, are used to remove the residual pump beam. After passing through the sample, the SPDC photons are coupled by using L4 ( mm) into a single mode optical fiber-beamsplitter (SM-OF-BS) from OZ-optics. L4 is mounted on a three axis micrometric positioner ( MP) that has an extra LPF to reduce the detection of the residual pump beam. The photons from the SM-OF-BS outputs are detected by SPC1 and SPC2, single-photon counters (Perkin-Elmer, SPCM-AQR-13). The output from the detectors is electronically analyzed by the FPGA to obtain the rate of single and coincidence counts in a 9 ns time window. The single photon count rate from our source at the maximum pump power is on the order of photons s-1, leading to a entangled photon flux density on the order of photons cm-2 s-1.
III.2 Molecular systems
The measurement of was performed on the commercially available compounds Zinc tetraphenylporphyrin (ZnTPP) and Rhodamine B (RhB). ZnTPP was obtained from meso-Tetraphenylporphhyrin (95 % purity, Sigma-Aldrich) by the method reported on Ref. [Adler et al., 2007] and solved on high performance liquid chromatography (HPLC) grade Toluene. RhB (95 % purity, Sigma-Aldrich) was used as received and solved on HPLC grade Methanol. The sample was placed in our setup as indicated in Fig. 1 using a quartz cuvette of 10 mm pathlength. Taking into account that the waist of the SPDC photons in the sample leads to a Rayleigh range of mm, the interaction volume can be considered as a cylinder with transverse area and volume on the order of cm2 and cm3, respectively. We prepared different concentrations for the molecules in the corresponding solvent. The concentration values were obtained by measuring the absorption spectra using a Specord 50 Plus spectrophotometer (Analytik Jena) and the reported values for the extinction coefficients.Barnett, Hudson, and Smith (1975); Nag and Goswami (2009)
In previous reports, the value of and have been determined for ZnTPP.Upton et al. (2013) In these measurements entangled light was produced by SPDC generated by a pulsed laser and, before interacting with the sample, it was filtered using a 20 nm bandpass filter around 800 nm. The detection system in their case was based only on single counts. On the other hand, values of for RhB have been reported for wavelengths around 800 nm;Makarov, Drobizhev, and Rebane (2008); Nag and Goswami (2009) however, the value of has never been reported. In our experimental setup, the molecular system was illuminated with the whole spectrum of the SPDC photons centered at 808 nm with a bandwidth of 130 nm full width half maximum since we did not use band pass filters.
Besides their importance for spectroscopic and microscopic techniques, the selected molecules for this study have shown relevance for different applications such as optical sensors.Harpham et al. (2009) This versatility is based on their photophysics, characterized by high fluorescence quantum yields and long lifetimes for the first electronic excited state.Yu et al. (2002); Lukaszewicz et al. (2007); Nag and Goswami (2009); Kristoffersen et al. (2014)
IV RESULTS AND DISCUSSION
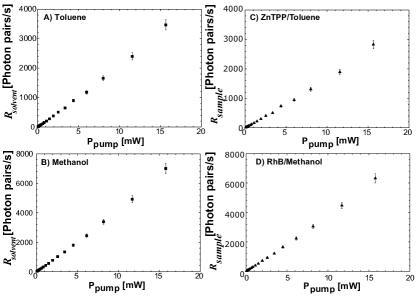
In order to get a value of , it is necessary to measure the rate of photon pairs absorbed by a molecular system, , as a function of , as stated in Eq. (6). For molecules in a solvent, , where is the detected rate of photon pairs that passes through the sample, i.e., through solvent plus molecular system. For a fixed concentration, volume and area, it is possible to measure and as a function of the power of the pump beam, , that generates the entangled photon pairs. These results are presented in Fig. 2A and Fig. 2B for Toluene and Methanol and in Fig. 2C and Fig. 2D for ZnTPP and RhB for a given concentration in their corresponding solvents. Each point on Fig. 2 corresponds to an average of 60 measurements of one second each. Error bars represent the standard deviation for each measurement. A linear dependence is observed in these graphs. In particular, Fig. 2A and Fig. 2B allow to find the correspondence between and .
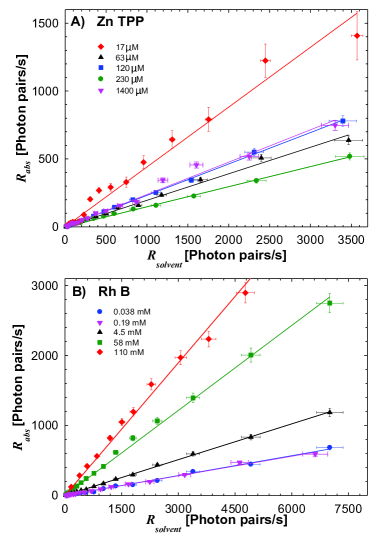
For a particular sample, as a function of is obtained by using the correspondence between and and subtracting from . Fig. 3 shows the curves as a function of for different concentrations of the studied molecules. Concentration values for both ZnTPP and RhB samples were chosen to have a signal bigger than 10% of . Fig. 3A depicts the results for ZnTPP and Fig. 3B for RhB. The data reported corresponds only to a TPA signal. For the low concentrations in the samples, scattering effects are mainly due to the solvent. By subtracting from , the effects of the scattering are removed. Absorption signals on the order of photon pairs s-1 can be observed for different concentrations at different values of . At low values of (50 photon pairs s-1), the measured values for are less than 20 photon pairs s-1, indicating a good signal to noise ratio.
The solid lines in Fig. 3 correspond to linear fits to the data. The fits were force to pass through the origin since the background noise was minimized due to the characteristics of the entangled light source and the coincidence detection system. According to Eq. (6), the slope of the fit is related to the product . Therefore, there are different values of and that can turn into the same slope. This is the case for the concentrations M and M of ZnTPP in Fig. 3A and for the concentrations of mM and mM of RhB in Fig. 3B.
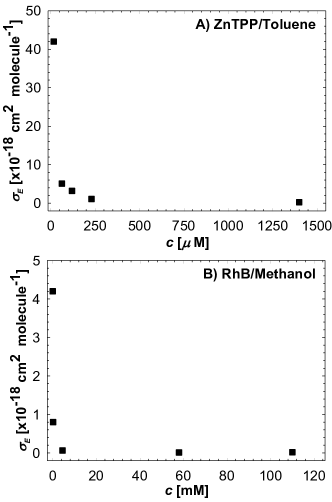
The results of for different concentrations are summarized in Table 1 and plotted in Fig. 4A for ZnTPP and in Fig. 4B for RhB. A strong decay is observed for when the concentration increases in Fig. 4. This behavior can be understood by an analogy with previous reports on the dependence of and with the concentration. Ajami et al. (2015); Harpham et al. (2009) The decreasing of for high concentrations can be interpreted by considering aggregation of the molecules that lead to screening effects.
| ZnTPP | |
|---|---|
| () | (cm2 molecule-1) |
| RhB | |
| (mM) | (cm2 molecule-1) |
V CONCLUSIONS
We reported on the measurement of the entangled two photon absorption cross section, , for ZnTPP and RhB. The value of for ZnTPP agrees with previously reported results. For RhB, this is the first time that a measurement for has been performed. Additionally, we showed that sample concentration has important effects on . The data we reported was taken in an experimental setup with two main features that are different from previous setups to measure . First, our entangled light source was based on SPDC pumped by a cw laser instead of a pulsed laser. Second, the detection system we used was based on counting the rate of photon pairs absorbed by the molecules instead of the number of single photons absorbed. This last feature, allowed us to show that regardless the low photon flux density of entangled photons ( photons cm-2 s-1), the TPA processes can be induced and the number of absorbed photon pairs can be measured. The obtained experimental results provide support for the implementation of spectroscopic and microscopic techniques based on the process of entangled two-photon absorption on molecules. Additionally, this type of work is beneficial for studying biological samples and the implementation of detection systems operating at low photon fluxes.
ACKNOWLEDGMENTS
This work was financially supported by Facultad de Ciencias, Universidad de los Andes, Bogotá, Colombia. The authors thank Dr. Yenny Hernández at Universidad de los Andes for fruitful discussions and Dr. Gilma Granados at Universidad Nacional de Colombia for the synthesis and purification of Zinc tetraphenylporphyrin.
References
- Rumi and Perry (2010) M. Rumi and J. W. Perry, Adv. Opt. Photon. 2, 451 (2010).
- Goeppert-Mayer (1931) M. Goeppert-Mayer, Ann. Phys. 401, 273 (1931).
- Kaiser and Garrett (1961) W. Kaiser and C. G. B. Garrett, Phys. Rev. Lett. 7, 229 (1961).
- Xu and Webb (1996) C. Xu and W. W. Webb, J. Opt. Soc. Am. B 13, 481 (1996).
- Upton et al. (2013) L. Upton, M. Harpham, O. Suzer, M. Richter, S. Mukamel, and I. T. Goodson, J. Phys. Chem. Lett. 4, 2046 (2013).
- Harpham et al. (2009) M. R. Harpham, O. Süzer, C.-Q. Ma, P. Bäuerle, and T. Goodson, J. Am. Chem. Soc. 131, 973 (2009).
- Oulianov et al. (2001) D. Oulianov, I. Tomov, A. Dvornikov, and P. Rentzepis, Opt. Comm. 191, 235 (2001).
- So et al. (2000) P. T. C. So, C. Y. Dong, B. R. Masters, and K. M. Berland, Ann. Rev. Biomed. Eng. 2, 399 (2000).
- Finikova et al. (2007) O. S. Finikova, T. Troxler, A. Senes, W. F. DeGrado, R. M. Hochstrasser, and S. A. Vinogradov, J. Phys. Chem. A 111, 6977 (2007).
- Chung et al. (2001) S.-J. Chung, T.-C. Lin, K.-S. Kim, G. S. He, J. Swiatkiewicz, P. N. Prasad, G. A. Baker, and F. V. Bright, Chem. Mat. 13, 4071 (2001).
- Jechow et al. (2013) A. Jechow, M. Seefeldt, H. Kurzke, A. Heuer, and R. Menzel, Nat. Photon. 7, 973 (2013).
- Georgiades et al. (1995) N. P. Georgiades, E. S. Polzik, K. Edamatsu, H. J. Kimble, and A. S. Parkins, Phys. Rev. Lett. 75, 3426 (1995).
- Lee and Goodson (2006) D.-I. Lee and T. Goodson, J. Phys. Chem. B 110, 25582 (2006).
- Dayan et al. (2004) B. Dayan, A. Pe’er, A. A. Friesem, and Y. Silberberg, Phys. Rev. Lett. 93, 023005 (2004).
- Hoover and Squier (2013) E. E. Hoover and J. A. Squier, Nature Photon. 7, 93 (2013).
- Kim and Cho (2015) H. M. Kim and B. R. Cho, Chemical Reviews 115, 5014 (2015).
- Boitier et al. (2011) F. Boitier, A. Godard, N. Dubreuil, P. Delaye, C. Fabre, and E. Rosencher, Nature Comm. 2, 425 (2011).
- Salazar et al. (2012) L. J. Salazar, D. A. Guzmán, F. J. Rodríguez, and L. Quiroga, Opt. Express 20, 4470 (2012).
- Saleh et al. (1998) B. E. Saleh, B. M. Jost, H.-B. Fei, and M. C. Teich, Phys. Rev. Lett. 80, 3483 (1998).
- Svozilík, Peřina Jr, and León-Montiel (2016) J. Svozilík, J. Peřina Jr, and R. d. J. León-Montiel, preprint arXiv:1608.07326 (2016).
- Shih (2003) Y. Shih, Rep. Prog. Phys. 66, 1009 (2003).
- Fei et al. (1997) H.-B. Fei, B. M. Jost, S. Popescu, B. E. A. Saleh, and M. C. Teich, Phys. Rev. Lett. 78, 1679 (1997).
- Lissandrin et al. (2004) F. Lissandrin, B. E. A. Saleh, A. V. Sergienko, and M. C. Teich, Phys. Rev. B 69, 165317 (2004).
- Javanainen and Gould (1990) J. Javanainen and P. L. Gould, Phys. Rev. A 41, 5088 (1990).
- Adler et al. (2007) A. D. Adler, F. R. Longo, V. Váradi, and R. G. Little, “Metalloporphyrins,” in Inorganic Syntheses (John Wiley Sons, Inc., 2007) pp. 213–220.
- Barnett, Hudson, and Smith (1975) G. H. Barnett, M. F. Hudson, and K. M. Smith, J. Chem. Soc., Perkin Trans. 1 , 1401 (1975).
- Nag and Goswami (2009) A. Nag and D. Goswami, J. Photochem. Photobiol. A 206, 188 (2009).
- Makarov, Drobizhev, and Rebane (2008) N. S. Makarov, M. Drobizhev, and A. Rebane, Opt. Express 16, 4029 (2008).
- Yu et al. (2002) H.-Z. Yu, J. S. Baskin, , and A. H. Zewail, J. Phys. Chem. A 106, 9845 (2002).
- Lukaszewicz et al. (2007) A. Lukaszewicz, J. Karolczak, D. Kowalska, A. Maciejewski, M. Ziolek, and R. P. Steer, Chem. Phys. 331, 359 (2007).
- Kristoffersen et al. (2014) A. S. Kristoffersen, S. R. Erga, B. Hamre, and O. Frette, J. Fluoresc. 24, 1015 (2014).
- Ajami et al. (2015) A. Ajami, P. Gruber, M. Tromayer, W. Husinsky, J. Stampfl, R. Liska, and A. Ovsianikov, Opt. Mat. 47, 524 (2015).