Farthest Neighbor: The Distant Milky Way Satellite Eridanus II**affiliation: This paper includes data gathered with the 6.5 meter Magellan Telescopes located at Las Campanas Observatory, Chile.
Abstract
We present Magellan/IMACS spectroscopy of the recently-discovered Milky Way satellite Eridanus II (Eri II). We identify 28 member stars in Eri II, from which we measure a systemic radial velocity of and a velocity dispersion of . Assuming that Eri II is a dispersion-supported system in dynamical equilibrium, we derive a mass within the half-light radius of , indicating a mass-to-light ratio of / and confirming that it is a dark matter-dominated dwarf galaxy. From the equivalent width measurements of the CaT lines of 16 red giant member stars, we derive a mean metallicity of and a metallicity dispersion of . The velocity of Eri II in the Galactic Standard of Rest frame is , indicating that either Eri II is falling into the Milky Way potential for the first time or it has passed the apocenter of its orbit on a subsequent passage. At a Galactocentric distance of 370 kpc, Eri II is one of the Milky Way’s most distant satellites known. Additionally, we show that the bright blue stars previously suggested to be a young stellar population are not associated with Eri II. The lack of gas and recent star formation in Eri II is surprising given its mass and distance from the Milky Way, and may place constraints on models of quenching in dwarf galaxies and on the distribution of hot gas in the Milky Way halo. Furthermore, the large velocity dispersion of Eri II can be combined with the existence of a central star cluster to constrain MACHO dark matter with mass 10 .
Subject headings:
dark matter; galaxies: dwarf; galaxies: individual (Eridanus II); galaxies: stellar content; Local Group; stars: abundances1. INTRODUCTION
Over the past two years, more than 20 ultra-faint dwarf galaxy candidates have been discovered in data from the Dark Energy Survey (DES; Bechtol et al., 2015; Koposov et al., 2015; Drlica-Wagner et al., 2015a; Kim & Jerjen, 2015) and other large optical surveys (Martin et al., 2015; Laevens et al., 2015a, b; Kim et al., 2015a, b; Torrealba et al., 2016a, b; Homma et al., 2016; Drlica-Wagner et al., 2016). One of the largest, most luminous, and most distant newly discovered satellites is Eridanus II (Eri II), which has an absolute magnitude of , a half-light radius of pc, and a Galactocentric distance of kpc (Bechtol et al., 2015; Koposov et al., 2015; Crnojević et al., 2016).
Eri II is likely located just beyond the virial radius of the Milky Way, which is typically estimated to be 300 (Taylor et al., 2016; Bland-Hawthorn & Gerhard, 2016). This places Eri II in a sharp transition region between the gas-free dwarf spheroidals (with kpc) and the more distant gas-rich star-forming dwarfs (Einasto et al., 1974; Blitz & Robishaw, 2000; Grcevich & Putman, 2009; Spekkens et al., 2014). Koposov et al. (2015) suggested that Eri II may contain a young stellar population component (250 Myr) due to the spatial coincidence of a few candidate blue loop stars, and therefore Eri II would be similar to the gas-rich dwarf Leo T, which is slightly more distant and more luminous ( kpc, ; Irwin et al., 2007; de Jong et al., 2008; Ryan-Weber et al., 2008) and has undergone multiple epochs of star formation (de Jong et al., 2008; Weisz et al., 2012). If this were the case, Eri II would be the least luminous star-forming galaxy known. However, Westmeier et al. (2015) measured the H I gas content using HIPASS data (Barnes et al., 2001), and did not detect any H I gas associated with Eri II. Crnojević et al. (2016) also obtained the H I observations from the Green Bank Telescope, and found a more stringent upper limit on the H I mass (), indicating that Eri II is an extremely gas-poor system. With deep imaging from Magellan/Megacam, Crnojević et al. (2016) found a possible intermediate-age (3 Gyr) population in Eri II. Moreover, they confirmed that there is a star cluster whose projected position is very close to the center of Eri II, making it the least luminous galaxy known to host a (possibly central) star cluster.
The features described above make Eri II one of the most interesting of the newly discovered Milky Way satellites for spectroscopic study. In this paper we present the first spectroscopic observations of Eri II, from which we determine its dark matter content and test for the existence of a young stellar population. In §2 we describe the observations, target selection, and data reduction. In §3 we perform velocity and metallicity measurements on the observed stars in Eri II and identify spectroscopic members. We then compute the global properties of Eri II and discuss its nature and origin in §4, and conclude in §5.
2. OBSERVATIONS AND DATA REDUCTION
2.1. Observations and Target Selection
We observed Eri II with the IMACS spectrograph (Dressler et al., 2006) on the Magellan Baade telescope on the nights of 2015 October 16-17 and 2015 November 18–19. The observing conditions on both runs were clear, with seeing that varied from 06 to 09. The observing procedure and instrument setup are similar to the observation of the Tucana III (Tuc III) dwarf galaxy described by Simon et al. (2016). For both runs we used the f/4 camera on IMACS, which has an mosaic provided by a array of pixel e2v CCDs. The spectrograph was configured with the 1200 /mm grating blazed at 32.7°. This setup produces a spectral dispersion of 0.19 Å pix-1, a peak throughput above 14% for Å, and a spectral resolution of for a 07 slit width. We used a tilt angle of 32.4° to provide a minimum wavelength range of Å for each slit, with typical wavelength coverage of Å. The WB5600-9200 filter was used to block shorter wavelength light. This wavelength range covers the Ca triplet (CaT) absorption lines around 8500 Å used for measuring radial velocities and metallicities of candidate member stars, as well as the telluric absorption lines (Fraunhofer A-band) around 7600 Å used for the corrections of velocity errors caused by mis-centering of the stars within the slits (see §3.1 and Sohn et al. 2007 for details). While the f/4 camera on IMACS provides a full field-of-view of for multi-slit spectroscopy, we limited the placement of slits to a portion to ensure that all the spectra span the required wavelength range for accurate velocity measurements.
We observed the candidate member stars in Eri II with one slitmask. The spectroscopic targets were selected using photometry from the coadded images of the first internal annual release of DES data (Y1A1; Bechtol et al., 2015). Since Eri II is a distant Milky Way satellite, most of the candidate stars brighter than are near the tip of the red giant branch (RGB). We chose spectroscopic targets using a PARSEC isochrone (Bressan et al., 2012) with age Gyr and as guidance. RGB candidates were selected as stars within 0.13 mag of the isochrone, brighter than , and within (three times the half-light radius) of the center of Eri II. In addition, we targeted potential blue loop stars within a box defined by and . The relative priorities for RGB stars were based on brightness and projected distance from the center of the galaxy, and for blue loop candidates the priorities were based only on projected distance on the sky (since all of the stars have similar magnitudes). Remaining mask space was filled with stars that have photometry that makes them unlikely to be members. This selection process resulted in the placement of 68 slitlets on the slitmask. We observed this mask for a total of 3 hrs on the October run and 9 hrs on the November run. To ensure accurate velocity measurements, after every two 30-40 min science exposures, we acquired one wavelength calibration frame and one flatfield frame at the same position as the science exposure. For the October run, we used He, Ne, and Ar comparison lamps for wavelength calibration, while for the November run, we used Kr, Ne, and Ar lamps. The Kr lamp provides additional strong lines in the critical Å wavelength range where there are few usable Ne and Ar lines, improving the wavelength calibration around the Fraunhofer A-band.
In addition to the observations targeting candidate members of Eri II, we also obtained spectra of several metal-poor stars to serve as radial velocity templates for the velocity measurements, and a hot, rapid rotator (HR 4781) to serve as a telluric template for the velocity error corrections. More templates were also obtained during additional IMACS runs with identical observing setups. For both the radial velocity templates and the telluric template, we obtained the spectra using a north-south oriented longslit while driving the stars perpendicularly across the slit (i.e., across the dimension) at a constant rate during the exposure. These spectra simulate a source that uniformly fills the slit, and thus accurately reflect the mean integrated slit function.
2.2. Data Reduction
We reduced the IMACS spectra following the procedures described by Simon et al. (2016) for Tuc III. The reduction procedures include bias subtraction, removal of read-out pattern noise, an initial wavelength solution and slit mapping with the Cosmos pipeline (Dressler et al., 2011), and a refined wavelength calibration and spectral extraction using an IMACS pipeline derived from the DEEP2 data reduction pipeline for Keck/DEIMOS (Cooper et al., 2012).
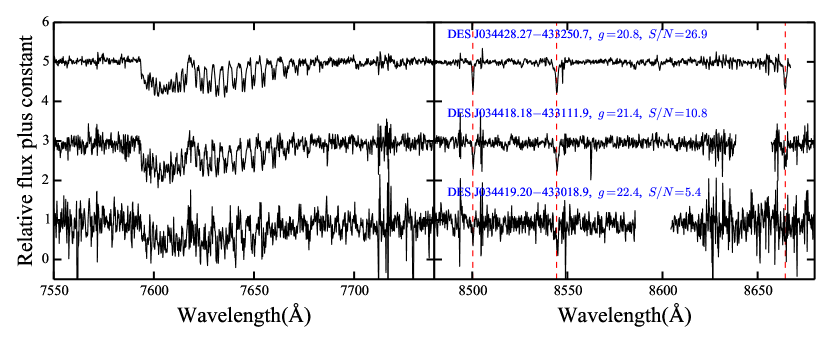
Each individual science frame was reduced using the corresponding flatfield frame and wavelength calibration frame. The end products of the pipeline are the extracted 1D spectra and the corresponding inverse-variance spectra. For the targeted 68 stars, 66 were successfully extracted, and 2 stars fell onto chip gaps or off the detector array. We then combined the extracted spectra from each observing run using inverse-variance weighting. As the November run has a much longer total exposure time and better seeing, we used the coadded spectra from the November run for the kinematic measurements in later sections. We kept the coadded spectra from the October run separate from the coadded spectra from the November run to test the possible radial velocity variation from binary orbital motion. For the November coadded spectra, we reached signal-to-noise ratio (S/N) 5 per pixel for stars at g22 and S/N30 per pixel for stars at g20.5. For the October coadded spectra, the S/N is about a factor of two lower. Finally, all the coadded spectra were normalized to unity in the continuum by fitting a second-order polynomial. Examples of the spectra at various brightness and S/N levels are shown in Figure 1.
We reduced the spectra for the velocity and telluric templates in the same manner as the science exposures described above. For the telluric template, we set the regions outside of telluric absorption bands to unity; for the velocity templates, we set the regions inside the telluric bands to unity and shifted them to rest frame.
3. VELOCITY AND METALLICITY MEASUREMENTS
3.1. Radial Velocity Measurements
We measured radial velocities by fitting reduced spectra with velocity templates using a Markov Chain Monte Carlo (MCMC) sampler (emcee; Foreman-Mackey et al., 2013),111emcee v2.2.0: http://dan.iel.fm/emcee/ and a likelihood function defined as:
| (1) |
Note that the log-likelihood is defined up to an additive constant. Here, and are the normalized spectrum and its corresponding variance, while is the normalized velocity template. For the velocity measurement, we primarily used the CaT feature, and therefore set Å and Å. Our procedure fits the radial velocity by shifting the velocity template by a velocity to maximize the likelihood function. For this paper, we use the metal-poor RGB star HD 122563 as the template for all of the science spectra.
For each spectrum, we ran an MCMC sampler with 20 walkers that each made 1000 steps including a burn-in stage of 50 steps. We used the median and the standard deviation (with clipping) of the posterior distributions as the measured velocity and velocity error for each star.
We then determined and applied a telluric correction to each velocity measurement to account for velocity errors that result from mis-centering the star within the slit. We ran the same MCMC sampler as described above, but instead used a telluric template and a fitting wavelength range of Å. For each spectrum, the telluric correction and uncertainty were obtained from the posterior distribution from the MCMC sampler.
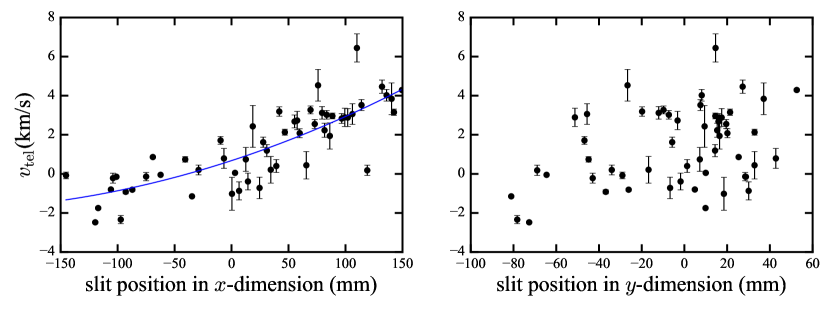
In Figure 2, we show the telluric correction as a function of slit position in the direction parallel to the slits () and perpendicular to the slits (). The correction generally ranges between 2 and 4 for this mask and shows a dependence on the slit position in the spatial direction. The RMS of the residuals after a second-order polynomial fit to the data is 1 . The systematic trend (i.e., polynomial fit) of this telluric correction is likely caused by either a small mask rotation or anamorphic demagnification of the IMACS spectrograph; the scatter around the fit (i.e., RMS) may be associated with the astrometric errors of DES Y1A1 data and the systematic uncertainty in the velocity correction determination.
The velocity was then calculated as and the statistical uncertainty of was calculated as . Note that we used from individual stars for the telluric correction rather than the polynomial fit shown in Figure 2. It is worth noting that is only the statistical uncertainty on the velocity measurements, which is associated with the S/N of the spectra. For high S/N spectra, the velocity measurement can be very precise. However, the accuracy of the velocity measurement is limited by systematic effects, such as instrument flexure, uncertainties in the wavelength calibration, uncertainties in the template velocity, template mismatching, and the uncertainties in the telluric correction. These systematic uncertainties should also be considered in the total error budget. We estimated the systematic uncertainty as the quadrature difference between repeat measurements and the statistical uncertainty (c.f. Simon & Geha, 2007; Simon et al., 2015). Similar to Simon et al. (2016), we found that this systematic uncertainty is for the October observations and for the November observations. The slight difference in the systematic errors between the two observing runs is mainly because the new Kr lamp included in November improved the wavelength solution at the blue end. We added this systematic uncertainty in quadrature with the statistical uncertainties as the final reported velocity uncertainties, .
Of the 66 extracted spectra, 54 have high enough S/N to determine velocities and velocity uncertainties using the aforementioned method. Finally, all velocity measurements are transformed to the heliocentric frame. The results are listed in Table 2.
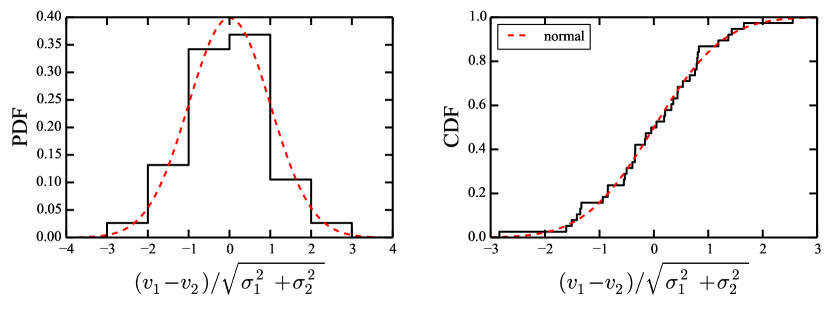
In order to confirm that our error estimation is reasonable, we select 38 stars that have measured velocities and velocity uncertainties from both the November run and October run, and compute the distribution of velocity differences between the two independent measurements (, ), divided by the quadrature sum of their uncertainties (); and are the measurements from October and and from November. The resulting distribution shown in Figure 3 is well-described by a normal distribution with zero mean and unit variance shown as a red dashed curve in the same plot. A Kolmogorov-Smirnov (K-S) test of the repeated measurements against the normal distribution gives a p-value of 0.98, confirming that our error model provides an accurate description of the velocity uncertainties. Since we do not see any outliers when comparing the results between the two observing runs, we conclude that we are not able to detect any binary stars in Eri II based on the one month baseline. Binaries with longer periods might be present, but detecting them would require additional observations with a longer time baseline.
3.2. Spectroscopic Membership Determination
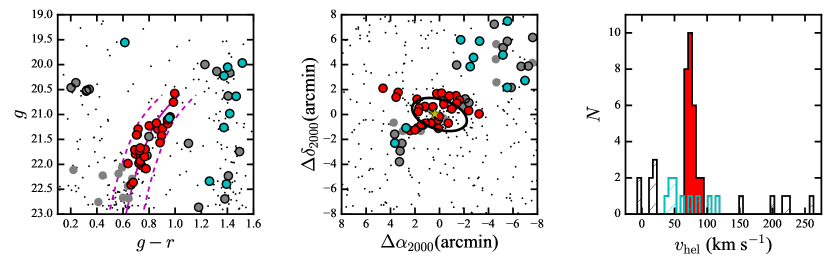
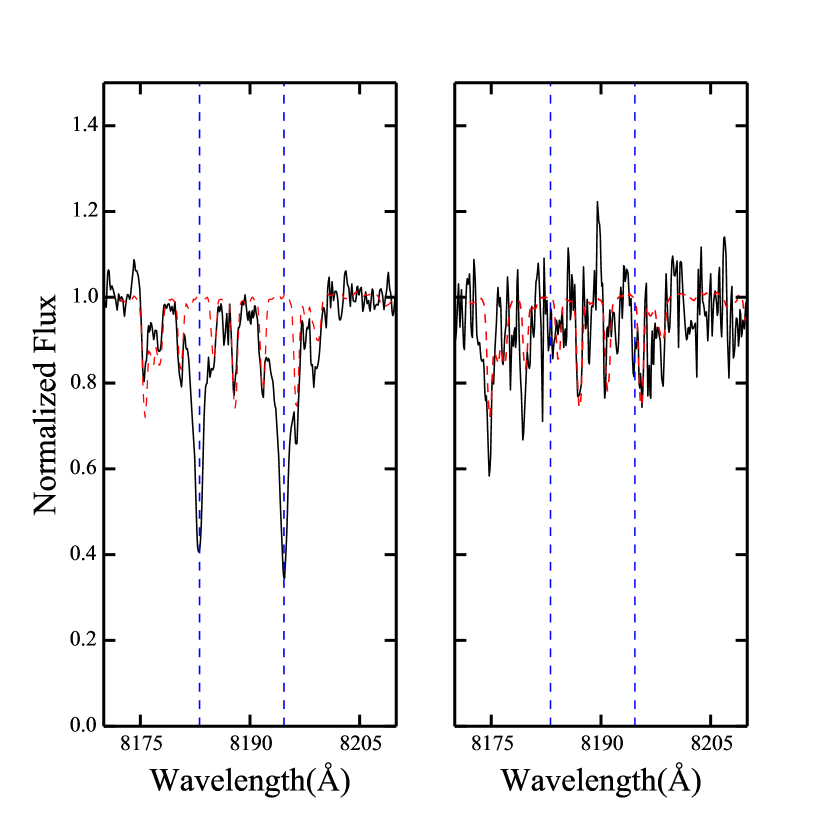
The color-magnitude diagram (CMD), spatial distribution, and velocity distribution of the candidate stars are displayed in Figure 4. From the 54 stars with measured velocities, we found 28 Eri II members that form a narrow velocity peak at 75 (right panel of Figure 4). For the large majority of the observed stars, membership status is unambiguous. The member stars located close to the center of Eri II and located along the isochrone in the CMD are highlighted in red in the histogram and denoted as red filled circles. Stars with or that are clearly not associated with Eri II are shown by gray filled circles in the left and middle panels of Figure 4. Several candidate members have a velocity close to the peak and are highlighted in cyan in the histogram, and also denoted as cyan filled circles in the left and middle panels of Figure 4. These stars are classified as non-members since they are located far from the RGB isochrone in the CMD. While DES J034404.78432727.7 lies close to the RGB isochrone, it is more than two half-light radii away from the center of Eri II along the minor axis and has strong Na I lines. In fact, all the stars coded in cyan show strong Na I lines at Å and Å (see Figure 5 as an example), indicating that they are foreground M-dwarf stars rather than distant giants (Schiavon et al., 1997).
Finally, we use the Besançon (Robin et al., 2003) Galactic stellar model to estimate the expected number of foreground main sequence stars in our spectroscopic sample. We select simulated stars within 0.2 mag of the PARSEC isochrone and with (i.e., the location of the red filled circles in the CMD in the left panel of Figure 4). We found 70 simulated stars that have a velocity consistent with the heliocentric velocity peak of Eri II (60 – 90 ) in an area of 1 deg2 centered on Eri II. When scaled to the area within two half-light radii of Eri II (0.02 deg2) the foreground contamination is expected to be 1–2 stars.
3.3. Metallicity Measurements
We measured the metallicity of the red giant members using the equivalent widths (EWs) of the CaT lines. Following the procedure described by Simon et al. (2015) and Simon et al. (2016), we fit all three of the CaT lines with a Gaussian plus Lorentzian function and then converted the summed EWs of the three CaT lines to metallicity using the calibration relation from Carrera et al. (2013). Because the horizontal branch stars of Eri II are too faint for accurate measurements in DES imaging, we used the absolute magnitude for the CaT calibration. We first performed the color-transformation from DES- and DES- to apparent magnitude using Equation (5) in Bechtol et al. (2015) and then adopted the distance modulus derived by Crnojević et al. (2016) to calculate absolute magnitudes.
Among the 28 spectroscopic members determined in §3.2, 16 of them have successful metallicity measurements. The other members either do not have large enough S/N for EW measurements, or have one of the three Ca lines falling onto the CCD chip gap. The measured metallicities are reported in Table 2.
The statistical uncertainties on the EWs are calculated from the Gaussian and Lorentzian fit. We then compute a systematic uncertainty of 0.2 Å on the summed EWs derived with repeat measurements (using the same approach as for the systematic velocity uncertainty in §3.1). The final uncertainties on the EWs reported in Table 2 are the quadrature sum of the statistical and systematic uncertainties. The metallicity uncertainties shown in Table 2 are dominated by the uncertainties of the CaT EWs, with small contributions from the uncertainties of the distance modulus, the stellar photometry, and the uncertainties on the calibration parameters from Carrera et al. (2013).
| Row | Quantity | Value |
|---|---|---|
| (1) | RA (J2000) | 03:44:20.1 |
| (2) | Dec (J2000) | 43:32:01.7 |
| (3) | Heliocentric Distance (kpc) | |
| (4) | Galactocentric Distance (kpc) | |
| (5) | ||
| (6) | () | |
| (7) | (pc) | |
| (8) | (arcmin) | |
| (9) | ||
| (10) | PA (N to E; deg) | |
| (11) | () | |
| (12) | () | |
| (13) | () | |
| (14) | () | |
| (15) | (/) | |
| (16) | ( arcmin-1) | |
| (17) | Mean metallicity | |
| (18) | Metallicity dispersion (dex) | |
| (19) | (GeV2 cm-5) | |
| (20) | (GeV2 cm-5) |
Note. — Rows (1)-(10) are taken or derived from Crnojević et al. (2016). Values in rows (11)-(20) are derived using the measurements in this paper. All values reported here (and in this paper) are from the 50th percentile of the posterior probability distributions. The uncertainties are from the 16th and 84th percentiles of the posterior probability distributions.
4. DISCUSSION
In this section we determine the global properties of Eri II and discuss its nature and origin. We then consider implications for the quenching of star formation in dwarf galaxies and constraints on the nature of dark matter.
4.1. Velocity Dispersion and Mass
With the 28 spectroscopically confirmed members, we calculated the systemic velocity and the velocity dispersion of Eri II using a 2-parameter Gaussian likelihood function similar to that of Walker et al. (2006):
| (2) |
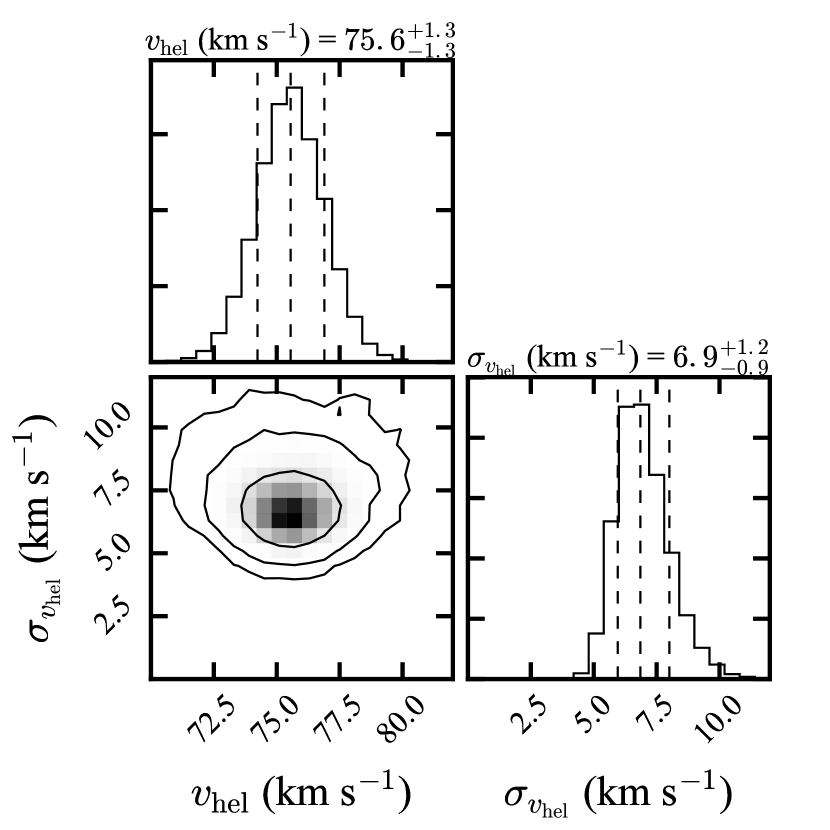
where and are the systemic velocity and the velocity dispersion of Eri II, and and are the velocities and velocity uncertainties for each member star as calculated in §3.1. We used an MCMC to sample the posterior distribution. We find a systemic velocity of and a velocity dispersion of , where we report the median of the posterior and the uncertainty calculated from the 16th and 84th percentiles. The systematic uncertainty (2.0 ) on the systemic velocity is attributed to uncertainty on the velocity zero-point of the template star. The posterior probability distribution from the MCMC sampler for the kinematic properties of Eri II is displayed on the left side of Figure 6.
In principle, the measured velocity dispersion of Eri II could be artificially inflated by the orbital motions of binary stars (McConnachie & Côté, 2010). As mentioned in §3.1, our observations do not span a long enough time baseline to detect any binaries. However, studies over longer time baselines have tended to show that binary stars do not have a significant impact on the velocity dispersion of classical dwarf spheroidals (Olszewski et al., 1996) or ultra-faint dwarfs (Minor et al., 2010; Simon et al., 2011). Given the large velocity dispersion of Eri II, the effect of the binaries is expected to be small and our results should be similar even if our sample contains a few binary stars.
We calculated the mass contained within the half-light radius adopting the mass estimator from Wolf et al. (2010), using the velocity dispersion determined above and the half-light radius of Eri II measured by Crnojević et al. (2016). The derived dynamical mass is . Given a luminosity within its half-light radius of , the mass-to-light ratio of Eri II is /. The reported uncertainties on the dynamical mass and mass-to-light ratio include the uncertainties on the velocity dispersion, half-light radius, and luminosity.
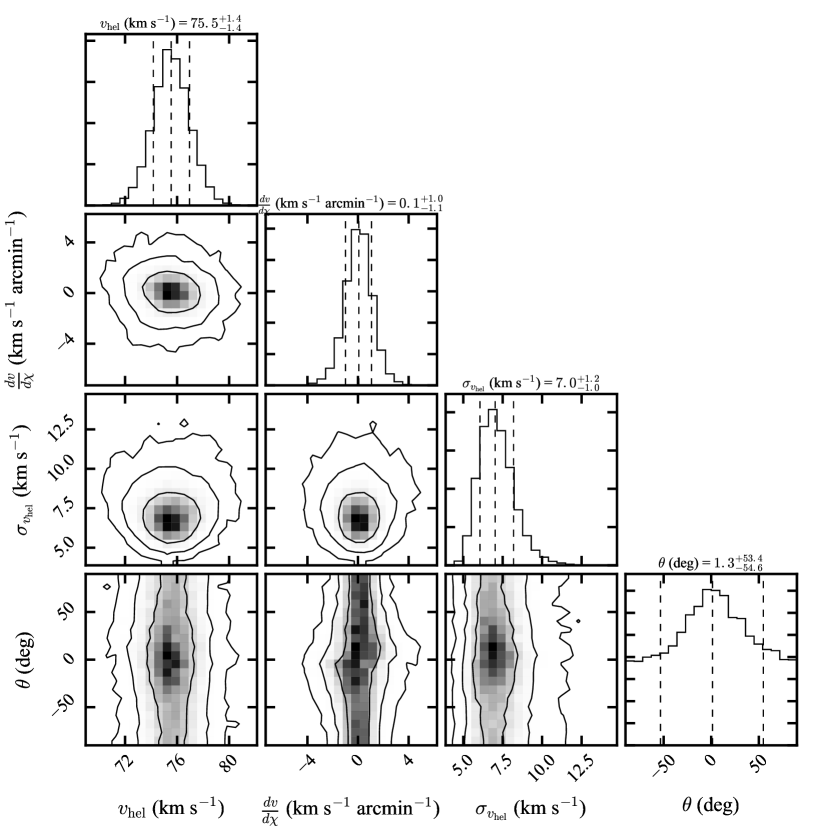
The mass estimator from Wolf et al. (2010) is only valid for dispersion-supported stellar systems in dynamical equilibrium. Given the distance to Eri II, the system is very likely to be in dynamical equilibrium. Nevertheless, considering the large ellipticity () of Eri II, we also tested the possibility of a velocity gradient, which could result either from rotational support or a tidal interaction, using a 4-parameter model (i.e., mean velocity , velocity dispersion , velocity gradient , and position angle of the gradient ) similar to that of Martin & Jin (2010) and Collins et al. (2016):
| (3) |
where is the angular distance between the Eri II center () and -th star () projected to the gradient axis at a position angle :
| (4) |
Note that we did not include the astrometric uncertainties of the stars in the likelihood, as the astrometric uncertainties are negligible compared to the velocity uncertainties (i.e., ).
We ran a 4-parameter MCMC sampler using Equations (3) and (4) to obtain the posterior probability distribution displayed in Figure 7. Since the best-fit velocity gradient, arcmin-1, is consistent with zero within 1 uncertainty, we conclude that there is no evidence for rotation or tidal interaction in Eri II, which validates the assumption used for mass derivation that Eri II is a dispersion-supported system in dynamical equilibrium.
4.2. Metallicity Dispersion
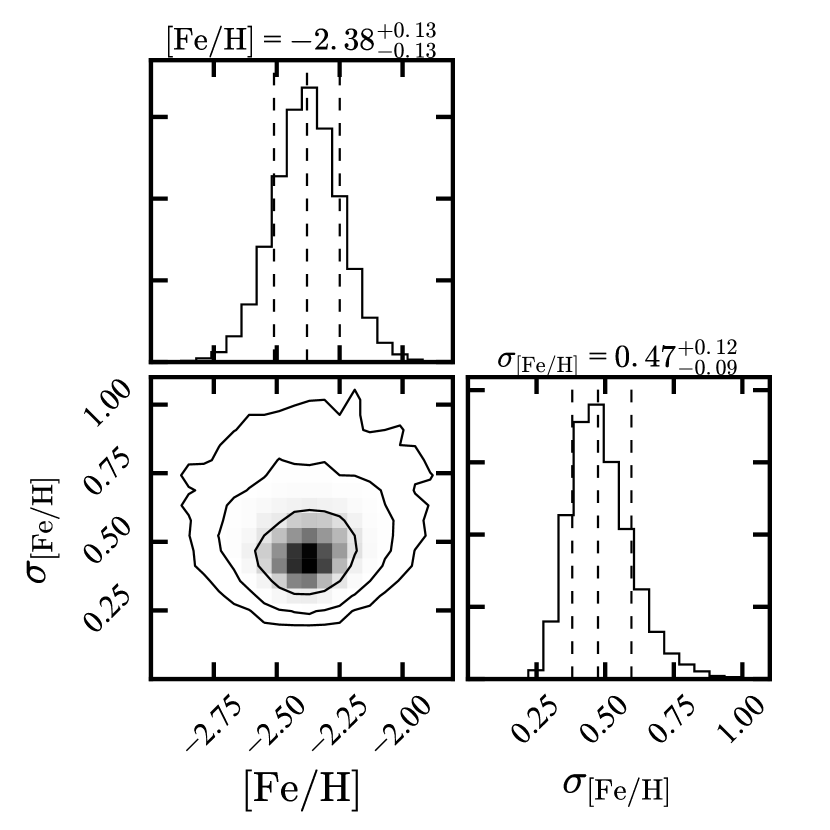
Using the CaT metallicity measurements, we find that the 16 brightest member stars of Eri II span more than 1 dex in iron abundance, ranging from to . We used a similar Gaussian likelihood model to the one described in §4.1 to calculate the mean metallicity and metallicity dispersion of Eri II. We find a mean metallicity of , with a dispersion of . The posterior probability distributions from the MCMC sampler are displayed on the right side of Figure 6. The kinematic and chemical properties of Eri II are summarized in Table 1.
4.3. The Classification of Eridanus II
The mass-to-light ratio we have derived for Eri II indicates that it is a dark matter-dominated dwarf galaxy. This value is consistent with the relation between mass-to-light ratio and luminosity for other dwarf galaxies in the Milky Way and the Local Group (e.g., Simon & Geha, 2007). The low average metallicity () and large metallicity dispersion () matches with observations of other dwarf galaxies with similar luminosities (Kirby et al., 2013). Combining these results with the orbit discussed in §4.4 and the distance, we conclude that Eri II is one of the Milky Way’s most distant satellite galaxies detected.
4.4. The Orbit of Eridanus II
The heliocentric velocity corresponds to a velocity in the Galactic Standard of Rest frame222We adopted the circular orbital velocity of Milky Way at the Sun’s radius (Bovy et al., 2012) and solar motion of (Schönrich et al., 2010) for the velocity transformation from heliocentric to Galactic Standard of Rest. . Eri II is therefore moving toward us, indicating that it is either on its first infall into the Milky Way potential, or it has passed the apocenter of the orbit on a subsequent passage. To assess whether or not Eri II is bound to the Milky Way, we derive the escape velocity at the location of Eri II () by modeling the dark matter halo of the Milky Way as a Navarro-Frenk-White (NFW) profile (Navarro et al., 1996) with a virial mass of and a concentration of . We find that the escape velocity at the location of Eri II is and that Eri II is very likely bound to the Milky Way. While it is possible that Eri II has a very large tangential velocity ( ), we find that this situation is unlikely due to the results of simulations discussed below.
To infer the orbital parameters and infall time of Eri II, we search for Eri II analogs in Exploring the Local Volume in Simulations (ELVIS; Garrison-Kimmel et al., 2014), a suite of cosmological zoom-in -body simulations using a WMAP7 (Komatsu et al., 2011) CDM cosmology. ELVIS includes 24 isolated dark-matter halos of masses similar to the Milky Way ( and ).333Note that ELVIS has a total of 48 host halos and the other 24 halos are in pairs that resemble the masses, distance, and relative velocity of the Milky Way - Andromeda pair. We did not use those paired halos in this analysis.
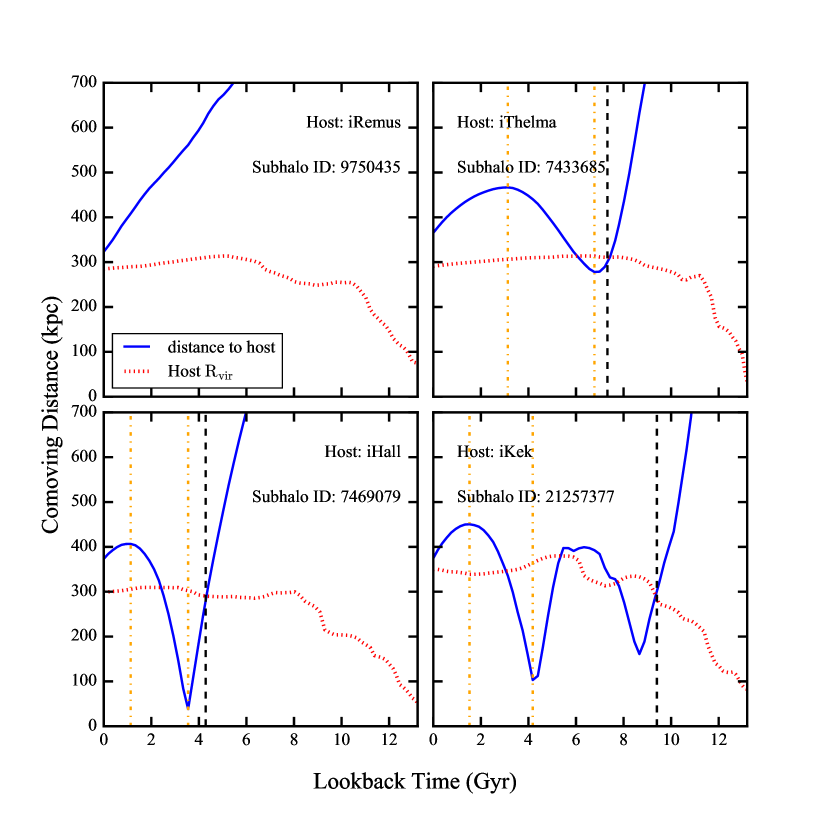
We selected Eri II analogs that are similar to Eri II in both the Galactocentric distance and line-of-sight velocity at redshift and are not located inside of any other halos. In order to calculate the line-of-sight velocity, we approximate the observer as being at the center of the host halo. This is a fair approximation as the Galactocentric distance for Eri II is much larger than Sun’s distance to the Milky Way center. Among the 24 ELVIS halos, we find 58 subhalos that possess a similar Galactocentric distance (between 320 and 420 ) and a similar (between and ) to Eri II and have a stellar mass in the range of .444Stellar masses in the ELVIS simulations are derived from an abundance matching relation and might have large uncertainties (Garrison-Kimmel et al., 2014). We therefore accepted a large stellar mass range for the Eri II analogs. All 58 of these Eri II analog subhalos have a binding energy larger than the kinetic energy and therefore they are all bound to their host halos. We therefore conclude that Eri II is very likely bound to the Milky Way. Among these 58 subhalos, 9 of them are on their first infall (i.e., the subhalos have never entered the virial radius of the host), 41 of them are on their second passages (i.e., the subhalos just passed the apocenter for the first time) with infall time around Gyr ago, and 8 of them are on their third passages (i.e., just passed the apocenter for the second time) with infall time Gyr ago. The second passage cases can also be divided into two categories: 12 subhalos have low eccentricity orbits with pericenter and orbital period of Gyr, while 29 subhalos have high eccentricity orbits with pericenter and orbital period of Gyr. We therefore conclude that Eri II is most likely on its second passage, with an eccentric orbit and a first infall time of Gyr ago (with a probability of ). Examples of the infall history in each category are given in Figure 8.
4.5. Star Formation in Eridanus II
Koposov et al. (2015) noted the presence of seven bright () blue stars near the center of Eri II, with colors and magnitudes consistent with being blue loop stars from a 250 Myr old population in Eri II (see the stars around and in left panel of Figure 4). We obtained spectra of five of these stars, and our measurements show that none of them have a velocity close to the systemic velocity of Eri II. We therefore conclude that the location of these stars near Eri II is a coincidence, and that there is no evidence for recent star formation. This result is consistent with the star formation history derived by Crnojević et al. (2016) as well as the low H I gas content measured by Westmeier et al. (2015) and Crnojević et al. (2016). In addition to the possible young population, Crnojević et al. (2016) also identified a possible intermediate-age (3 Gyr) population in Eri II. However, our spectroscopic measurements are not deep enough to target any of those stars.
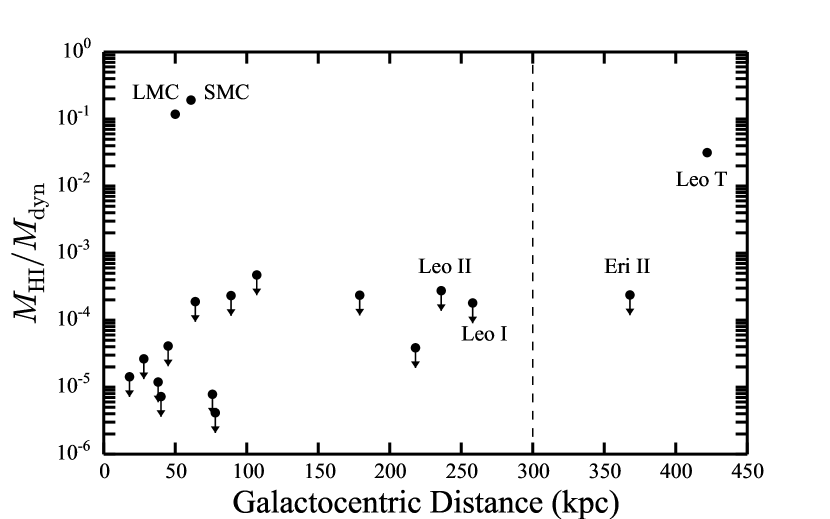
As noted by many previous studies, the dwarf galaxies around the virial radius of the Milky Way show a sharp transition in star formation rate and cold gas content, with the Magellanic Clouds as the only gas-rich, star-forming galaxies inside the Milky Way’s virial radius (e.g., Einasto et al., 1974; Blitz & Robishaw, 2000; Grcevich & Putman, 2009; Spekkens et al., 2014). Until now, Leo T ( kpc) has been the closest known low-luminosity dwarf outside the virial radius of the Milky Way. Notably, Leo T retains a significant H I gas reservoir (Irwin et al., 2007; Ryan-Weber et al., 2008) and has signatures of star formation within the past few hundred Myr (de Jong et al., 2008; Weisz et al., 2012), but the large gap in distance between the most distant gas-free objects (Leo I and Leo II at kpc) and Leo T limits its utility in constraining gas loss mechanisms for Milky Way satellites (see Figure 9). Eri II is located in this gap, slightly beyond the virial radius, and has a similar luminosity to Leo T and a larger dynamical mass. It is therefore striking that Eri II has a much lower gas content and apparently lacks any recent star formation. As suggested by Wetzel et al. (2015), quenching at stellar mass may arise from a mix of the host-halo environment and cosmic reionization. As a quiescent dwarf galaxy located close to, but beyond, the virial radius of Milky Way, Eri II is a key object for studying environmental influences on low-mass galaxies and the quenching of star formation in such systems (Weisz et al., 2014; Wetzel et al., 2015; Wheeler et al., 2015; Fillingham et al., 2016).
We compare Eri II with Leo T by searching for Leo T analogs in the ELVIS simulations, as we did for Eri II in §4.4. The radial velocity of Leo T ( ; Simon & Geha, 2007) is similar to that of Eri II. However, as Leo T is about 50 kpc farther from the Milky Way than Eri II, we found that 30% of Leo T analogs are on their first infall into the Milky Way, compared to only 15% of Eri II analogs. If the quenching of Eri II was caused by host-halo interactions, the different orbits and infall histories of Eri II and Leo T could be responsible for their differing star formation histories. If Eri II is indeed on its second orbit around the Galaxy as suggested from the results of ELVIS simulation, then the gas reservoir of Eri II could have been swept away via ram pressure stripping during its first passage. The quenching timescale for galaxies with stellar mass is less than 1.5 Gyr (Fillingham et al., 2015; Wetzel et al., 2015), matching well with the possible intermediate-age (3 Gyr) population found by Crnojević et al. (2016). However, complete removal of the neutral gas during a single orbit around the Milky Way that likely does not closely approach the Galactic disk would place stringent constraints on the halo gas density at large Galactocentric radii. Future proper motion measurements of Eri II and Leo T from HST will better constrain their orbits, determining whether or not they are on their first infall and determining their orbital pericenters.
Alternatively, the quenching of Eri II could have been caused by cosmic reionization at high redshift (e.g., Bullock et al., 2001; Brown et al., 2014). Reionization can explain the lack of gas in Eri II even if it is on its first infall. However, in that case, Eri II should not show an extended star formation history or an intermediate-age population. Future deep imaging data from HST will help determine whether star formation in Eri II ended very early, as in other ultra-faint dwarfs, or continued to later times. We note that Eri II is more distant and more massive than any of the Milky Way satellites strongly suspected to be quenched by reionization based on previous deep HST imaging (Brown et al., 2014). In this scenario, the key question is why Eri II was more susceptible to the effects of reionization than Leo T, which is currently less massive than Eri II but still contains gas. One possible explanation for the contrast between the observed properties of the two systems is that Leo T was farther away from the proto-Milky Way at the time of reionization. This hypothesis can be tested with proper motion measurements. If Leo T first fell into the Milky Way much later than Eri II, it is also possible that its isolation allowed a late phase of gas accretion and associated star formation (Ricotti, 2009).
4.6. Constraints on the Nature of Dark Matter
Ultra-faint dwarf galaxies are ideal targets for understanding the nature of dark matter. They can provide strong tests of models where dark matter is composed of weakly interacting massive particles (WIMPs) that self-annihilate to produce gamma rays (Gunn et al., 1978; Bergström & Snellman, 1988; Baltz et al., 2008). The predicted gamma-ray signal from annihilation is proportional to the line-of-sight integral through the square of the dark matter density, or so-called J-factor. The J-factor is derived by modeling the velocity using the spherical Jeans equation with prior assumptions on the parameterization of the dark matter halo profile.(e.g., Strigari et al., 2008; Essig et al., 2009; Charbonnier et al., 2011; Martinez, 2015; Geringer-Sameth et al., 2015). Following the procedure of Simon et al. (2015), we model the dark matter halo as a generalized NFW profile (Navarro et al., 1996). We use flat, ‘uninformative’ priors on the dark matter halo parameters (see, e.g., Essig et al., 2009) and assume a constant stellar velocity anisotropy. We find an integrated J-factor for Eri II of within solid angle of , and within . The error bars represent the difference between the 16th and 84th percentiles and the median of the posterior distribution of J-factor. These values assume that the dark matter halo extends beyond the radius of the outermost spectroscopically confirmed star, but truncates within the estimated tidal radius for the dark matter halo. Given that Eri II is away, the tidal radius could extend far beyond its outermost star location. We derive a tidal radius of following the description in Geringer-Sameth et al. (2015). The J-factor of Eri II is orders of magnitude smaller than the most promising dwarf galaxies, which is a direct result of the distance between Eri II and the Sun. This value is consistent with the value predicted from a simple distance scaling based on the J-factors of known dwarfs (e.g., Drlica-Wagner et al., 2015b).
While Eri II does not appear to be a promising target for indirect searches for WIMP annihilation due to its distance, the existence of a central star cluster offers a unique opportunity to constrain massive compact halo object (MACHO) dark matter with mass (Brandt, 2016). The recent detection of gravitational waves from the coalescence of 30 black holes (Abbott et al., 2016) has led to the suggestion that primordial black holes with a similar mass could constitute the dark matter (e.g., Bird et al., 2016; Clesse & García-Bellido, 2016). Interestingly, microlensing and wide binaries searches do not exclude MACHOs in the mass range between 20 and 100 (e.g., Alcock et al., 2001; Tisserand et al., 2007; Quinn et al., 2009). We therefore examine the constraints that can be placed on MACHO dark matter using the measured properties of Eri II.
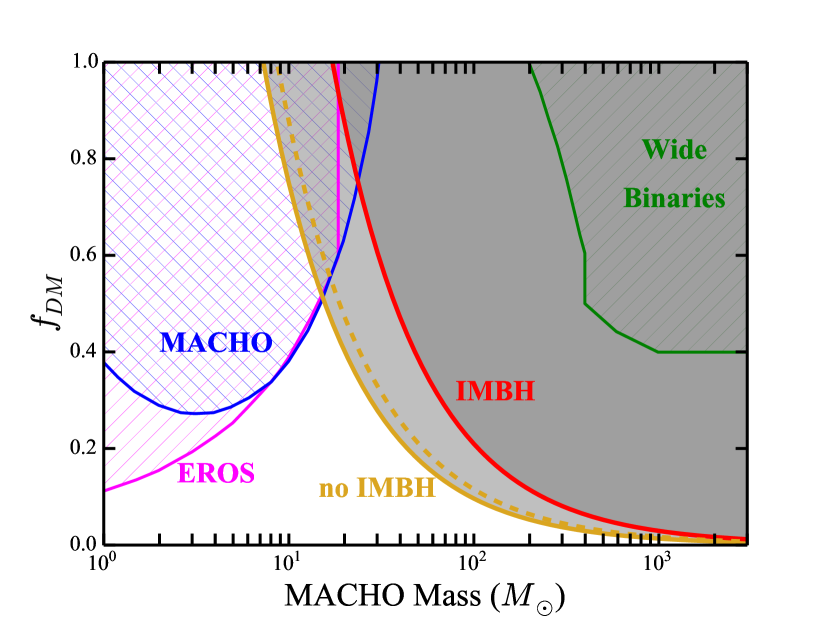
Brandt (2016) argued that MACHO dark matter would dynamically heat, and eventually dissolve, the star cluster near the center of Eri II. Brandt projected MACHO constraints from the survival of this star cluster assuming several values for the three-dimensional velocity dispersion, , and dark matter density, , of Eri II. However, the kinematics measured in §4.1 allowed us to directly derive the three-dimensional velocity dispersion and dark matter density of Eri II: and ,555Here we assume that velocity dispersion for the dark matter halo is the same as the velocity dispersion for the stars, and . assuming a uniform and isotropic distribution of dark matter within the half-light radius. With these halo properties, we derived MACHO constraints assuming the stellar cluster has an age of 3 Gyr, an initial half-light radius of pc, and a mass of 2000 ,666The star cluster has an absolute magnitude of (2000 ) and half-light radius pc (Crnojević et al., 2016). The assumptions for the stellar cluster are based on these observational results and the 3 Gyr intermediate-age population found in Eri II (Crnojević et al., 2016). We note that an older population for the cluster is possible, which would lead to a stronger MACHO constraint (i.e., shift the curve leftward). as shown in Figure 10. When the results from Eri II are combined with those from microlensing and wide binary searches (Alcock et al., 2001; Tisserand et al., 2007; Quinn et al., 2009), MACHOs with mass are constrained to be a subdominant component of dark matter. However, if there were an intermediate mass black hole (IMBH) of mass at the center of Eri II, as extrapolation of the scaling relation from Kruijssen & Lützgendorf (2013) suggests, its gravity would stabilize the star cluster and would prevent its evaporation. This effect would weaken the bounds and allow for a MACHO mass distribution peaked at a few tens of solar masses to be the main component of the dark matter in the universe (Clesse & García-Bellido, 2015).
In addition to constraints on MACHOs, Eri II may also offer an opportunity to constrain the density profile of dark matter halos, addressing the so-called “cusp-core problem”. Historically, cosmological simulations (Dubinski & Carlberg, 1991; Navarro et al., 1996) predict that dark matter halos should have a cuspy central density profile. However, observational results have consistently pointed to shallower profiles (e.g., de Blok et al., 2001; Walker & Penarrubia, 2011; Adams et al., 2014), and theoretical calculations have been developed to explain why cusps are not found (e.g., Governato et al., 2012; Pontzen & Governato, 2012; Di Cintio et al., 2014). In these models, dark matter cores arise from gravitational interactions between dark matter and baryons, and should occur in dwarf galaxies that underwent multiple vigorous episodes of star formation. Crnojević et al. (2016) show that Eri II is possibly the least massive dwarf galaxy that is known to have an extended star formation history and therefore its density profile may also be affected by baryons. The star cluster of Eri II may offer potential to constrain the dark matter profile of Eri II through survivability arguments (see, e.g., Cole et al., 2012) and could provide an independent probe of the dark matter profile shape. A better understanding of the dark matter distribution at small scales will help us understand how the dwarf galaxies we observe today are linked to the primordial population of dark matter subhalos predicted by CDM cosmology.
5. SUMMARY
We obtained Magellan/IMACS spectroscopy of stars in the recently-discovered Milky Way satellite Eridanus II. We identified 28 members based on the radial velocities of 54 stars in the vicinity of Eri II. Of the confirmed members, 16 stars have large enough S/N to measure their metallicity.
We find a systemic velocity of ( ) and a velocity dispersion of . The mass within the half-light radius of Eri II is , corresponding to a dynamical mass-to-light ratio of /. The mean metallicity of Eri II is , with a metallicity dispersion of . Both the dynamical and chemical evidence show that Eri II is a dark matter-dominated dwarf galaxy.
The negative velocity of Eri II in the Galactic Standard of Rest frame implies that it is moving towards the Milky Way. Eri II is therefore either falling into the Milky Way potential for the first time, or it has recently passed the apocenter of its orbit. By identifying subhalos in dark matter-only simulations that are consistent with the line-of-sight velocity and distance of Eri II, we show that Eri II is very likely bound to the Milky Way and it is mostly likely on its second infall with an eccentric orbit. Future measurements of its proper motion will better constrain its orbit and confirm its origin. Furthermore, our measurements of radial velocities show that none of the candidate blue loop stars we observed are associated with Eri II. We therefore conclude that there is no evidence for recent star formation (250 Myr) in Eri II.
Though Eri II is not a promising target for indirect searches for WIMP annihilation due to its distance, it offers a unique opportunity to constrain MACHO dark matter because of the existence of a central star cluster. Our spectroscopic analysis provides a direct measurement of the mass and density of the Eri II’s dark matter halo, and therefore provides more precise constraints on the abundance of MACHO dark matter. Moreover, the existence of the star cluster may also offer an independent probe to constrain the dark matter density profile.
References
- Abbott et al. (2016) Abbott, B. P., Abbott, R., Abbott, T. D., et al. 2016, Physical Review Letters, 116, 061102
- Adams et al. (2014) Adams, J. J., Simon, J. D., Fabricius, M. H., et al. 2014, ApJ, 789, 63
- Alcock et al. (2001) Alcock, C., Allsman, R. A., Alves, D. R., et al. 2001, ApJ, 550, L169
- Astropy Collaboration et al. (2013) Astropy Collaboration, Robitaille, T. P., Tollerud, E. J., et al. 2013, A&A, 558, A33
- Baltz et al. (2008) Baltz, E., Berenji, B., Bertone, G., et al. 2008, J. Cosmology Astropart. Phys, 0807, 013
- Barnes et al. (2001) Barnes, D. G., Staveley-Smith, L., de Blok, W. J. G., et al. 2001, MNRAS, 322, 486
- Bechtol et al. (2015) Bechtol, K., Drlica-Wagner, A., Balbinot, E., et al. 2015, ApJ, 807, 50
- Bergström & Snellman (1988) Bergström, L., & Snellman, H. 1988, Phys. Rev. D, 37, 3737
- Bird et al. (2016) Bird, S., Cholis, I., Muñoz, J. B., et al. 2016, Physical Review Letters, 116, 201301
- Bland-Hawthorn & Gerhard (2016) Bland-Hawthorn, J., & Gerhard, O. 2016, ArXiv e-prints, arXiv:1602.07702
- Blitz & Robishaw (2000) Blitz, L., & Robishaw, T. 2000, ApJ, 541, 675
- Bovy et al. (2012) Bovy, J., Allende Prieto, C., Beers, T. C., et al. 2012, ApJ, 759, 131
- Brandt (2016) Brandt, T. D. 2016, ApJ, 824, L31
- Bressan et al. (2012) Bressan, A., Marigo, P., Girardi, L., et al. 2012, MNRAS, 427, 127
- Brown et al. (2014) Brown, T. M., Tumlinson, J., Geha, M., et al. 2014, ApJ, 796, 91
- Brüns et al. (2005) Brüns, C., Kerp, J., Staveley-Smith, L., et al. 2005, A&A, 432, 45
- Bullock et al. (2001) Bullock, J. S., Kravtsov, A. V., & Weinberg, D. H. 2001, ApJ, 548, 33
- Carrera et al. (2013) Carrera, R., Pancino, E., Gallart, C., & del Pino, A. 2013, MNRAS, 434, 1681
- Charbonnier et al. (2011) Charbonnier, A., Combet, C., Daniel, M., et al. 2011, MNRAS, 418, 1526
- Clesse & García-Bellido (2015) Clesse, S., & García-Bellido, J. 2015, Phys. Rev. D, 92, 023524
- Clesse & García-Bellido (2016) —. 2016, Phys. Dark Univ., 10, 002
- Cole et al. (2012) Cole, D. R., Dehnen, W., Read, J. I., & Wilkinson, M. I. 2012, MNRAS, 426, 601
- Collins et al. (2016) Collins, M. L. M., Tollerud, E. J., Sand, D. J., et al. 2016, ArXiv e-prints, arXiv:1608.05710
- Cooper et al. (2012) Cooper, M. C., Newman, J. A., Davis, M., Finkbeiner, D. P., & Gerke, B. F. 2012, spec2d: DEEP2 DEIMOS Spectral Pipeline, Astrophysics Source Code Library, ascl:1203.003
- Crnojević et al. (2016) Crnojević, D., Sand, D. J., Zaritsky, D., et al. 2016, ApJ, 824, L14
- de Blok et al. (2001) de Blok, W. J. G., McGaugh, S. S., Bosma, A., & Rubin, V. C. 2001, ApJ, 552, L23
- de Jong et al. (2008) de Jong, J. T. A., Harris, J., Coleman, M. G., et al. 2008, ApJ, 680, 1112
- Di Cintio et al. (2014) Di Cintio, A., Brook, C. B., Macciò, A. V., et al. 2014, MNRAS, 437, 415
- Dressler et al. (2006) Dressler, A., Hare, T., Bigelow, B. C., & Osip, D. J. 2006, in Proc. SPIE, Vol. 6269, Society of Photo-Optical Instrumentation Engineers (SPIE) Conference Series, 62690F
- Dressler et al. (2011) Dressler, A., Bigelow, B., Hare, T., et al. 2011, PASP, 123, 288
- Drlica-Wagner et al. (2015a) Drlica-Wagner, A., Bechtol, K., Rykoff, E. S., et al. 2015a, ApJ, 813, 109
- Drlica-Wagner et al. (2015b) Drlica-Wagner, A., Albert, A., Bechtol, K., et al. 2015b, ApJ, 809, L4
- Drlica-Wagner et al. (2016) Drlica-Wagner, A., Bechtol, K., Allam, S., et al. 2016, submitted to ApJ, arXiv:1609.02148
- Dubinski & Carlberg (1991) Dubinski, J., & Carlberg, R. G. 1991, ApJ, 378, 496
- Einasto et al. (1974) Einasto, J., Saar, E., Kaasik, A., & Chernin, A. D. 1974, Nature, 252, 111
- Essig et al. (2009) Essig, R., Sehgal, N., & Strigari, L. E. 2009, Phys. Rev. D, 80, 023506
- Fillingham et al. (2016) Fillingham, S. P., Cooper, M. C., Pace, A. B., et al. 2016, MNRAS, 463, 1916
- Fillingham et al. (2015) Fillingham, S. P., Cooper, M. C., Wheeler, C., et al. 2015, MNRAS, 454, 2039
- Foreman-Mackey (2016) Foreman-Mackey, D. 2016, The Journal of Open Source Software, 24, doi:10.21105/joss.00024
- Foreman-Mackey et al. (2013) Foreman-Mackey, D., Hogg, D. W., Lang, D., & Goodman, J. 2013, PASP, 125, 306
- Garrison-Kimmel et al. (2014) Garrison-Kimmel, S., Boylan-Kolchin, M., Bullock, J. S., & Lee, K. 2014, MNRAS, 438, 2578
- Geringer-Sameth et al. (2015) Geringer-Sameth, A., Koushiappas, S. M., & Walker, M. 2015, ApJ, 801, 74
- Governato et al. (2012) Governato, F., Zolotov, A., Pontzen, A., et al. 2012, MNRAS, 422, 1231
- Grcevich & Putman (2009) Grcevich, J., & Putman, M. E. 2009, ApJ, 696, 385
- Gunn et al. (1978) Gunn, J. E., Lee, B. W., Lerche, I., Schramm, D. N., & Steigman, G. 1978, ApJ, 223, 1015
- Homma et al. (2016) Homma, D., Chiba, M., Okamoto, S., et al. 2016, ArXiv e-prints, arXiv:1609.04346
- Irwin et al. (2007) Irwin, M. J., Belokurov, V., Evans, N. W., et al. 2007, ApJ, 656, L13
- Kim & Jerjen (2015) Kim, D., & Jerjen, H. 2015, ApJ, 808, L39
- Kim et al. (2015a) Kim, D., Jerjen, H., Mackey, D., Da Costa, G. S., & Milone, A. P. 2015a, ApJ, 804, L44
- Kim et al. (2015b) Kim, D., Jerjen, H., Milone, A. P., Mackey, D., & Da Costa, G. S. 2015b, ApJ, 803, 63
- Kirby et al. (2013) Kirby, E. N., Cohen, J. G., Guhathakurta, P., et al. 2013, ApJ, 779, 102
- Komatsu et al. (2011) Komatsu, E., Smith, K. M., Dunkley, J., et al. 2011, ApJS, 192, 18
- Koposov et al. (2015) Koposov, S. E., Belokurov, V., Torrealba, G., & Evans, N. W. 2015, ApJ, 805, 130
- Kruijssen & Lützgendorf (2013) Kruijssen, J. M. D., & Lützgendorf, N. 2013, MNRAS, 434, L41
- Laevens et al. (2015a) Laevens, B. P. M., Martin, N. F., Ibata, R. A., et al. 2015a, ApJ, 802, L18
- Laevens et al. (2015b) Laevens, B. P. M., Martin, N. F., Bernard, E. J., et al. 2015b, ApJ, 813, 44
- Martin & Jin (2010) Martin, N. F., & Jin, S. 2010, ApJ, 721, 1333
- Martin et al. (2015) Martin, N. F., Nidever, D. L., Besla, G., et al. 2015, ApJ, 804, L5
- Martinez (2015) Martinez, G. D. 2015, MNRAS, 451, 2524
- McConnachie (2012) McConnachie, A. W. 2012, AJ, 144, 4
- McConnachie & Côté (2010) McConnachie, A. W., & Côté, P. 2010, ApJ, 722, L209
- Minor et al. (2010) Minor, Q. E., Martinez, G., Bullock, J., Kaplinghat, M., & Trainor, R. 2010, ApJ, 721, 1142
- Navarro et al. (1996) Navarro, J. F., Frenk, C. S., & White, S. D. M. 1996, ApJ, 462, 563
- Olszewski et al. (1996) Olszewski, E. W., Pryor, C., & Armandroff, T. E. 1996, AJ, 111, 750
- Pontzen & Governato (2012) Pontzen, A., & Governato, F. 2012, MNRAS, 421, 3464
- Quinn et al. (2009) Quinn, D. P., Wilkinson, M. I., Irwin, M. J., et al. 2009, MNRAS, 396, L11
- Ricotti (2009) Ricotti, M. 2009, MNRAS, 392, L45
- Robin et al. (2003) Robin, A. C., Reylé, C., Derrière, S., & Picaud, S. 2003, A&A, 409, 523
- Ryan-Weber et al. (2008) Ryan-Weber, E. V., Begum, A., Oosterloo, T., et al. 2008, MNRAS, 384, 535
- Schiavon et al. (1997) Schiavon, R. P., Barbuy, B., Rossi, S. C. F., Milone, & A. 1997, ApJ, 479, 902
- Schönrich et al. (2010) Schönrich, R., Binney, J., & Dehnen, W. 2010, MNRAS, 403, 1829
- Simon & Geha (2007) Simon, J. D., & Geha, M. 2007, ApJ, 670, 313
- Simon et al. (2011) Simon, J. D., Geha, M., Minor, Q. E., et al. 2011, ApJ, 733, 46
- Simon et al. (2015) Simon, J. D., Drlica-Wagner, A., Li, T. S., et al. 2015, ApJ, 808, 95
- Simon et al. (2016) Simon, J. D., Li, T. S., Drlica-Wagner, A., et al. 2016, ArXiv e-prints, arXiv:1610.05301
- Sohn et al. (2007) Sohn, S. T., Majewski, S. R., Muñoz, R. R., et al. 2007, ApJ, 663, 960
- Spekkens et al. (2014) Spekkens, K., Urbancic, N., Mason, B. S., Willman, B., & Aguirre, J. E. 2014, ApJ, 795, L5
- Stanimirović et al. (2004) Stanimirović, S., Staveley-Smith, L., & Jones, P. A. 2004, ApJ, 604, 176
- Strigari et al. (2008) Strigari, L. E., Koushiappas, S. M., Bullock, J. S., et al. 2008, ApJ, 678, 614
- Taylor et al. (2016) Taylor, C., Boylan-Kolchin, M., Torrey, P., Vogelsberger, M., & Hernquist, L. 2016, MNRAS, 461, 3483
- Tisserand et al. (2007) Tisserand, P., Le Guillou, L., Afonso, C., et al. 2007, A&A, 469, 387
- Torrealba et al. (2016a) Torrealba, G., Koposov, S. E., Belokurov, V., & Irwin, M. 2016a, MNRAS, 459, 2370
- Torrealba et al. (2016b) Torrealba, G., Koposov, S. E., Belokurov, V., et al. 2016b, MNRAS, 463, 712
- van der Marel et al. (2002) van der Marel, R. P., Alves, D. R., Hardy, E., & Suntzeff, N. B. 2002, AJ, 124, 2639
- Walker et al. (2006) Walker, M. G., Mateo, M., Olszewski, E. W., et al. 2006, AJ, 131, 2114
- Walker & Penarrubia (2011) Walker, M. G., & Penarrubia, J. 2011, ApJ, 742, 20
- Weisz et al. (2014) Weisz, D. R., Dolphin, A. E., Skillman, E. D., et al. 2014, ApJ, 789, 147
- Weisz et al. (2012) Weisz, D. R., Zucker, D. B., Dolphin, A. E., et al. 2012, ApJ, 748, 88
- Westmeier et al. (2015) Westmeier, T., Staveley-Smith, L., Calabretta, M., et al. 2015, MNRAS, 453, 338
- Wetzel et al. (2015) Wetzel, A. R., Tollerud, E. J., & Weisz, D. R. 2015, ApJ, 808, L27
- Wheeler et al. (2015) Wheeler, C., Oñorbe, J., Bullock, J. S., et al. 2015, MNRAS, 453, 1305
- Wolf et al. (2010) Wolf, J., Martinez, G. D., Bullock, J. S., et al. 2010, MNRAS, 406, 1220
| ID | MJDaaMJD = 57345.7 corresponds to the November run and MJD = 57312.8 corresponds to the October run. Since for both runs the observations were made over two nights, the MJD listed here is the weighted mean observation date, which occurs during daylight hours. | RA | DEC | bbQuoted magnitudes represent the weighted-average dereddened PSF magnitude derived from the DES images with SExtractor. | bbQuoted magnitudes represent the weighted-average dereddened PSF magnitude derived from the DES images with SExtractor. | S/N | MEM | |||
|---|---|---|---|---|---|---|---|---|---|---|
| (deg) | (deg) | (mag) | (mag) | () | (Å) | |||||
| DES J034338.10432550.9 | 57345.7 | 55.90874 | -43.43079 | 22.23 | 20.82 | 15.4 | – | 0 | ||
| … | 57312.8 | … | … | … | … | 7.0 | – | … | ||
| DES J034340.06432808.3 | 57345.7 | 55.91690 | -43.46898 | 20.14 | 18.82 | 59.9 | – | 0 | ||
| … | 57312.8 | … | … | … | … | 29.2 | – | … | ||
| DES J034341.56432918.2 | 57345.7 | 55.92317 | -43.48838 | 19.97 | 18.45 | 139.8 | – | 0 | ||
| … | 57312.8 | … | … | … | … | 70.2 | – | … | ||
| DES J034343.30432810.1 | 57345.7 | 55.93042 | -43.46948 | 20.63 | 19.22 | 68.4 | – | 0 | ||
| … | 57312.8 | … | … | … | … | 32.4 | – | … | ||
| DES J034347.77432951.7 | 57345.7 | 55.94904 | -43.49771 | 20.53 | 20.21 | 13.2 | – | 0 | ||
| … | 57312.8 | … | … | … | … | 5.7 | – | – | … | |
| DES J034349.44432432.1 | 57345.7 | 55.95601 | -43.40893 | 20.23 | 18.85 | 69.9 | – | 0 | ||
| … | 57312.8 | … | … | … | … | 33.8 | – | … | ||
| DES J034349.53432609.3 | 57345.7 | 55.95637 | -43.43590 | 21.58 | 20.48 | 14.8 | – | – | 0 | |
| … | 57312.8 | … | … | … | … | 7.1 | – | – | … | |
| DES J034349.54432951.6 | 57345.7 | 55.95642 | -43.49765 | 20.64 | 19.17 | 75.9 | – | 0 | ||
| … | 57312.8 | … | … | … | … | 37.9 | – | … | ||
| DES J034351.43432639.7 | 57345.7 | 55.96431 | -43.44436 | 21.74 | 20.25 | 26.8 | – | 0 | ||
| … | 57312.8 | … | … | … | … | 11.7 | – | … | ||
| DES J034351.50432714.9 | 57345.7 | 55.96460 | -43.45415 | 19.55 | 18.94 | 37.6 | – | – | 0 | |
| … | 57312.8 | … | … | … | … | 17.9 | – | … | ||
| DES J034355.42432447.2 | 57345.7 | 55.98091 | -43.41310 | 20.36 | 20.12 | 14.3 | – | 0 | ||
| … | 57312.8 | … | … | … | … | 7.1 | – | … | ||
| DES J034402.04432608.5 | 57345.7 | 56.00848 | -43.43570 | 20.98 | 19.56 | 63.8 | – | 0 | ||
| … | 57312.8 | … | … | … | … | 30.3 | – | … | ||
| DES J034402.24433158.8 | 57345.7 | 56.00932 | -43.53299 | 21.73 | 21.00 | 7.2 | 1 | |||
| DES J034404.78432727.7 | 57345.7 | 56.01991 | -43.45769 | 21.07 | 20.12 | 20.0 | – | – | 0 | |
| … | 57312.8 | … | … | … | … | 8.1 | – | – | … | |
| DES J034406.25432811.1 | 57345.7 | 56.02605 | -43.46976 | 22.34 | 21.07 | 11.4 | – | – | 0 | |
| DES J034406.86433105.2 | 57345.7 | 56.02857 | -43.51812 | 22.86 | 21.68 | 5.9 | – | – | 0 | |
| DES J034406.94433143.4 | 57345.7 | 56.02892 | -43.52871 | 21.11 | 20.16 | 15.2 | – | – | 1 | |
| … | 57312.8 | … | … | … | … | 7.2 | – | – | … | |
| DES J034408.52433046.8 | 57345.7 | 56.03551 | -43.51300 | 20.00 | 18.77 | 61.3 | – | 0 | ||
| … | 57312.8 | … | … | … | … | 28.9 | – | … | ||
| DES J034410.56432602.0 | 57345.7 | 56.04402 | -43.43390 | 20.05 | 18.65 | 97.6 | – | 0 | ||
| … | 57312.8 | … | … | … | … | 47.4 | – | … | ||
| DES J034411.10433052.1 | 57345.7 | 56.04626 | -43.51447 | 22.02 | 21.28 | 6.5 | – | – | 1 | |
| DES J034412.28433105.9 | 57345.7 | 56.05116 | -43.51831 | 21.98 | 21.25 | 5.3 | – | – | 1 | |
| DES J034412.37432803.5 | 57345.7 | 56.05156 | -43.46764 | 21.44 | 20.64 | 12.5 | – | – | 0 | |
| DES J034412.63433031.3 | 57345.7 | 56.05264 | -43.50870 | 21.79 | 21.10 | 8.2 | – | – | 1 | |
| … | 57312.8 | … | … | … | … | 3.4 | – | – | … | |
| DES J034414.62433134.8 | 57345.7 | 56.06092 | -43.52633 | 21.57 | 20.68 | 13.0 | 1 | |||
| … | 57312.8 | … | … | … | … | 5.7 | – | – | … | |
| DES J034415.65433032.0 | 57345.7 | 56.06520 | -43.50890 | 22.09 | 21.31 | 7.4 | – | – | 1 | |
| DES J034416.14433243.4 | 57345.7 | 56.06724 | -43.54538 | 20.58 | 19.58 | 28.8 | 1 | |||
| … | 57312.8 | … | … | … | … | 14.2 | … | |||
| DES J034416.29433038.7 | 57345.7 | 56.06786 | -43.51076 | 20.49 | 20.15 | 13.4 | – | 0 | ||
| DES J034418.18433111.9 | 57345.7 | 56.07574 | -43.51998 | 21.40 | 20.69 | 10.8 | 1 | |||
| … | 57312.8 | … | … | … | … | 4.3 | – | – | … | |
| DES J034419.20433018.9 | 57345.7 | 56.08000 | -43.50525 | 22.36 | 21.68 | 5.4 | – | – | 1 | |
| DES J034420.20433210.9 | 57345.7 | 56.08417 | -43.53636 | 21.42 | 20.53 | 12.0 | – | – | 1 | |
| … | 57312.8 | … | … | … | … | 6.3 | – | – | … | |
| DES J034420.62433308.1 | 57345.7 | 56.08593 | -43.55225 | 21.71 | 21.02 | 7.4 | – | – | 1 | |
| … | 57312.8 | … | … | … | … | 3.9 | – | – | … | |
| DES J034420.77433227.6 | 57345.7 | 56.08655 | -43.54101 | 21.28 | 20.37 | 16.8 | 1 | |||
| … | 57312.8 | … | … | … | … | 7.6 | … | |||
| DES J034421.34433020.9 | 57345.7 | 56.08892 | -43.50581 | 21.30 | 20.43 | 15.3 | 1 | |||
| … | 57312.8 | … | … | … | … | 6.7 | – | – | … | |
| DES J034423.06433124.4 | 57345.7 | 56.09608 | -43.52345 | 21.67 | 20.94 | 9.5 | 1 | |||
| … | 57312.8 | … | … | … | … | 3.6 | – | – | … | |
| DES J034423.98433243.6 | 57345.7 | 56.09990 | -43.54543 | 21.05 | 20.09 | 19.9 | 1 | |||
| … | 57312.8 | … | … | … | … | 9.7 | … | |||
| DES J034426.53433243.9 | 57345.7 | 56.11054 | -43.54552 | 21.29 | 20.58 | 12.3 | 1 | |||
| … | 57312.8 | … | … | … | … | 4.7 | – | – | … | |
| DES J034426.64433122.8 | 57345.7 | 56.11100 | -43.52301 | 21.18 | 20.24 | 19.7 | 1 | |||
| … | 57312.8 | … | … | … | … | 8.2 | – | – | … | |
| DES J034427.50433252.8 | 57345.7 | 56.11457 | -43.54801 | 21.98 | 21.34 | 5.1 | 1 | |||
| DES J034428.27433250.7 | 57345.7 | 56.11778 | -43.54742 | 20.75 | 19.77 | 26.9 | 1 | |||
| … | 57312.8 | … | … | … | … | 12.4 | … | |||
| DES J034429.32433130.3 | 57345.7 | 56.12217 | -43.52509 | 21.41 | 20.71 | 11.3 | 1 | |||
| … | 57312.8 | … | … | … | … | 5.2 | – | – | … | |
| DES J034429.71433147.9 | 57345.7 | 56.12379 | -43.52998 | 21.17 | 20.32 | 17.1 | 1 | |||
| … | 57312.8 | … | … | … | … | 7.9 | – | – | … | |
| DES J034430.00433305.8 | 57345.7 | 56.12499 | -43.55162 | 20.51 | 20.19 | 14.4 | – | – | 0 | |
| DES J034430.24433048.0 | 57345.7 | 56.12601 | -43.51333 | 22.41 | 21.75 | 4.6 | – | – | 1 | |
| DES J034431.11433316.0 | 57345.7 | 56.12962 | -43.55444 | 21.70 | 20.93 | 9.0 | 1 | |||
| … | 57312.8 | … | … | … | … | 4.5 | – | – | … | |
| DES J034433.36433319.1 | 57345.7 | 56.13898 | -43.55531 | 21.84 | 21.08 | 7.0 | – | – | 1 | |
| DES J034435.17433306.2 | 57345.7 | 56.14654 | -43.55172 | 22.39 | 21.00 | 16.2 | – | 0 | ||
| … | 57312.8 | … | … | … | … | 7.2 | – | … | ||
| DES J034437.06433420.7 | 57345.7 | 56.15440 | -43.57242 | 22.69 | 21.31 | 14.6 | – | 0 | ||
| … | 57312.8 | … | … | … | … | 7.2 | – | – | … | |
| DES J034437.87433457.2 | 57345.7 | 56.15777 | -43.58255 | 21.82 | 21.04 | 5.6 | – | – | 0 | |
| DES J034438.15433549.0 | 57345.7 | 56.15897 | -43.59693 | 20.17 | 18.75 | 71.7 | – | 0 | ||
| … | 57312.8 | … | … | … | … | 37.9 | – | … | ||
| DES J034438.78433015.2 | 57345.7 | 56.16156 | -43.50421 | 21.79 | 21.06 | 8.5 | – | – | 1 | |
| … | 57312.8 | … | … | … | … | 2.6 | – | – | … | |
| DES J034439.68433038.6 | 57345.7 | 56.16534 | -43.51073 | 21.94 | 21.20 | 5.9 | – | – | 1 | |
| DES J034440.26433419.3 | 57345.7 | 56.16773 | -43.57202 | 21.26 | 19.89 | 34.8 | – | 0 | ||
| … | 57312.8 | … | … | … | … | 17.9 | – | … | ||
| DES J034440.32433336.5 | 57345.7 | 56.16801 | -43.56015 | 20.46 | 20.26 | 11.4 | – | – | 0 | |
| DES J034445.57432955.4 | 57345.7 | 56.18989 | -43.49872 | 21.23 | 20.43 | 16.2 | 1 | |||
| … | 57312.8 | … | … | … | … | 7.1 | – | – | … |