Local dissipation limits the dynamics of impacting droplets on smooth and rough substrates
Abstract
A droplet that impacts onto a solid substrate deforms in a complex dynamics. To extract the principal mechanisms that dominate this dynamics we deploy numerical simulations based on the phase field method. Direct comparison with experiments suggests that a dissipation local to the contact line limits the droplet spreading dynamics and its scaled maximum spreading radius . By assuming linear response through a drag force at the contact line, our simulations rationalize experimental observations for droplet impact on both smooth and rough substrates, measured through a single contact line friction parameter . Moreover, our analysis shows that at low and intermediate impact speeds dissipation at the contact line limits the dynamics and we describe by the scaling law that is a function of the droplet viscosity () and its Reynolds number ().
I Introduction
Impact of liquid droplets onto a solid substrate is essential to applications such as spray coating Dykhuizen (1994), ink-jet printingAttinger, Zhao, and Poulikakos (2000), additive manufacturing Fathi, Dickens, and Fouchal (2010) and pesticide depositionBergeron et al. (2000). Upon impact with the substrate the droplet deforms in a complex dynamics, where a gas film can become trapped underneath the droplet Mehdizadeh, Chandra, and Mostaghimi (2004); Mandre, Mani, and Brenner (2009); Duchemin and Josserand (2011); Kolinski et al. (2012); Bouwhuis et al. (2012); Liu, Tan, and Xu (2013); Visser et al. (2015); Li and Thoroddsen (2015) and as it spreads create a splash by droplet ejection at the tip of its spreading frontDriscoll and Nagel (2011); Yokoi (2011); Visser et al. (2012); Riboux and Gordillo (2014); Xu, Zhang, and Nagel (2005). The droplet deformation and spreading is typically driven by its inertia and hindered by viscous and surface tension forces. Two non-dimensional numbers are particularly relevant to characterize the dynamics, which is the Reynolds number giving the ratio between inertia and viscous forces and the Weber number which gives the ratio between inertia and surface tension forces. is the surface tension coefficient of the gas-liquid, is the liquid density, is the liquid viscosity and is the droplet impact speed. Besides inertia, viscosity and surface tension, we hypothesize and show that a dissipation local to the contact line can limit the droplet dynamics on both smooth and rough substrates.
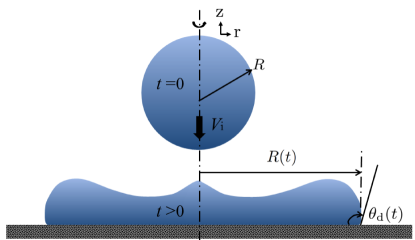
One parameter that describes the droplet impact dynamics and is typically quantified is the spreading factor , where is the droplet spreading radius, is the initial droplet radius and , see Fig.1. Two primary regimes have been identified to describe ; an inertia-viscous regime where Fedorchenko, Wang, and Wang (2005); Roisman, Rioboo, and Tropea (2002) and an inertia-capillary regime where Bennett and Poulikakos (1993); Lagubeau et al. (2012). A single law has been derived to connect these two regimes Eggers et al. (2010), which has rationalized experiments for a wide range of and numbers Laan et al. (2014). Other scaling laws for with different exponents for and have been proposed Scheller and Bousfield (1995); Pasandideh-Fard et al. (1996); Mao, Kuhn, and Tran (1997); Chandra and Avedisian (1991); Vadillo et al. (2009); Ukiwe and Kwok (2005); Clanet et al. (2004), which include additional effects such as the substrate wettability. A detailed description of these different scaling laws can be found in the recent review by Josserand and ThoroddsenJosserand and Thoroddsen (2016). However, none of these scaling laws describe at the low impact speeds as they predict as , which is not true for any case with an equilibrium contact angle . To mitigate this artifact the maximum spreading radius for has been included into the analysis that agrees favorably with experimental data for both low and high impact speedsLee et al. (2015), where is an ad-hoc fitting parameter.
Substrate roughness is another parameter that can influence the droplet impact dynamicsKannan and Sivakumar (2008); Vaikuntanathan and Sivakumar (2016); Lee et al. (2016); Tsai et al. (2009); van der Veen et al. (2014). Droplet impact on regular micro-textured substratesKannan and Sivakumar (2008); Vaikuntanathan and Sivakumar (2016); Robson and Willmott (2016) show that is influenced by the substrate topography. Even a substrate with small aspect ratio roughness hinders droplet spreading Lee et al. (2016), although the effect becomes less pronounced.
In this work we focus on describing and in the regime of non-splashing dropletsYarin (2006); Josserand and Thoroddsen (2016) i.e. small and intermediate impact speed. We show that as in a spontaneous droplet spreading processCarlson, Do-Quang, and Amberg (2011); Carlson, Bellani, and Amberg (2012), a detailed description of the physical processes at the contact line must be included to accurately describe the interface dynamics. Numerical experiments based on the phase field method and the Navier Stokes equations show that friction local to the contact line limits the dynamics and generates a significant dissipation. We treat the contact line friction parameter as a material property for each combination of air-liquid-solid, which should be independent of the impact speed. We determine the magnitude of by directly comparing the numerical simulations with several independent experiments (Pasandideh-Fard et al., 1996; Laan et al., 2014; Lee et al., 2015, 2016; Vaikuntanathan and Sivakumar, 2016). Our assumption of linear response through a Stokes-like drag at the contact line shows that the simulations can accurately reproduce experimental observations. We further extend our analysis to rough substrates and rationalize the differences in the dynamics compared with smooth substrates. Finally, we show that the regime where the principal dissipation is local to the contact line is described by a scaling law based on the contact line friction parameter .
I.1 Models and Methods
We describe the multiphase system by using the phase field method Jacqmin (1999), which considers the two binary phases (gas liquid) as a mixture. The mathematical model is composed of the Cahn-Hilliard equation Cahn and Hilliard (1958) Eq.(1,2), which is coupled with the Naiver-Stokes equations Eq.(3,4) for an incompressible fluid flowJacqmin (1999);
| (1) |
| (2) |
| (3) |
| (4) |
is an order parameter that varies smoothly from (gas) to (liquid) between the two immiscible phases and indicates that the interfacial region that has a finite thickness . is the chemical potential, given by the variation of the systems postulated free energy that has an interfacial and bulk free energy term. The free energy is required to reduce with time i.e. and is the mobility factor that controls the interfacial diffusion. is the velocity, is the pressure, whereas the density and the viscosity are interpreted as function of . The air surrounding the droplet is assumed at atmospheric pressure with a density and a viscosity . The material properties of the droplet, along with the impact speeds, equilibrium contact angles and range of simulated numbers and numbers are listed in Table 1.
All simulations are performed with a no-slip boundary condition for the velocities at the solid substrate () and all other boundaries are assumed to be in contact with ambient air at constant pressure () and with no-flux of the chemical potential ( with as the boundary normal). To model the contact line dynamics we use the non-equilibrium boundary conditionJacqmin (2000),
| (5) |
where is interpreted as a friction factor at the contact line and provides a transition for the dry (gas-solid) or wet (liquid-solid) substrate surface tension. For we assume local equilibrium at the contact line and the interface adopts the equilibrium contact angle , but if the contact angle becomes dynamic and allowed to deviate from .
We use the following scaling; to make Eq.(1)-Eq.(5) non-dimensional, where the superscript denotes non-dimensional variables. In addition to the Reynolds number four non-dimensional numbers appear in the equations; the Capillary number gives the ratio of the viscous force to the surface tension force, the non-dimensional friction parameter gives the ratio of the contact line friction force to the surface tension force, the Cahn number gives the ratio of the interface thickness and the droplet radius, and the Péclet number gives the ratio of advection to diffusion. Both and are fixed in all of our simulations such that the results satisfy the sharp interface criterion(Yue, Zhou, and Feng, 2010; Magaletti et al., 2013), and . The contour line is interpreted as the droplet interface and used to extract and .
The numerical simulations are performed with FemLego(Amberg, Tönhardt, and Winkler, 1999), a symbolic finite element toolbox that solves partial differential equations. All simulations are performed in an axi-symmetric coordinate system where the domain extends in the direction and in the direction. An adaptive mesh refinement method is used to enable a high resolution of the interface with a minimum mesh size of , which resolves the interface with cells. The droplet’s center of mass is initialized at a height from the solid substrate and the dynamic contact angle is measured at a height of using linear interpolation along similar to the method used to in the experimental analysis that we are directly comparing againstLee et al. (2015).
The phase field method has previously been used with success to simulate droplet impact dynamics(Khatavkar et al., 2007; Zhang, Qian, and Wang, 2016) to quantify the early spreading and bubble entrapment, in accordance with experimental observationsWang, Do-Quang, and Amberg (2016). However, none of these account for a dynamic contact angle treatment in Eq.(5) with or quantify the maximum spreading radius of the droplet, which we will show are two intertwined processes needed to rationalize the impact dynamics of droplets on smooth and rough solid substrates.
| water | 1000 | 0.001 | 0.073 | 1 | 0.28-4.85 | 61,90,94,130 | 320- | 0.6-664 |
| glycerol-water | 1158 | 0.01 | 0.068 | 0.92 | 0.19-9.28 | 52 | 40-1956 | 1-2653 |
II Results and discussions
II.1 Droplet impact on smooth substrate
Phase field simulations of droplets that spontaneously spread onto a solid substrate has shown that in order to accurately describe the contact line dynamics a local dissipation by using in Eq.5 is requiredCarlson, Bellani, and Amberg (2012). The mathematical form of Eq.5 comes from the assumption of linear response with a reduction of the free energy in time, and can be interpreted as a Stokes-like drag at the contact line. We interpret this wall-interface friction parameter as a physical property that depends on the combination of the gas-liquid-solid. We hypothesize that parts of the parameter space that compose the droplet impact dynamics can only be described with an accurate local treatment of the dynamic contact angle through .
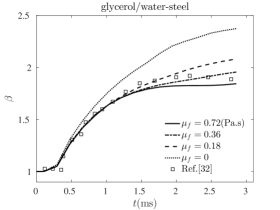
Since is not known a-priori we determine its magnitude by directly comparing simulations with experiments(Pasandideh-Fard et al., 1996; Lee et al., 2015), where is identified as the best-match with (see Fig.2). Our simulations of droplets of water and glycerol-water mixture show that clearly affects the spreading dynamics as well as the shape of the droplet. For water droplets on steel , while increasing its viscosity by introducing glycerol () also increases . These magnitudes for are in accordance with previous measurements on spontaneous spreading droplets ()Carlson, Bellani, and Amberg (2012). Our simulations clearly show that controls the time scale for to approach the equilibrium angle, where is the droplets apparent contact angle, see Fig.2(b,d). It is noteworthy that the assumption of local equilibrium, i.e. equilibrium contact angle, over-predicts the spreading factor and its maximum for both liquids. Thus, to obtain agreement between the simulations and experiments we need to account for dissipation at the contact line and the local equilibrium assumption fails to capture the spatiotemporal droplet dynamics, see Fig.2(b,d).
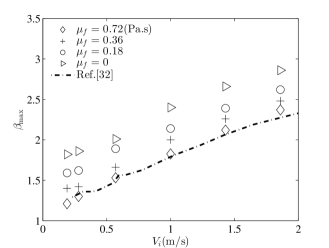
After determining (Table 2) from an experiment for one impact speed , we now assume to be a constant material parameter that must be independent of .
| (Pas) | |||
|---|---|---|---|
| glycerol/water-steel | 52∘ | 0.72 | Ref.[32] |
| water-stainless steel | 90∘ | 0.08 | Ref.[25] |
| water-steel | 61∘ | 0.52 | Ref.[32] |
| water-aluminium | 94∘ | 0.08 | Ref.[35] |
We challenge our hypothesis that is unique for a specific air-liquid-solid combination by directly comparing our simulations with experiments (Lee et al., 2015, 2016) for different . It is clear that as we increase the droplets aspect ratio i.e. maximum height divided by , decreases at . The simulated droplet shapes are in very good agreement with the experiments at , where the difference in profiles (Fig.3(a) and (c-d)) is caused by the experimental side-view photos. Since the simulations show a slice through the droplet, they represent its actual shape. The dash-dot lines in panels to the right in Fig.3 illustrate how the shape of the droplet would look if we instead would have made a side-view image. Our simulations also capture the entrapment of an air bubble at the symmetry axis at the wall, as seen in Fig.3(a-c).

It is clear that needs to be determined individually for each air-liquid-substrate combination. A too small value for causes an over-prediction of , while a too large value for causes an under-prediction of , see Fig.4. We want to highlight that the value for determined from a single experiment is also the best-fit for a range of impact speeds and shows that is not a function of .
II.2 Droplet impact on textured substrates
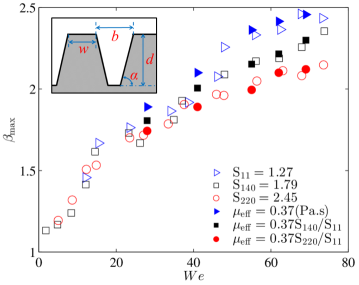
Another parameter that can influence droplet spreading upon impact is the substrate topography(Vaikuntanathan and Sivakumar, 2016; Robson and Willmott, 2016). For spontaneous spreading of droplets () the friction factor has already been shown to rationalize spreading dynamics on rough substrates where the magnitude of depends on the substrate roughness factor (). To test if our description of the contact line dynamics can provide a universal framework that can effectively bridge impact dynamics on smooth and rough substrates, we test the relation for the effective contact line friction parameter (Wang et al., 2015), having already estimated the value for for the smooth substrate. The geometry of the textured substrate gives the following roughness factor,
| (6) |
which is the ratio of the real area and projected area of the substrate. are geometric parameters describing the grooved substrate, see inset in Fig.5. If the contact line friction parameter is known for the corresponding flat substrate, the effective friction can easily be determined once the geometry of the micro-textured substrate is known.
We compare our simulations with experiments on substrates that have grooves along one direction with different aspect ratios. In Fig.5 the effective contact line friction parameter is determined by matching the experimental data for the TS11 substrate(Vaikuntanathan and Sivakumar, 2016) with a roughness factor , where we test the relation (Wang et al., 2015) for the substrates TS140 () and TS220 ()(Vaikuntanathan and Sivakumar, 2016). Although our assumption of axial-symmetry is slightly violated in the experiments, the linear relationship between and rationalizes for the spreading perpendicular to the grooves. This is also believed to be the primary cause for the difference in found for a water droplet impacting on the smooth () and textured () stainless steel substrate.
II.3 Energy budget
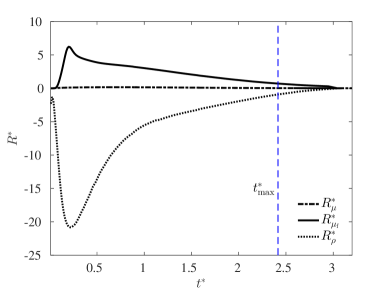
Our results show that the local interface-wall contact line friction can affect the droplet impact dynamics, and we want next to determine its dissipative contribution and to compare it against the other primary contributions in the energy budget. To do this, we extract the different rates of energy and dissipations, where the principal contributions are; the rate of change of kinetic energy , the rate of viscous dissipation , and the rate of contact line dissipation . is here the entire volume and is the substrate area. In the droplet impact dynamics we observe that at early times the magnitude of decreases rapidly, while on the other hand increases, see Fig.6. A minimum in and a maximum in take place at , whereas both slowly approach zero as the velocities decrease. Surprisingly, viscous dissipation appears to not play an important role in this regime as both and are much larger for .
II.4 Scaling laws for
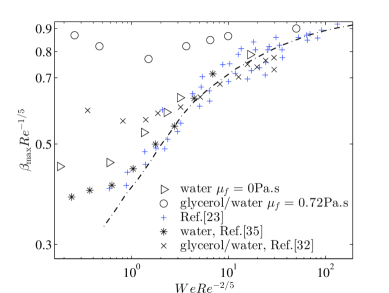
Since our simulations fall into both the inertia-viscous and the inertia-capillary regime, we can further test if our numerical simulations are also consistent with existing scaling laws. We compare our numerical data for (Fig.7a) and the measured (Fig.7b) with another set of independent experimental dataLaan et al. (2014) for impacting droplets of different fluids. We use the scaling law for that couples the inertia-viscous and inertia-capillary regime(Eggers et al., 2010; Laan et al., 2014) and illustrated by the line in Fig.7. We see in Fig.7(a) that creates results that deviate from the scaling law and the experiments. One exception is the simulations of water droplets, this is not surprising as the Reynolds number for water is ten times larger than for the glycerol-water mixture and inertial effects are therefore much more dominant. Including the effect of contact line dissipation by using the values for determined in Fig.2,4 makes the simulated data for fit well with the scaling law and the experiments. However, it is clear that for the regime where the effect from is expected to be important i.e. , both the experiments and the simulations deviate from the existing scaling law.
To improve the scaling prediction for we include the influence from the contact line dissipation into the approximation for the energy balance,
| (7) |
with the contact line speed defined as . Note that the contact line dissipation is independent of the interface thickness and can be re-writtenCarlson, Do-Quang, and Amberg (2011) as with as the radial position of the contact line. is the droplet surface area and the last term on the right hand side of Eq.7 is the rate of change of droplet surface energy. Based on the approximated energy balance we assume the following scaling relationsJosserand and Thoroddsen (2016) for a droplet that has spread to and has a height ; , , , , , , . In addition mass conservation of the incompressible droplet demands that its volume remains constant and that . By introducing these scaling relations into Eq.7 we get the following expressions:
| (8) |
Now substituting these scaling relations into Eq.(7) and rearranging the terms give as a function of the contact line friction parameter ,
| (9) |
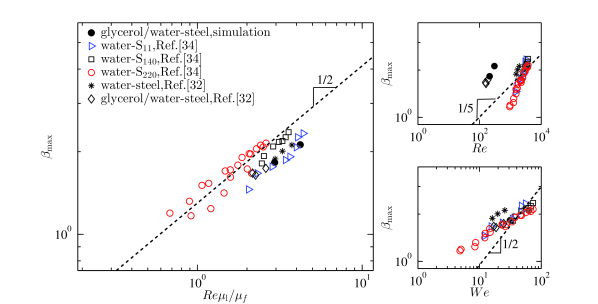
Three separate regimes appear, where we immediately see that the two limits () and () recovers the classical scaling laws. However, we identify a new regime for small and intermediate impact speeds i.e. with .To test this new scaling law we plot the data for from the simulations and experiments, which follows , see Fig.8(a), instead of or , see Fig.8(b,c).
III Conclusions
We have investigated the dynamics of droplets impacting onto solid substrates as a function of their viscosity, substrate wettability and substrate topography by deploying numerical simulations. By assuming linear response through a Stokes-like drag at the contact line, our simulations rationalize experimental observations for droplet impact on both smooth and rough substrates. Our results highlight that at low impact speeds the dissipation at the contact line needs to be included to predict the droplet spreading dynamics. We propose a scaling relation for this regime that is dominated by contact line dissipation , complementing the classical scaling laws for i.e. and that are also identified in the numerical simulations. Moreover, our simulations highlight the link between substrate roughness and the effective contact line friction factor that can provide a unifying framework to describe droplet impact dynamics.
References
- Dykhuizen (1994) R. Dykhuizen, “Review of impact and solidification of molten thermal spray droplets,” Journal of Thermal Spray Technology 3, 351–361 (1994).
- Attinger, Zhao, and Poulikakos (2000) D. Attinger, Z. Zhao, and D. Poulikakos, “An experimental study of molten microdroplet surface deposition and solidification: transient behavior and wetting angle dynamics,” Journal of Heat Transfer 122, 544–556 (2000).
- Fathi, Dickens, and Fouchal (2010) S. Fathi, P. Dickens, and F. Fouchal, “Regimes of droplet train impact on a moving surface in an additive manufacturing process,” Journal of Materials Processing Technology 210, 550–559 (2010).
- Bergeron et al. (2000) V. Bergeron, D. Bonn, J. Y. Martin, and L. Vovelle, “Controlling droplet deposition with polymer additives,” Nature 405, 772–775 (2000).
- Mehdizadeh, Chandra, and Mostaghimi (2004) N. Z. Mehdizadeh, S. Chandra, and J. Mostaghimi, “Formation of fingers around the edges of a drop hitting a metal plate with high velocity,” Journal of Fluid Mechanics 510, 353–373 (2004).
- Mandre, Mani, and Brenner (2009) S. Mandre, M. Mani, and M. P. Brenner, “Precursors to splashing of liquid droplets on a solid surface,” Physical Review Letters 102, 134502 (2009).
- Duchemin and Josserand (2011) L. Duchemin and C. Josserand, “Curvature singularity and film-skating during drop impact,” Physics of Fluids (1994-present) 23, 091701 (2011).
- Kolinski et al. (2012) J. M. Kolinski, S. M. Rubinstein, S. Mandre, M. P. Brenner, D. A. Weitz, and L. Mahadevan, “Skating on a film of air: drops impacting on a surface,” Physical Review Letters 108, 074503 (2012).
- Bouwhuis et al. (2012) W. Bouwhuis, R. C. van der Veen, T. Tran, D. L. Keij, K. G. Winkels, I. R. Peters, D. van der Meer, C. Sun, J. H. Snoeijer, and D. Lohse, “Maximal air bubble entrainment at liquid-drop impact,” Physical Review Letters 109, 264501 (2012).
- Liu, Tan, and Xu (2013) Y. Liu, P. Tan, and L. Xu, “Compressible air entrapment in high-speed drop impacts on solid surfaces,” Journal of Fluid Mechanics 716, R9 (2013).
- Visser et al. (2015) C. W. Visser, P. E. Frommhold, S. Wildeman, R. Mettin, D. Lohse, and C. Sun, “Dynamics of high-speed micro-drop impact: numerical simulations and experiments at frame-to-frame times below 100 ns,” Soft matter 11, 1708–1722 (2015).
- Li and Thoroddsen (2015) E. Li and S. T. Thoroddsen, “Time-resolved imaging of a compressible air disc under a drop impacting on a solid surface,” Journal of Fluid Mechanics 780, 636–648 (2015).
- Driscoll and Nagel (2011) M. M. Driscoll and S. R. Nagel, “Ultrafast interference imaging of air in splashing dynamics,” Physical Review Letters 107, 154502 (2011).
- Yokoi (2011) K. Yokoi, “Numerical studies of droplet splashing on a dry surface: triggering a splash with the dynamic contact angle,” Soft Matter 7, 5120–5123 (2011).
- Visser et al. (2012) C. W. Visser, Y. Tagawa, C. Sun, and D. Lohse, “Microdroplet impact at very high velocity,” Soft matter 8, 10732–10737 (2012).
- Riboux and Gordillo (2014) G. Riboux and J. M. Gordillo, “Experiments of drops impacting a smooth solid surface: A model of the critical impact speed for drop splashing,” Physical Review Letters 113, 024507 (2014).
- Xu, Zhang, and Nagel (2005) L. Xu, W. W. Zhang, and S. R. Nagel, “Drop splashing on a dry smooth surface,” Physical Review Letters 94, 184505 (2005).
- Fedorchenko, Wang, and Wang (2005) A. I. Fedorchenko, A.-B. Wang, and Y.-H. Wang, “Effect of capillary and viscous forces on spreading of a liquid drop impinging on a solid surface,” Physics of Fluids (1994-present) 17, 093104 (2005).
- Roisman, Rioboo, and Tropea (2002) I. V. Roisman, R. Rioboo, and C. Tropea, “Normal impact of a liquid drop on a dry surface: model for spreading and receding,” in Proceedings of the Royal Society of London A: Mathematical, Physical and Engineering Sciences, Vol. 458 (The Royal Society, 2002) pp. 1411–1430.
- Bennett and Poulikakos (1993) T. Bennett and D. Poulikakos, “Splat-quench solidification: estimating the maximum spreading of a droplet impacting a solid surface,” Journal of Materials Science 28, 963–970 (1993).
- Lagubeau et al. (2012) G. Lagubeau, M. A. Fontelos, C. Josserand, A. Maurel, V. Pagneux, and P. Petitjeans, “Spreading dynamics of drop impacts,” Journal of Fluid Mechanics 713, 50–60 (2012).
- Eggers et al. (2010) J. Eggers, M. A. Fontelos, C. Josserand, and S. Zaleski, “Drop dynamics after impact on a solid wall: theory and simulations,” Physics of Fluids (1994-present) 22, 062101 (2010).
- Laan et al. (2014) N. Laan, K. G. de Bruin, D. Bartolo, C. Josserand, and D. Bonn, “Maximum diameter of impacting liquid droplets,” Physical Review Applied 2, 044018 (2014).
- Scheller and Bousfield (1995) B. L. Scheller and D. W. Bousfield, “Newtonian drop impact with a solid surface,” AIChE Journal 41, 1357–1367 (1995).
- Pasandideh-Fard et al. (1996) M. Pasandideh-Fard, Y. Qiao, S. Chandra, and J. Mostaghimi, “Capillary effects during droplet impact on a solid surface,” Physics of Fluids (1994-present) 8, 650–659 (1996).
- Mao, Kuhn, and Tran (1997) T. Mao, D. Kuhn, and H. Tran, “Spread and rebound of liquid droplets upon impact on flat surfaces,” AIChE Journal 43, 2169–2179 (1997).
- Chandra and Avedisian (1991) S. Chandra and C. Avedisian, “On the collision of a droplet with a solid surface,” in Proceedings of the Royal Society of London A: Mathematical, Physical and Engineering Sciences, Vol. 432 (The Royal Society, 1991) pp. 13–41.
- Vadillo et al. (2009) D. Vadillo, A. Soucemarianadin, C. Delattre, and D. Roux, “Dynamic contact angle effects onto the maximum drop impact spreading on solid surfaces,” Physics of Fluids (1994-present) 21, 122002 (2009).
- Ukiwe and Kwok (2005) C. Ukiwe and D. Y. Kwok, “On the maximum spreading diameter of impacting droplets on well-prepared solid surfaces,” Langmuir 21, 666–673 (2005).
- Clanet et al. (2004) C. Clanet, C. Béguin, D. Richard, and D. Quéré, “Maximal deformation of an impacting drop,” Journal of Fluid Mechanics 517, 199–208 (2004).
- Josserand and Thoroddsen (2016) C. Josserand and S. Thoroddsen, “Drop impact on a solid surface,” Annual Review of Fluid Mechanics 48, 365–391 (2016).
- Lee et al. (2015) J. Lee, N. Laan, K. de Bruin, G. Skantzaris, N. Shahidzadeh, D. Derome, J. Carmeliet, and D. Bonn, “Universal rescaling of drop impact on smooth and rough surfaces,” Journal of Fluid Mechanics 786, R4 (2015).
- Kannan and Sivakumar (2008) R. Kannan and D. Sivakumar, “Drop impact process on a hydrophobic grooved surface,” Colloids and Surfaces A: Physicochemical and Engineering Aspects 317, 694–704 (2008).
- Vaikuntanathan and Sivakumar (2016) V. Vaikuntanathan and D. Sivakumar, “Maximum spreading of liquid drops impacting on groove-textured surfaces: Effect of surface texture,” Langmuir 32, 2399–2409 (2016).
- Lee et al. (2016) J. B. Lee, D. Derome, R. Guyer, and J. Carmeliet, “Modeling the maximum spreading of liquid droplets impacting wetting and nonwetting surfaces,” Langmuir 32, 1299–1308 (2016).
- Tsai et al. (2009) P. Tsai, S. Pacheco, C. Pirat, L. Lefferts, and D. Lohse, “Drop impact upon micro-and nanostructured superhydrophobic surfaces,” Langmuir 25, 12293–12298 (2009).
- van der Veen et al. (2014) R. C. van der Veen, M. H. Hendrix, T. Tran, C. Sun, P. A. Tsai, and D. Lohse, “How microstructures affect air film dynamics prior to drop impact,” Soft matter 10, 3703–3707 (2014).
- Robson and Willmott (2016) S. Robson and G. R. Willmott, “Asymmetries in the spread of drops impacting on hydrophobic micropillar arrays,” Soft matter 12, 4853–4865 (2016).
- Yarin (2006) A. Yarin, “Drop impact dynamics: splashing, spreading, receding, bouncing ,” Annual Review of Fluid Mechanics 38, 159–192 (2006).
- Carlson, Do-Quang, and Amberg (2011) A. Carlson, M. Do-Quang, and G. Amberg, “Dissipation in rapid dynamic wetting,” Journal of Fluid Mechanics 682, 213–240 (2011).
- Carlson, Bellani, and Amberg (2012) A. Carlson, G. Bellani, and G. Amberg, “Contact line dissipation in short-time dynamic wetting,” EPL (Europhysics Letters) 97, 44004 (2012).
- Jacqmin (1999) D. Jacqmin, “Calculation of two-phase navier–stokes flows using phase-field modeling,” Journal of Computational Physics 155, 96–127 (1999).
- Cahn and Hilliard (1958) J. W. Cahn and J. E. Hilliard, “Free energy of a nonuniform system. i. interfacial free energy,” The Journal of chemical physics 28, 258–267 (1958).
- Jacqmin (2000) D. Jacqmin, “Contact-line dynamics of a diffuse fluid interface,” Journal of Fluid Mechanics 402, 57–88 (2000).
- Yue, Zhou, and Feng (2010) P. Yue, C. Zhou, and J. J. Feng, “Sharp-interface limit of the cahn–hilliard model for moving contact lines,” Journal of Fluid Mechanics 645, 279–294 (2010).
- Magaletti et al. (2013) F. Magaletti, F. Picano, M. Chinappi, L. Marino, and C. M. Casciola, “The sharp-interface limit of the cahn–hilliard/navier–stokes model for binary fluids,” Journal of Fluid Mechanics 714, 95–126 (2013).
- Amberg, Tönhardt, and Winkler (1999) G. Amberg, R. Tönhardt, and C. Winkler, “Finite element simulations using symbolic computing,” Mathematics and Computers in Simulation 49, 257–274 (1999).
- Khatavkar et al. (2007) V. Khatavkar, P. Anderson, P. Duineveld, and H. Meijer, “Diffuse-interface modelling of droplet impact,” Journal of Fluid Mechanics 581, 97–127 (2007).
- Zhang, Qian, and Wang (2016) Q. Zhang, T.-Z. Qian, and X.-P. Wang, “Phase field simulation of a droplet impacting a solid surface,” Physics of Fluids (1994-present) 28, 022103 (2016).
- Wang, Do-Quang, and Amberg (2016) Y. Wang, M. Do-Quang, and G. Amberg, “Events and conditions in droplet impact: a phase eld prediction,” International Journal of Multiphase Flow 87, 54–65 (2016).
- Wang et al. (2015) J. Wang, M. Do-Quang, J. J. Cannon, F. Yue, Y. Suzuki, G. Amberg, and J. Shiomi, “Surface structure determines dynamic wetting,” Scientific reports 5, 10–11 (2015).