∎
Modelling the proliferation of transposable elements in populations under environmental stress.††thanks: The work was supported by National Science Centre, grant no. 2012/06/M/ST6/00438
Abstract
Although transposable elements were discovered in the middle of the 20
century and are known as one of the main genome components, their impact on genome evolution has not been fully elucidated yet.
However, it was so far shown that mutations induced by transposition events
can lead to significant genetic disorders and affect an organism’s phenotype. Furthermore,
since every mutation can also be beneficial, the natural question that arises is whether under certain
conditions the activity of TEs can be considered as an evolutionary helper i.e. a mechanism that has positive
contribution to the evolution of a population.
In this article, we investigate the evolution of sexual diploid populations which are
hosts for active TE families. Our purpose is to explore the relationship between the environmental change, that
influences such population and activity of those TEs that are present in genomes.
Based on results obtained from the stochastic computational model, we conclude that in presence of
progressive environmental change the activity of TEs, and specifically mutations that are mediated
by their activity, can noticeably facilitate the process of adaptation to varying conditions and
prevent the population from extinction.
1 Introduction
Current models in evolutionary quantitative genetics describe convincingly how populations and species respond to artificial or natural selection from their standing genetic variation Lynch and Walsh, (1998); Roff, (1997); Charlesworth and Charlesworth, (2010). However, deciphering the mechanisms involved in the evolutionary properties of the genetic variation itself is more challenging, up to the point that a theory of the evolution of evolvability is often presented as a major piece of a potential new evolutionary synthesis Kirschner and Gerhart, (1998); Brookfield, (2001); Pigliucci, (2007); Pigliucci et al., (2010).
Populations’ evolvability is fuelled by mutations. The rate at which mutations occur is known to vary by several orders of magnitude across organisms Drake et al., (1998); Lynch, (2007); Baer et al., (2007). Furthermore, multiple independent examples of spontaneous evolution of different mutation rates in the wild or in lab conditions Giraud et al., (2001); Denamur and Matic, (2006) confirm that the mutation rate of an individual is a variable phenotypic trait susceptible to be targetted by natural selection.
Most mutations being deleterious, individuals harboring a "mutator" allele leading to a high mutation rate are unlikely to be favored by natural selection. However, in a continuously variable environment, a nil mutation rate necessarily drives species to extinction. Population genetics theory has thus focused on estimating equilibrium mutation rates, resulting from a balance between natural selection against deleterious mutations, driving mutation rates downwards, and mechanisms pulling mutation rates upwards, including the metabolic cost of DNA proof-reading, and a hypothetical – but outstandingly interesting – selection force towards increased evolvability Sturtevant, (1937); Leigh Jr, (1970); Johnson, 1999a ; André and Godelle, (2006); Wylie et al., (2009). Selection for large mutation rates is essentially indirect (it is not adaptive per se) Weber, (1996); Sniegowski et al., (2000), and strongly depends on the recombination rate between mutator alleles and potentially-beneficial mutations: when such a positive-effect mutation occurs, its frequency will increase in the population, hence hitch-hiking the genetically-linked mutator. This mechanism is effective in low-recombination asexual organisms Tenaillon et al., (1999); Orr, (2000), whereas recurrent crossovers makes adaptive evolution of high mutation rates unlikely in sexual organisms Kimura, (1967); Leigh Jr, (1973); Baer et al., (2007); Lynch, (2008), although the equilibrium rate might be non-zero Ishii et al., (1989); Johnson, 1999b .
Yet, mutation rates in sexual multicellular eukaryotes tend to be higher than in asexuals, suggesting that genetic drift, genetic constraints, and external factors, rather than adaptation, are the main drivers of evolution of mutational evolvability in large organisms Lynch, (2008). In particular, a substantial part of genomic mutations can be attributed to the presence and the activity of Transposable Elements (TEs), which are self-replicating DNA sequences that can be found in the genome of virutally all organisms. Initially described as adaptive "controlling elements" (see McClintock, (1984) for a full historical record), the deleterious consequences of TEs lead population geneticists to explain their ubiquity by their "selfish DNA" properties Orgel and Crick, (1980); Doolittle and Sapienza, (1980). Theoretical models confirmed that thanks to their intrinsic amplification ability, TEs are efficient genomic parasites of sexually-reprodcing organisms, able to invade populations and genomes in spite of an average deleterious effect Hickey, (1982); Charlesworth and Charlesworth, (1983); Le Rouzic and Capy, (2005).
TEs generate a broad spectrum of mutations, including gene disruptions, changes in regulation or alternative splicing patterns, recombinations, inversions, and segmental duplications or deletions. Most of these mutations are expected to be deleterious or neutral, but a few of them are likely to change the phenotype in an adaptive way, and be fixed by natural selection. Although this does not contradict the selfish DNA hypothesis as the primordial explanation for TE universality, the accumulation of empirical evidence for "domesticated" TE-related copies Miller et al., (1999); Sinzelle et al., (2009) has generated a great deal of confusion about the cause-consequence relationship between TE activity and the associated increase in evolvability Capy et al., (2000). As a matter of fact, little is known about the quantitative and qualitative consequences of introducing the possibility of beneficial mutations in TE theoretical dynamic models.
In asexuals, TEs cannot spread as selfish DNA sequences, and theory confirms that their potential mutator effect can explain their presence Sawyer and Hartl, (1986); McFadden and Knowles, (1997); Martiel and Blot, (2002); Edwards and Brookfield, (2003); McGraw and Brookfield, (2006); Startek et al., (2013), along with recurrent horizontal transfers Moody, (1988); Basten and Moody, (1991); Bichsel et al., (2010). In sexual organisms, unconditional beneficial insertions seems to extend the time during which a TE family can maintain in a genome, but these copies are quicky inactivated by mutations and thus no longer participate to the TE dynamics Le Rouzic et al., (2007); Boutin et al., (2012). Virtually nothing is known about how such TEs affect the evolvability of the host species.
With this paper, we aim at exploring the impact of transposable elements as mutators in sexual populations in constant and variable environments, using an explicit phenotype-fitness landscape based on the Fisher geometric model Fisher, (1930) with a moving optimum.
2 Methods
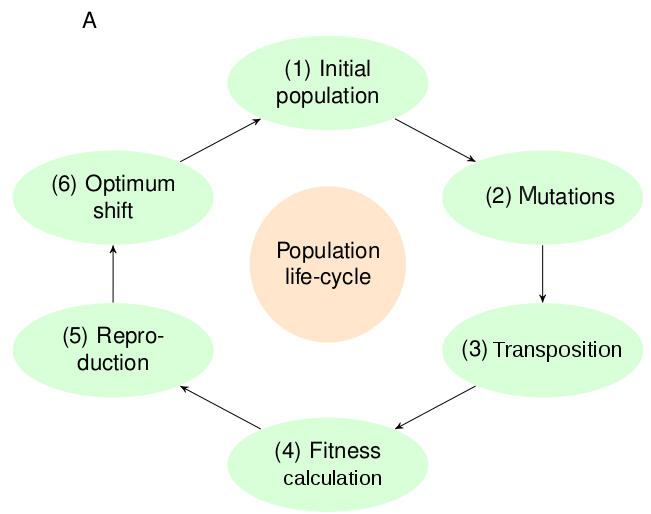
We introduce a stochastic computational model that investigates the evolutionary dynamics of diploid populations of size . Our main interest is focused on TEs activity, their influence on organism’s phenotype and as a result on its fitness and adaptive abilities. Figure 1A summarizes main stages that a population will follow in each generation.
 |
 |
2.1 Genotype - phenotype model
Our framework is based on the Fisher’s Geometric Model (FGM) Fisher, (1930) with moving optimum Kopp and Hermisson, (2009). Each organism is represented by a phenotype , which is represented as a real-valued, -dimensional vector describing independent phenotypic traits. In accordance with the FGM, an organism corresponds to a point in -dimensional phenotypic space and each mutation changes its position by a -dimensional vector drawn from the -dimensional, multivariate centered normal distribution . Here, is an identity matrix of size , which expresses the assumption that mutations are fully isotropic and also determines a yardstick in our model, as the variance of mutational effects, . The phenotype itself has two components: (1) the base phenotype which is modeled as diploid, one-locus genome with real-valued alleles. changes only due to genome (TE-unrelated) mutations; (2) the TE-related phenotype , which is a sum of the mutational effects of all TEs of an organism. As a result phenotype can be naturally expressed as . Both TE-related and TE-unrelated mutations are drawn from the same distribution. TE-unrelated mutations occur with a mutation rate (genomic mutation rate per generation), while TE-related mutations are directly related to TE activity (see below).
2.2 TEs dynamics
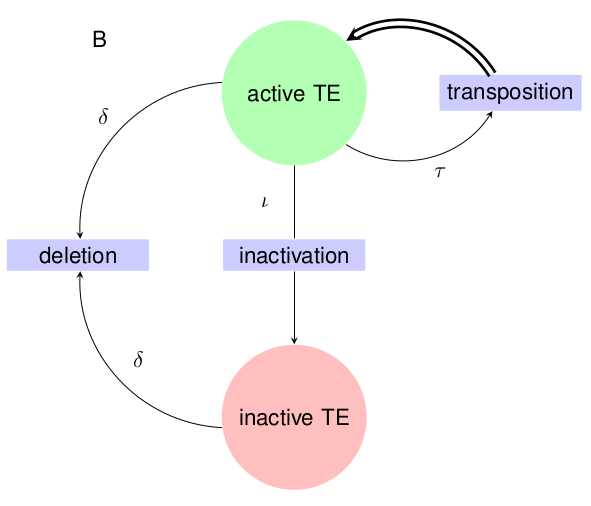
For each simulation, the initial population is composed of organisms hosting homozogous active TE copies. Each generation, TEs can undergo specific events (also see Figure 1B): (1) with a probability an active copy may transpose in a copy-paste manner, which results in an insertion of a new TE copy at some locus in a genome with a random mutational effect ; (2) with a probability an active copy may become inactive and lose its ability to transpose, but its mutational effect does not change; (3) with a probability (deletion rate) both active and inactive copies can get deleted from the genome. Along with this event the mutational effect is cancelled.
2.3 Fitness and sexual reproduction
We assume that the fitness function is multivariate normal and isotropic:
where is the relative fitness of an individual of (multivariate) phenotype , and is the Euclidian distance between the phenotype and the optimal phenotype . The variance of this Gaussian is inversely proportional to the strengh of stabilizing selection (selection disappears when ).
Sexual reproduction consists of picking two parents with a probability propotional to their fitness. Each organism creates a gamete, which contains: one allele from the genome and set of TEs that will be inherited. Gamete composition follows the Mendel’s inheritance rules and assumes genetic independence between loci. A new organism is created by merging both gametes. Its TE-related-phenotype is calculated by summing up the effects of all inherited TEs, and the base phenotype is equal to:
where is a random deviate related to the genetic segregation variance Bulmer, (1985), distributed as , where is the genetic variance in the parental population. We assumed that generations were not overlapping, and that the population size () was constant (soft selection).
2.4 Moving optimum
Environmental change was modelled as a slow, gradual shift in the phenotypic optimum: , where describes the speed of the environmental change. When , the optimum remains at its starting position (arbitrarily set at ), which corresponds to stabilizing selection.
2.5 Equilibrium state
In order to determine if the population is in the equilibrium state with respect to the TE copy number, we compute the slope of the regression line (i.e. we build a linear model predicting TE copy number from the last generations, basing on the generation number). We assume that equilibrium state is attained when the regression coefficient satisfies .
2.6 Simulations setting
| Parameter name | Notation | Selfish (S) | Non-Selfish (NS) | Selfish with Inactive (SI) | Non-Selfish with Inacitve (NSI) |
|---|---|---|---|---|---|
| Environmental parameters | |||||
| Population size | 2000 | ||||
| Number of generations | 10000 | ||||
| Number of phenotypic traits | 2 | ||||
| Selection strengtha | |||||
| Optimum changea | stab. sel. = / moving opt. = | ||||
| Genomic parameters | |||||
| Background mutation rateb | 0.003 | ||||
| Transposition ratec | 0.002 | ||||
| Deletion ratec | 0.0002 | 0.002 | 0.0002 | 0.002 | |
| Inactivation ratec | 0 | 0 | 0.002 | 0.002 | |
a some parameter values were chosen to ensure that simulations converge to an equilibrium state; b per genome and per generation; c per copy and per generation.
Individual-based simulations were performed in order to understand the complex behaviour of our model. Outcomes presenting individual results along with significant statistics were collected and can be visualized at http://bioputer.mimuw.edu.pl/TE-model. Additionally, the setting for main parameters that are investigated throughout the next section are presented and described in Table 1. Finally, in the next section we present exploration of the parameter space for different scenarios which was performed using the Monte Carlo sampling.
3 Results
Our main purpose is to understand the complex relationship between genotype, phenotype and fitness in the context of TE proliferation, within the framework of the FGM. We aim at describing the evolution of TE copy number along with fitness in sexual populations, especially when taking into account environmental change.
3.1 TE proliferation dynamics
The exploration of the parameter space was performed for both the stabilizing selection (i.e. the optimal phenotype in time is constant, ), and the moving optimum scenarios. At the very begining, the value of all parameters except the transposition rate () and the selection strength () were fixed (see Table 1) in order to determine ranges for and in which a transposition-selection equilibrium is attainable. The monte Carlo sampling, yielded three regions corresponding to different model behaviours (see Figure 2).
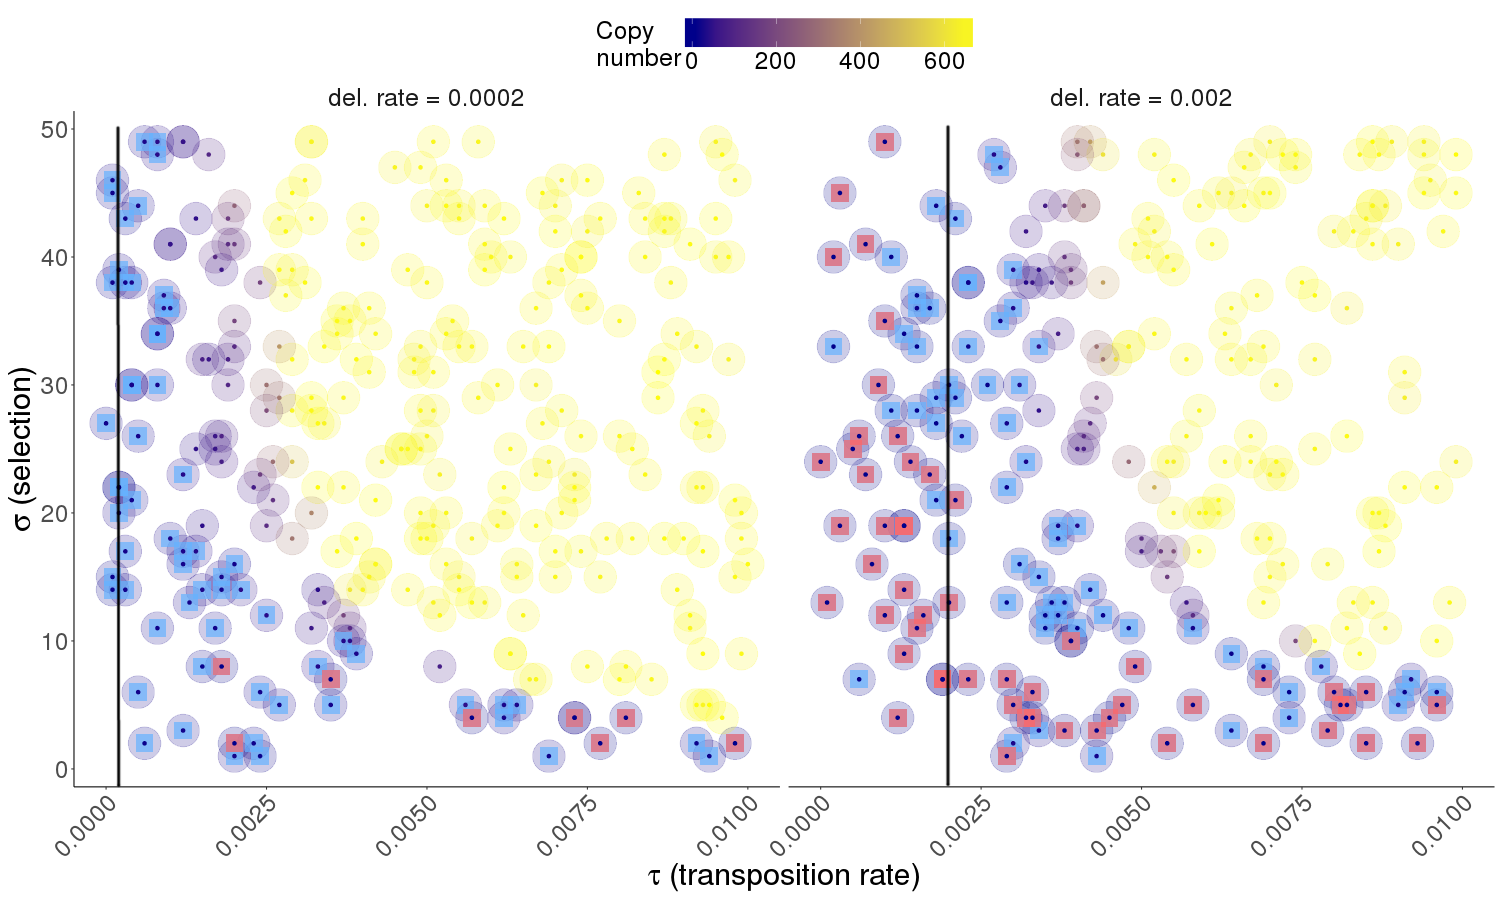 |
Note, selection gets weaker with increasing .
 |
The TE dynamics has been classified into three cases according to the variability in the last generations out of for each simulation: (i) uncontrolled increase (i.e. exponential growth), (ii) equilibrium in TE copy number, (iii) loss of all TEs.
Interestingly, the subset of parameters for which the model upholds a transposition-selection equilibrium is quite narrow . Very strong selection () reinforces the occurrence of TE maintenance in populations. Indeed, selection starts to promote the best reproducers very fast, which leads to homogenous population of homozygous organisms with fixed copy number. Loose selection () also allows easy maintenance of TEs, because the selective cost of TEs is moderate, preventing their elimination by natural selection. As the transposition-selection equilibrium has been of historical interest, especially in the early models, we picked for further investigation and an intermediate value of that lead to a stable polymorphic copy number under stabilizing selection.
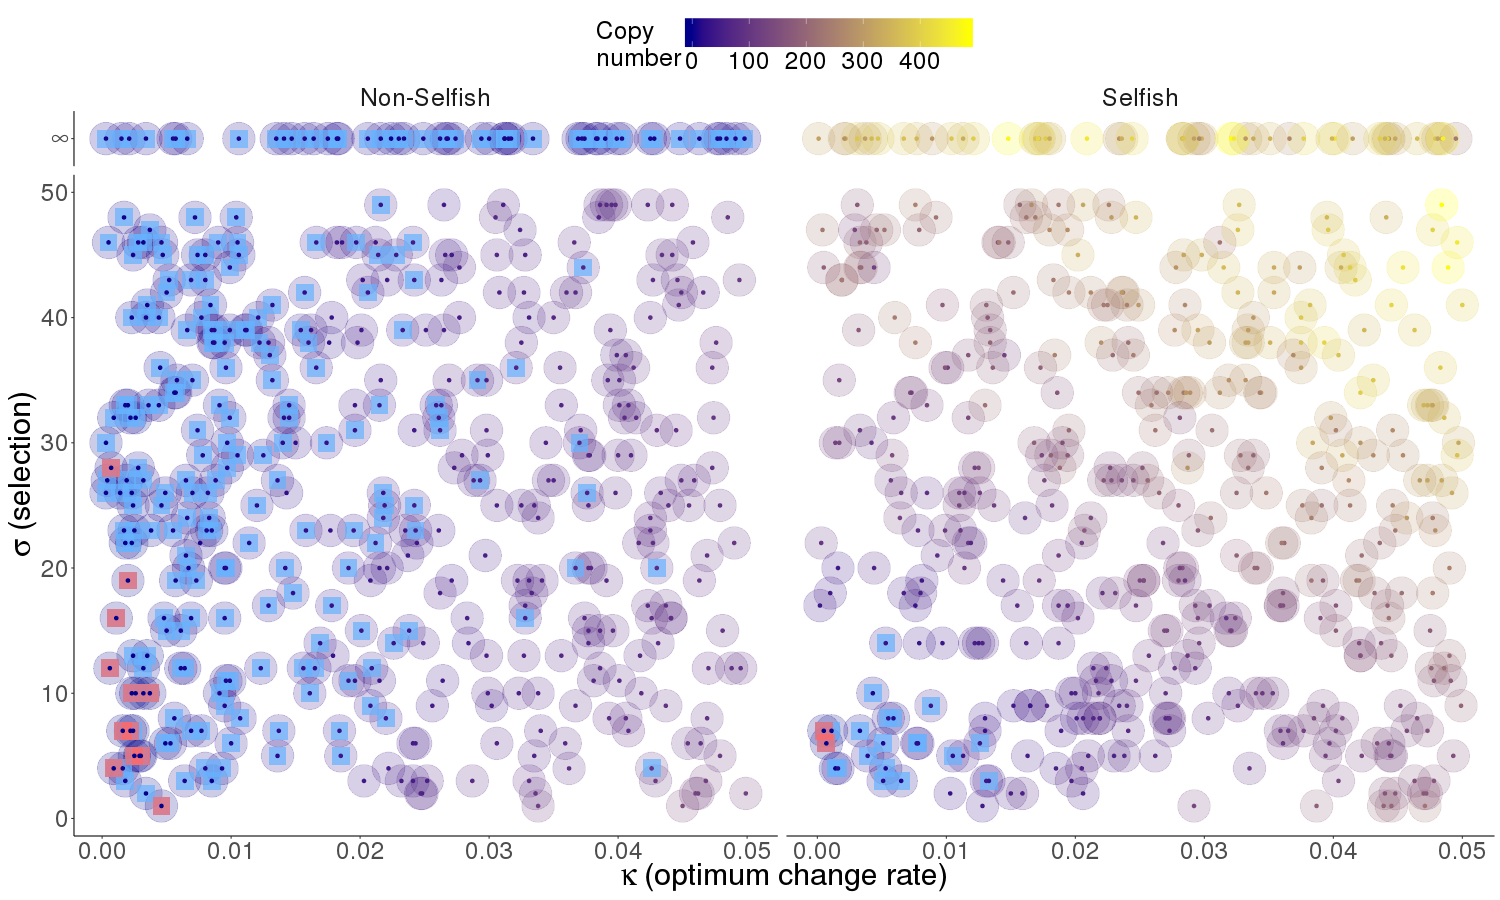
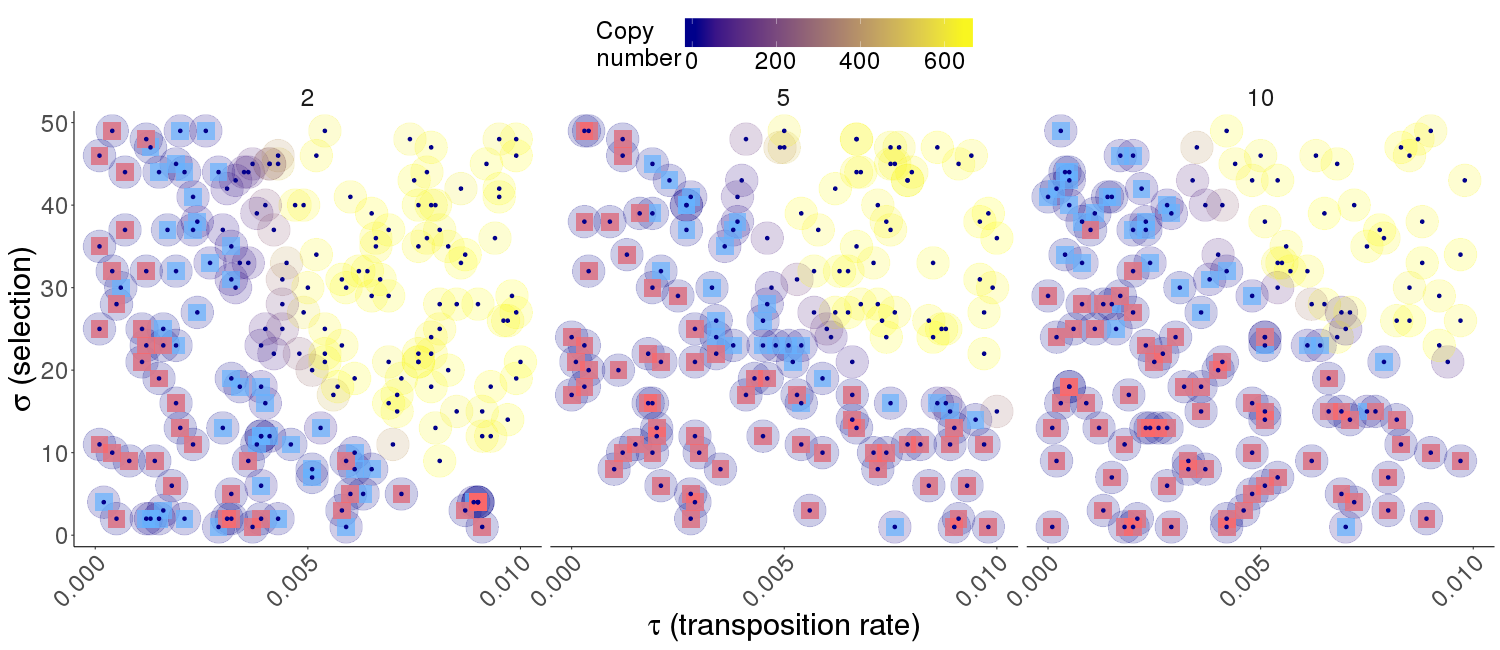
An analogous Monte Carlo sampling procedure has been performed for the moving optimum model. The parameter was fixed and we explored the subspace defined by and for meaningful ranges. These simulations were run with both non-selfish and selfish TEs, i.e. and , respectively. Figure 3 presents the different TE proliferation dynamics observed in the full parameter space along with mean fitness distribution in populations in question.
As the strength of natural selection against deleterious and beneficial TE insertions is the main driver of TE dynamics in our model, we investigated two important parameters influencing the probability of allele fixation: (i) the number of traits, which conditions the balance between beneficial and deleterious mutations, and (ii) the population size, which affects the probability of a mutation to be effectively neutral.
As mutations in the FGM affect all traits in an isotropic way, the probability that a specific mutation decrease the Euclidian distance to the phenotypic optimum decreases with the dimensionality of the phenotypic space Marimont and Shapiro, (1979). Increasing the number of phenotypic traits in the simulation is consistent with this theoretical expectation, as the transposition rate allowing TE maintenance increases accordingly (Figure 4). Further simulations were run with two phenotypic traits, the first trait being affected by the environmental change, while the second trait optimum remained constant.
 |
3.2 Active and inactive copies
Most copies in eukaryotic genomes are inactive (unable to transpose). Such copies do not impact the transposition dynamics directly, but their impact of the phenotype remains. Inactivation of the transposition ability of TE copies is thus likely to be an important phenomenon, as it cancels the mutagenic activity of beneficial TE insertions.
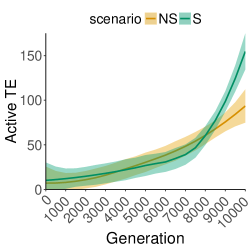
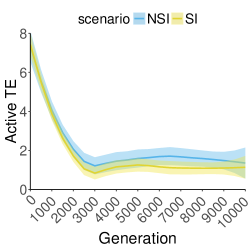
Inactive copies were introduced to the system by setting a mutation rate from active to inactive TE copies (). Two different deletion rates were considered ( and ). This settels four scenarios: (i) – selfish, transposition rate is one order of magnitude larger than deletion rate; (ii) – non-selfish, transposition rate and deletion rate are of the same order (here, equal); (iii) – selfish with possibility of transposon inactivation; (iv) – non-selfish with possibility of transposon inactivation.
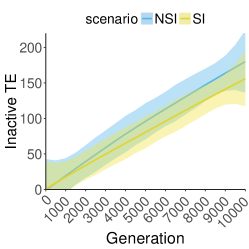
With inactive copies appear a new type of dynamics featuring a linear increase, which is a peculiar steady-state equilibrium. We know from Charlesworth et al., (1991) that neutral active copies cannot accumulate without increasing the genetic load, but inactive copies can. As one can observe on Figure 5, the introduction of inactive copies pushes active ones to the background and their number is usually on a very low but stable level, while inactive ones are slowly aggregating in a linear fashion.
 |
 |
 |
3.3 Non-linear models for average fitness
Our next goal was to investigate the complex link between adaptation, mutation rate, and the evolution of evolvability. One of the main differences between mutation rate and TE-driven mutations is the fact that the amplification ability of TEs (as selfish DNA) generates a natural trend towards an increase of the mutation rate, which is independent from adaptation. In this context, we focused on how model parameters (TE copy number, strength of selection and transposition rate (stabilizing selection scenario)/speed of environmental change (moving optimum scenario) affect the mean fitness of the population at equilibrium.
The mean fitness of the population has two major components: (i) the average distance of the population from the optimum (how well the population is adapted to its current environment), and (ii) how spread are the individuals in the population (featuring the population evolvability). Interestingly, in our moving optimum setting, these two properties merge as populations have reached a steady state (i.e. how well they are adapted to the current optimum measures the same thing as how well they will adapt to a new environment in the next generation). We thus propose to use the average fitness at steady state as a measurement of both adaptation and evolvability.
For stabilizing selection model, we consider the mean fitness as an unknown function of TE copy number, selection strength and transposition rate. In case of moving optimum scenario the transposition rate parameter is replaced by the speed of environmental change. Since assuming that all predictors contribute to the response variable (i.e. average fitness) only in linear and additive manner is non-realistic (see definition) we decided to fit non-linear regression model as implemented in the Random Forest approach see (Breiman,, 2001)
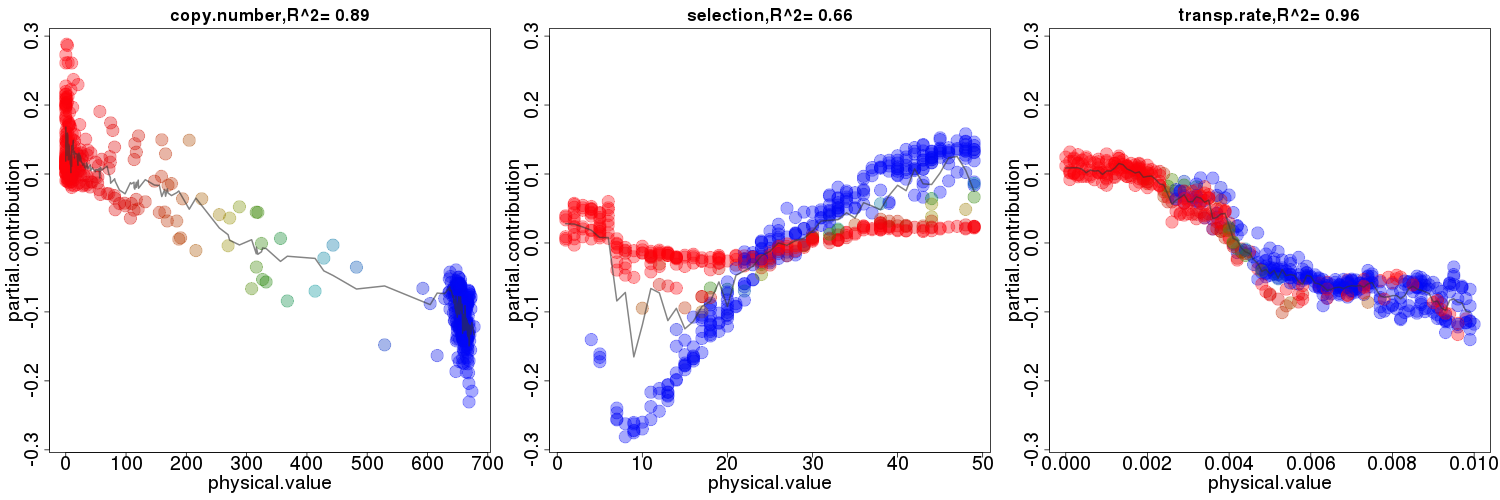
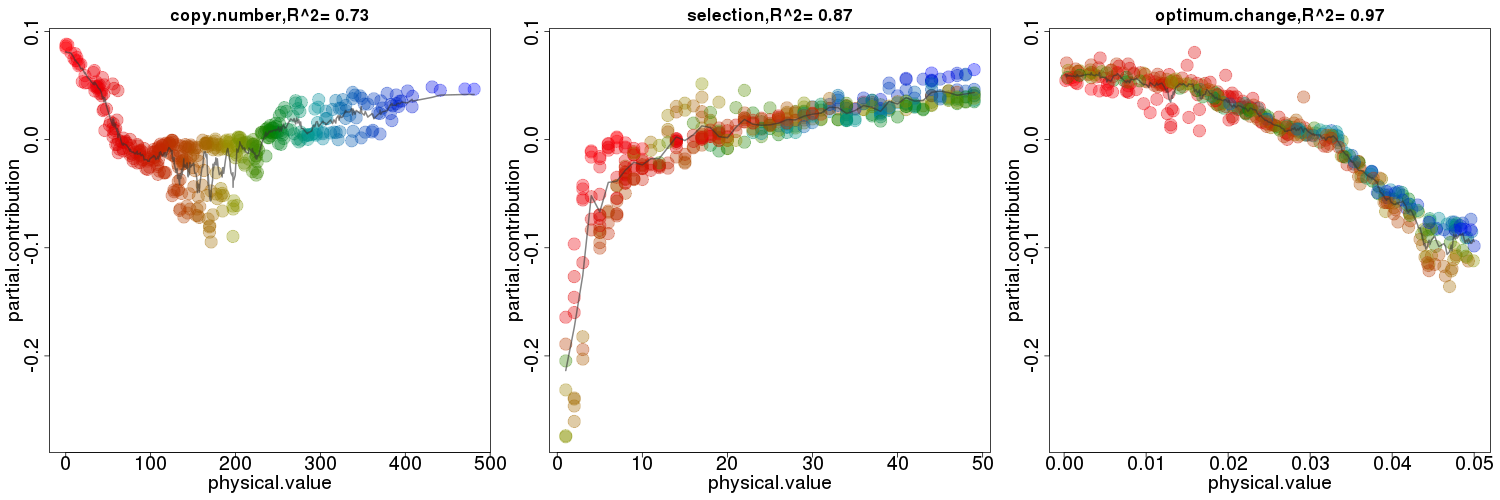
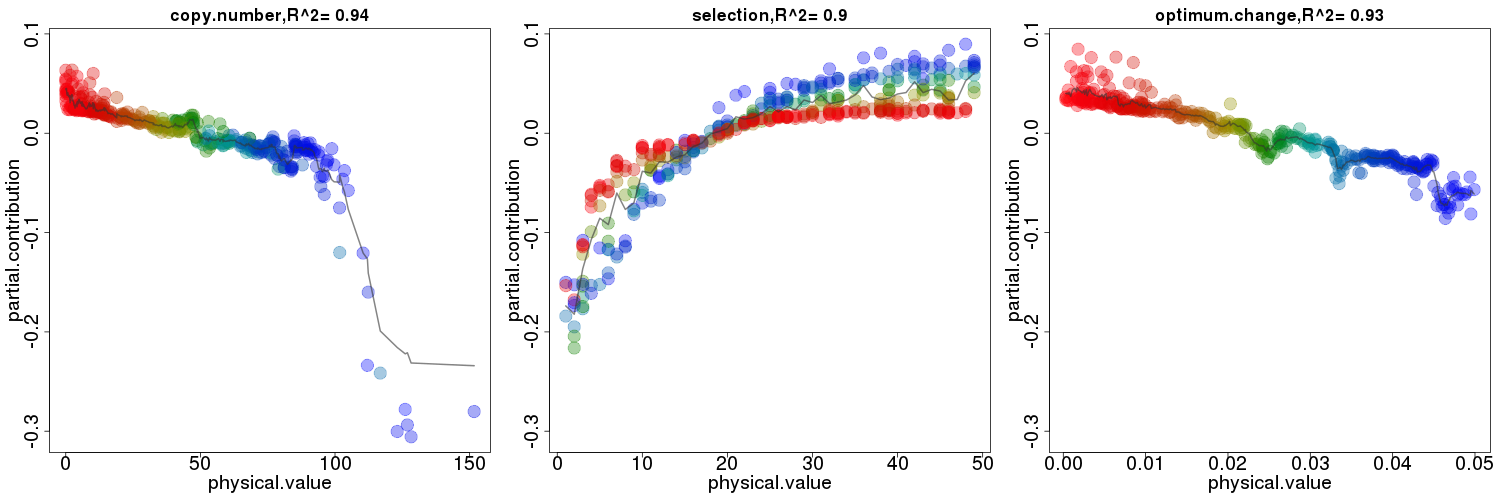
Figure 6 gives insights into the nature of nonlinear contribution for all considered predictors. Each point corresponds to one simulation obtained in Monte Carlo uniform sampling scheme. The x-axis spans the range of given predictor’s values and y-axis coordinate describes the cross validated predictor contribution (change of predicted value due to predictor value, i.e. the influence to the mean fitness).
The color gradient for each figure encodes the change of TE copy number. It turns out that for stabilizing selection (three panels in upper row on Figure 6), this predictor covers the most of the data variation independently identified by principal component analysis (PCA). For readability we keep this color-code also in moving optimum scenarios. Summarizing, the analyzed data are the same as the dataset analyzed in Figure 2 and 3, and the regression analysis give insights how the given predictor (one panel) affects the mean equilibrium fitness.
The color of data points changes gradually with increased TE copy number (three panels in the left column of Figure 6). For stabilizing selection and non-selfish moving optimum scenario the influence of TE copy number plot has same monotonically decreasing shape, i.e. moderate number of TE copies are beneficial, while more copies tend to decrease the average equilibrium fitness. Slightly different plot is obtained for selfish scenario (middle panel): the parabolic shape suggests the positive contribution of this parameter in relatively low and high TE copy number, while the moderate TE copy number has negative impact on the equilibrium fitness.
The analogous monotonically decreasing behavior can be observed for transposition rate and speed of optimum change parameters (three panels in the right column in Figure 6). Over the range of variation of the parameters, high transposition rates (and high environmental stress) are deleterious.
The influence of selection parameter is more intriguing. The interesting trend can be observed for stabilizing selection (top middle panel in Figure 6). Two subpopulation can be distinguished: for simulations with low TE copy number (red points) the selection parameter does not influence the mean fitness, while for simulations carrying more TE copies (blue points) the selection parameter strongly affects the response variable (loose selection is beneficial). For moving optimum scenario the selection parameter influences fitness in monotonically increased manner (i.e. more loose selection is more beneficial).
 |
 |
 |
3.4 Adaptation and Transposable Elements
Next, we studied how in general TEs influence evolvability. We observed a tradeoff resulting from mutagenic activity. On one hand, populations deprived of TEs are homogenous, and polymorphism is only driven by TE-unrelated mutations (with rate ). On the other hand, in presence of TEs, populations display a higher mutation rate, wider phenotypic ranges, and thus a larger evolutionary potential. Depending on the parameters and the number of TEs at equilibrium, populations can display lower or higher average fitness than in the non-TE case. However, when the TE-unrelated mutation rate is too low to allow the population to track the optimum efficiently, the presence of active TEs may substantially improve the average equilibrium fitness.
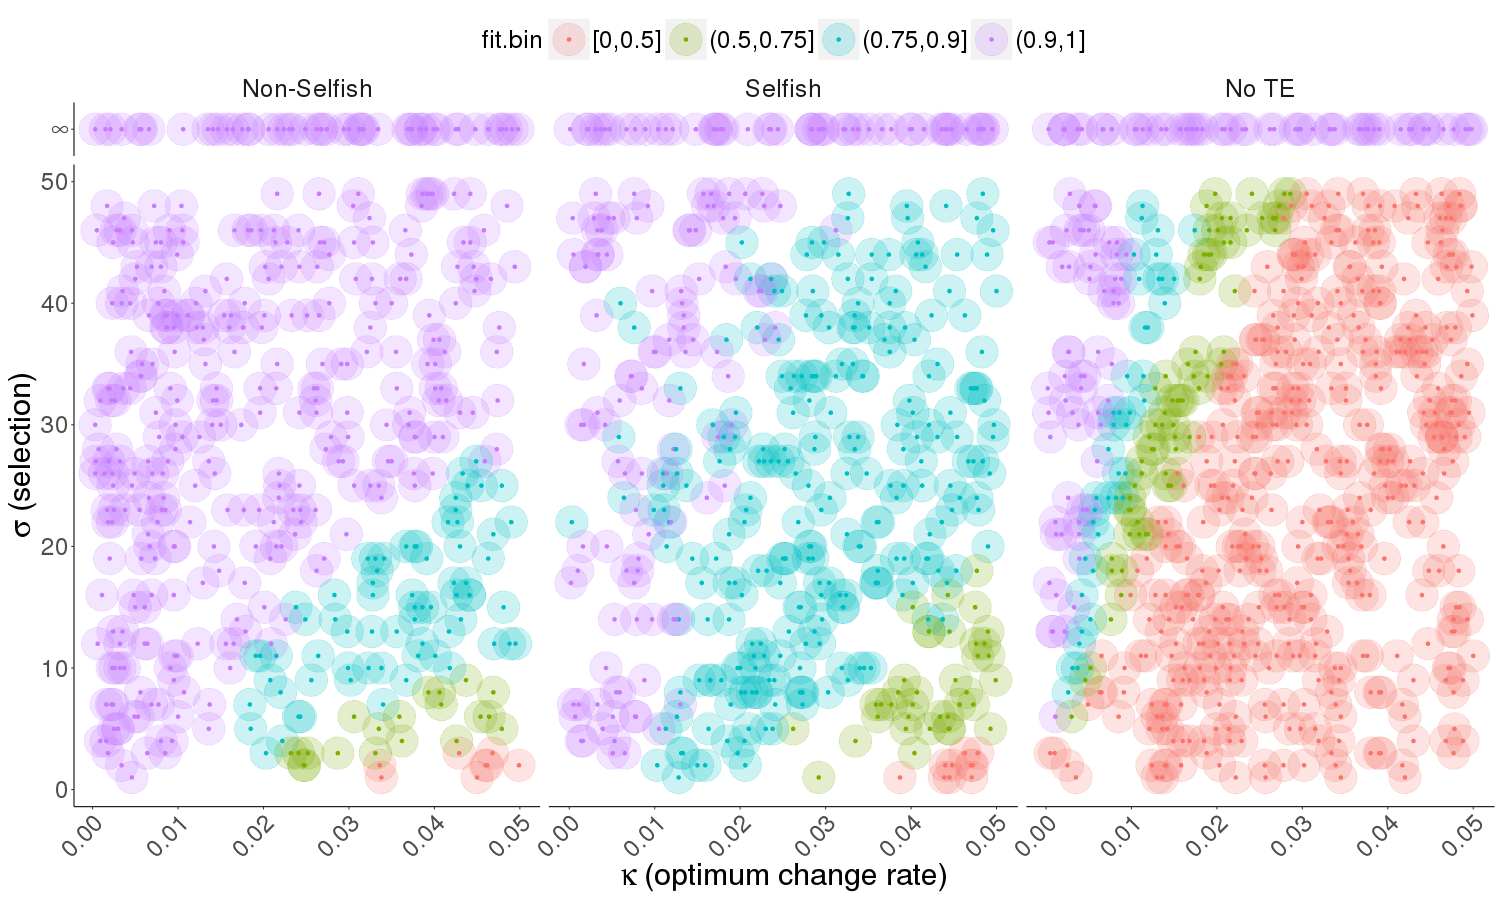
We already know that the presence of TEs in population is on average beneficial when it comes to overcoming the environmental pressure. In the figure 7 we present the patterns of the adaptive abilities in the sense of mean fitness value along with its trend in populations with and without TEs for different values of (selection strength) and (speed of the optimum change).
In sum, TEs can introduce additional phenotypic variation that allows population to track the phenotypic optimum, at the expense of an increase in the variance in fitness (and thus, a higher fraction of maladapted individuals).
4 Discussion
4.1 Modeling assumptions
One of the original points of our modeling approach is the use of the Fisher Geometric Model as a genotype-fitness model, which explicitly accounts for the complexity of the genotype-phenotype relationship combined with a fitness landscape. The major consequences of this modeling choice on the dynamics of TEs are that (i) the effect of a TE insertion on fitness is no longer fixed, as it depends on the genetic background of the individual and the fistance from the phenotypic optimum; (ii) the model accounts for biological complexity (epistasis for fitness, pleiotropy…); (iii) the balance between the need for evolvability and the cost of mutations is straightforward. In spite of being widely used in theoretical evolutionary biology Tenaillon, (2014), the FGM has been seldom implemented to study TE dynamics Startek et al., (2013). Historical models of TE evolution instead used to consider either neutral or equally-deleterious effects for all copies Charlesworth and Charlesworth, (1983); Charlesworth, (1991); Le Rouzic and Capy, (2005), while the possibility for beneficial effects was modeled more recently Le Rouzic et al., (2007), motivated by empirical observations. Yet, such beneficial effects were considered to be unconditionally adaptive, and such mutations occurred at the same rate whatever the average fitness of the population. Applying the FGM to TE dynamics releases these unnecessary assumptions, the cost being the lack of theoretical reference (in terms of e.g. transposition-selection equilibrium) compared with the most traditional literature.
One of the major theoretical contribution of the FGM is the detailed study of the adaptive process towards a fixed phenotypic optimum Orr, (1998, 2006). The possibility that this optimum itself might change in the course of time changes drastically the dynamics of the population, as adaptation becomes a continuous process inspired by theoretical (e.g. the Red Queen process) or empirical (global warming) observations. Of course, such a never-ending directional shift in the optimal phenotype is unrealistic, but remains a good approximation of adaptation in a changing environment, provided that the direction of the optimum change does not fluctuate rapidly. We are thus confident that our simulation results catch some biologically-relevant mechanisms associated with long-term environmental modifications, such as climate change.
In our model setting, phenotypic traits are expressed in mutational standard deviation units (i.e. the model is scaled by the mutational variance-covariance matrix). In this context, the isotropic fitness landscape has to be interpreted as a consequence of the fact that the mutational properties of traits are expected to evolve towards mutational covariances that match fitness covariances Jones et al., (2014). Model parameters need to be defined in terms of mutational steps; for instance, in the default parameter set, the rate of optimum change () corresponds to around 4% of the background mutational standard deviation (). In other words, even a population deprived of TEs is likely to be able to track the optimum closely (provided that the number of traits is not too large), as the genetic diversity brought by mutations every generation is geometrically wider than the optimum change. In contrast, optimum changes of the order of constitute a challenge for TE-deprived populations.
Here, contrary to McFadden and Knowles, (1997), TE-related and -unrelated mutational effects were drawn in the same distribution. Our purpose was to assess whether TEs could maintain in populations without providing them a special effect (such as the ability to cross fitness valleys). In practice, little is known about the relative fitness consequences of TEs vs. point mutations in genomes ; some huge molecular changes (such as inversions and translocations) could have minor or no impact of fitness, while single substitutions can be lethal. Nevertheless, the propensity of TEs to be a source of evolutionary innovation (such as for the immune system of vertebrates, Agrawal et al., (1998)) suggests that the nature of molecular changes might have very long-term consequences for genomes, albeit this level of evolvability remains a modeling challenge.
4.2 Transposable elements as evolvability helpers
The presence and the activity of transposable elements in genomes promotes an increase in the mutation rate, which necessarily affects genome evolution. However, most mutations are deleterious, and individuals harboring a high mutation rate (due to e.g. a large amount of active TEs) will, in average, have a lower fitness relative to the rest of the population, leading to the elimination of mutagenic agents by natural selection. The need to adapt continuously to new environmental challenges may help "mutators" to invade asexual populations by hitch-hiking rare beneficial variants, but recombination break this association in sexual populations, making it possible to fix the advantageous allele while losing the deleterious mutator. According to this theoretical context, evolutionary helpers are expected to be rare or absent in sexual species.
However, the properties of transposable elements makes them particularly interesing, since contrary to other mutators that increase the genomic mutation rate in general, TEs replicate in genomes, ensuring a complete linkage disequilibrium between the mutated and the mutator locus. Unfortunately for the "evolvability helper" hypothesis, every beneficial mutation also increases the mutation rate, inflating the genetic load up to the point that the beneficial effects vanish in front of the catastrophic consequences of an uncontrolled amplification of transposable elements. In our simulations, we found no evidence of parameter sets for which active TEs could be considered as adaptive in average, i.e. that TE copy number was positively correlated with relative fitness. In contrast, the accumulation of inactive adaptive copies was systematic when a non-nil mutation rate between active and inactive TEs was introduced – in other words, when possible, evolution tends to decouple the mutator activity itself, which is deleterious, and the advantageous effect of specific insertions.
Nonetheless, some simulations depicted interesting scenarios that could be compared to empirical knowledge about genome content. First, some simulations implementing a fast environmental change could display a temporary gain in average fitness when TEs were present. Although TEs remain maladaptive within populations, and thus do not invade populations due to positive Darwinian selection, there might be a transcient, but substantial, advantage for species carrying more TEs when adapting to a violent environmental change when competing with other species on the same resource. However, in addition to invoking species selection — a mechanism which biological relevance is not firmly grounded, this hypothesis relies on the assumption that TE-unrelated mutations are limiting for evolution, which remains highly speculative. Second, the accumulation of beneficial, inactive copies (or, alternatively, active copies quickly inactivated by mutations) is realistic under a wide range of parameter values. In this case, active copies are maintained in low copy number due to their "selfish DNA" properties, but non-deleterious inactive copies (which are inert in the genome) can be maintained on the long term. This reminds the TE content of many eukaryotic genomes, in which potentially active copies are vastly outnumbered by TE relics. This also echoes the accumulating evidence for recurrent adaptive TE-derived mutations during evolution, such a molecular exaptation being the consequence (rather than the cause) of the universality of TE activity.
It was postulated that TE activity might play a significant role in adaptive evolution E and J, (2013). Founder populations colonizing novel ecological niches are usually of small size and reduced genetic variability, thus stress-induced TE activity may be a major factor required for rapid adaptation Stapley et al., (2013), directly corresponding to the results produced by our model. It could be one of possible explanations for the ’genetic paradox of invasive species’, i.e. the potential for rapid adaptation despite the initial low genetic variability. Examples of the adaptive role of TEs in the process of colonization by Drosophila have been discussed recently Barrón et al., (2014). There is also a growing body of evidence in other organisms that increased copy numbers of certain TE families reflect their TE-aided adaptation to stress Vieira et al., (1998); Kalendar et al., (2000); Naito et al., (2006); Schrader et al., (2014); Zhou et al., (2014).
It is widely accepted that TE activity can be induced by a range of biotic and abiotic stresses, because of the relaxation of epigenetic control, which in the light of the results generated by our model, provides an additional regulatory level to evolvability. TE-mediated adaptation would therefore comprise the following stages: (1) stress-induced TE activation, (2) burst of activity resulting in copy number increase, (3) TE-induced beneficial rearrangments, and (4) TE inactivation. On the host side, it would correspond to (1) increase of the initial genetic variability, (2) natural selection for more fit individuals, (3) vertical transmission nad fixation of beneficial variants, (4) vertical transmission of other (neutral) TE copies resulting in higher copy number and, possibly, genome inflation. Even though only the rare beneficial insertions are directly targeted by selection in populations successfully coping with environmental stress owing to the TE activity, other neutral insertions will also be transmitted to subsequent generations resulting in the overall copy number increase.
4.3 Conclusions
In this paper, we developed a model of TE proliferation mechanism in diploid sexual organisms that face the environmental changes. The model allows to follow the evolution of TE copies and their mutational influenece on the host population. Our simulations invetigate the interaction between active and inactive copies suggesting that the presence of inactive copies (in the quasi-steady state) is essential to preserve the transposition-selection equilibrium of active copies. Moreover, we suggest that additional mutational power related to the TE activity becomes crucial when the population needs to keep up in the fast or rapidly changing environment.
When it comes to the further research our main goal is to derive an analitical description of our model and then verify if theoretical calculations are consistent with the computational predictions. However, this goal seems to be highly nontrivial, since we introduce a natural selection and reproduction mechanisms based on the global fitness of the population. Thus, popular apporaches such as evolution of Markov Chains are discarded. Additionaly, we would like to explore the influence of other types of environmental change, e.g. fluctuating changes or abrupt changes of large amplitude.
5 Acknowledgments
This work was partially supported by Polish National Science Center grant 2012/06/M/ST6/00438 and grant POLONIUM: Matematyczne i obliczeniowe modelowanie ewolucji ruchomych elementów genetycznych.
References
- Agrawal et al., (1998) Agrawal, A., Eastman, Q. M., and Schatz, D. G. (1998). Transposition mediated by RAG1 and RAG2 and its implications for the evolution of the immune system. Nature, 394:744–751.
- André and Godelle, (2006) André, J.-B. and Godelle, B. (2006). The evolution of mutation rate in finite asexual populations. Genetics, 172(1):611–626.
- Baer et al., (2007) Baer, C. F., Miyamoto, M. M., and Denver, D. R. (2007). Mutation rate variation in multicellular eukaryotes: causes and consequences. Nature Reviews Genetics, 8(8):619–631.
- Barrón et al., (2014) Barrón, M. G., Fiston-Lavier, A. S., Petrov, D. A., and González, J. (2014). Population genomics of transposable elements in drosophila. Annual review of genetics, 48:561–581.
- Basten and Moody, (1991) Basten, C. J. and Moody, M. E. (1991). A branching-process model for the evolution of transposable elements incorporating selection. J. Math. Biol., 29(8):743–761.
- Bichsel et al., (2010) Bichsel, M., Barbour, A. D., and Wagner, A. (2010). The early phase of a bacterial insertion sequence infection. Theor. Popul. Biol., 78(4):278–288.
- Boutin et al., (2012) Boutin, T. S., Le Rouzic, A., and Capy, P. (2012). How does selfing affect the dynamics of selfish transposable elements? Mob. DNA, 3(1):5.
- Breiman, (2001) Breiman, L. (2001). Random forests. Machine Learning, 45(1):5–32.
- Brookfield, (2001) Brookfield, J. (2001). Evolution: The evolvability enigma. Curr. Biol., 11:R106–R108.
- Bulmer, (1985) Bulmer, M. G. (1985). The mathematical theory of quantitative genetics. Oxford University Press.
- Capy et al., (2000) Capy, P., Gasperi, G., Biémont, C., and Bazin, C. (2000). Stress and transposable elements: co-evolution or useful parasites? Heredity, 85:101–106.
- Charlesworth, (1991) Charlesworth, B. (1991). Transposable elements in natural populations with a mixture of selected and neutral insertion sites. Genet. Res. Camb., 57:127–134.
- Charlesworth and Charlesworth, (1983) Charlesworth, B. and Charlesworth, D. (1983). The population dynamics of transposable elements. Genet. Res., 42:1–27.
- Charlesworth and Charlesworth, (2010) Charlesworth, B. and Charlesworth, D. (2010). Elements of evolutionary genetics. Roberts and Company Publishers Greenwood Village.
- Charlesworth et al., (1991) Charlesworth, B., Morgan, M. T., and Charlesworth, D. (1991). Multilocus models of inbreeding depression with synergistic selection and partial self-fertilization. Genet. Res., 57:177–194.
- Denamur and Matic, (2006) Denamur, E. and Matic, I. (2006). Evolution of mutation rates in bacteria. Mol. Microbiol., 60(4):820–827.
- Doolittle and Sapienza, (1980) Doolittle, W. and Sapienza, C. (1980). Selfish genes, the phenotype paradigm and genome evolution. Nature, 284(5757):601–603.
- Drake et al., (1998) Drake, J. W., Charlesworth, B., Charlesworth, D., and Crow, J. F. (1998). Rates of spontaneous mutation. Genetics, 148:1667–1686.
- E and J, (2013) E, C. and J, G. (2013). The impact of transposable elements in environmental adaptation. Mol. Ecol., 22:1503–1517.
- Edwards and Brookfield, (2003) Edwards, R. and Brookfield, J. (2003). Transiently beneficial insertions could maintain mobile DNA sequences in variable environments. Mol. Biol. Evol., 20(1):30–37.
- Fisher, (1930) Fisher, R. A. (1930). The genetical theory of natural selection. Oxford University Press.
- Giraud et al., (2001) Giraud, A., Matic, I., Tenaillon, O., Clara, A., Radman, M., Fons, M., and Taddei, F. (2001). Costs and benefits of high mutation rates: adaptive evolution of bacteria in the mouse gut. Science, 291(5513):2606–2608.
- Hickey, (1982) Hickey, D. A. (1982). Selfish DNA : a sexually-transmitted nuclear parasite. Genetics, 101:519–531.
- Ishii et al., (1989) Ishii, K., Matsuda, H., Iwasa, Y., and Sasaki, A. (1989). Evolutionarily stable mutation rate in a periodically changing environment. Genetics, 121(1):163–174.
- (25) Johnson, T. (1999a). The approach to mutation–selection balance in an infinite asexual population, and the evolution of mutation rates. Proceedings of the Royal Society of London. Series B: Biological Sciences, 266(1436):2389–2397.
- (26) Johnson, T. (1999b). Beneficial mutations, hitchhiking and the evolution of mutation rates in sexual populations. Genetics, 151(4):1621–1631.
- Jones et al., (2014) Jones, A. G., Bürger, R., and Arnold, S. J. (2014). Epistasis and natural selection shape the mutational architecture of complex traits. Nature communications, 5.
- Kalendar et al., (2000) Kalendar, R., Tanskanen, J., Immonen, S., Nevo, E., and Schulman, A. (2000). Genome evolution of wild barley (hordeum spontaneum) by bare-1 retrotransposon dynamics in response to sharp microclimatic divergence. Proc Natl Acad Sci USA, 97:6603–6607.
- Kimura, (1967) Kimura, M. (1967). On the evolutionary adjustment of spontaneous mutation rates. Genetical Research, 9(01):23–34.
- Kirschner and Gerhart, (1998) Kirschner, M. and Gerhart, J. (1998). Evolvability. Proceedings of the National Academy of Sciences, 95(15):8420–8427.
- Kopp and Hermisson, (2009) Kopp, M. and Hermisson, J. (2009). The genetic basis of phenotypic adaptation I: fixation of beneficial mutations in the moving optimum model. Genetics, 182(1):233–249.
- Le Rouzic et al., (2007) Le Rouzic, A., Boutin, T. S., and Capy, P. (2007). Long-term evolution of transposable elements. Proc. Natl. Acad. Sci. USA, 104(49):19375–19380.
- Le Rouzic and Capy, (2005) Le Rouzic, A. and Capy, P. (2005). The first steps of transposable elements invasion. Genetics, 169:1033–1043.
- Leigh Jr, (1970) Leigh Jr, E. G. (1970). Natural selection and mutability. American Naturalist, pages 301–305.
- Leigh Jr, (1973) Leigh Jr, E. G. (1973). The evolution of mutation rates. Genetics, 73:Suppl–73.
- Lynch, (2007) Lynch, M. (2007). The origins of genome architecture. Sinauer Associates Inc, Sunderland, MA, USA.
- Lynch, (2008) Lynch, M. (2008). The cellular, developmental and population-genetic determinants of mutation-rate evolution. Genetics, 180(2):933–943.
- Lynch and Walsh, (1998) Lynch, M. and Walsh, B. (1998). Genetics and Analysis of Quantitative Traits. Sinauer Assoc.
- Marimont and Shapiro, (1979) Marimont, R. B. and Shapiro, M. (1979). Nearest neighbour searches and the curse of dimensionality. IMA J. Appl. Math., 24(1):59–70.
- Martiel and Blot, (2002) Martiel, J. and Blot, M. (2002). Transposable elements and fitness of bacteria. Theor. Popul. Biol., 61(4):509–518.
- McClintock, (1984) McClintock, B. (1984). The significance of responses of the genome to challenge. Science, 226:792–801.
- McFadden and Knowles, (1997) McFadden, J. and Knowles, G. (1997). Escape from evolutionary stasis by transposon-mediated deleterious mutations. J. Theor. Biol., 186:441–447.
- McGraw and Brookfield, (2006) McGraw, J. E. and Brookfield, J. F. Y. (2006). The interaction between mobile DNAs and their hosts in a fluctuating environment. J. Theor. Biol., 243(1):13–23.
- Miller et al., (1999) Miller, W. J., McDonald, J. F., Nouaud, D., and Anxolabéhère, D. (1999). Molecular domestication–more than a sporadic episode in evolution. Genetica, 107(1-3):197–207.
- Moody, (1988) Moody, M. E. (1988). A branching process model for the evolution of transposable elements. J. Math. Biol., 26(3):347–357.
- Naito et al., (2006) Naito, K., Cho, E., Yang, G., Campbell, M., Yano, K., Okumoto, Y., Tanisaka, T., and Wessler, S. (2006). Dramatic amplification of a rice transposable element during recent domestication. Proc Natl Acad Sci USA, 103:17620–17625.
- Orgel and Crick, (1980) Orgel, L. E. and Crick, F. H. C. (1980). Selfish DNA: the ultimate parasite. Nature, 284:604–607.
- Orr, (1998) Orr, H. A. (1998). The population genetics of adaptation: the distribution of factors fixed during adaptive evolution. Evolution, pages 935–949.
- Orr, (2000) Orr, H. A. (2000). Adaptation and the cost of complexity. Evolution, 54:13–20.
- Orr, (2006) Orr, H. A. (2006). The distribution of fitness effects among beneficial mutations in fisher’s geometric model of adaptation. Journal of Theoretical Biology, 238(2):279–285.
- Pigliucci, (2007) Pigliucci, M. (2007). Do we need an extended evolutionary synthesis? Evolution Int J Org Evolution, 61(12):2743–2749.
- Pigliucci et al., (2010) Pigliucci, M., Müller, G. B., et al. (2010). Evolution, the extended synthesis. MIT press Cambridge, MA.
- Roff, (1997) Roff, D. (1997). Evolutionary quantitative genetics. New York [etc.]: Chapman & Hall.
- Sawyer and Hartl, (1986) Sawyer, S. and Hartl, D. (1986). Distribution of transposable elements in prokaryotes. Theoretical population biology, 30(1):1–16.
- Schrader et al., (2014) Schrader, L., Kim, J., Ence, D., Zimin, A., Antonia Klein, A., Wyschetzki, K., Weichselgartner, T., Kemena, C., Stokl, J., Schultner, E., Wurm, Y., Smith, C., Yandell, M., Heinze, J., Gadau, J., and Oettler, J. (2014). Transposable element islands facilitate adaptation to novel environments in an invasive species. Nature Comm, 5:5495.
- Sinzelle et al., (2009) Sinzelle, L., Izsvák, Z., and Ivics, Z. (2009). Molecular domestication of transposable elements: from detrimental parasites to useful host genes. Cell. Mol. Life. Sci., 66(6):1073–1093.
- Sniegowski et al., (2000) Sniegowski, P. D., Gerrish, P. J., Johnson, T., and Shaver, A. (2000). The evolution of mutation rates: separating causes from consequences. Bioessays, 22(12):1057–1066.
- Stapley et al., (2013) Stapley, J., Santure, A., and Dennis, S. (2013). Transposable elements as agents of rapid adaptation may explain the genetic paradox of invasive species. Mol. Ecol., 24:2241–2252.
- Startek et al., (2013) Startek, M., Le Rouzic, A., Capy, P., Grzebelus, D., and Gambin, A. (2013). Genomic parasites or symbionts? modeling the effects of environmental pressure on transposition activity in asexual populations. Theoretical population biology, 90:145–151.
- Sturtevant, (1937) Sturtevant, A. (1937). Essays on evolution. i. on the effects of selection on mutation rate. The Quarterly Review of Biology, 12(4):464–467.
- Tenaillon, (2014) Tenaillon, O. (2014). The utility of fisher’s geometric model in evolutionary genetics. Annual Review of Ecology, Evolution, and Systematics, 45:179–201.
- Tenaillon et al., (1999) Tenaillon, O., Toupance, B., Le Nagard, H., Taddei, F., and Godelle, B. (1999). Mutators, population size, adaptive landscape and the adaptation of asexual populations of bacteria. Genetics, 152(2):485–493.
- Vieira et al., (1998) Vieira, C., Aubry, P., Lepetit, D., and Biemont, C. (1998). A temperature cline in copy number for 412 but not roo/b104 retrotransposons in populations of drosophila simulans. Proc Royal Soc London B Biol Sci, 265:1161–1165.
- Weber, (1996) Weber, M. (1996). Evolutionary plasticity in prokaryotes: a panglossian view. Biology and Philosophy, 11(1):67–88.
- Wylie et al., (2009) Wylie, C. S., Ghim, C.-M., Kessler, D., and Levine, H. (2009). The fixation probability of rare mutators in finite asexual populations. Genetics, 181(4):1595–1612.
- Zhou et al., (2014) Zhou, D., Zhang, D., Ding, G., Shi, L., Hou, Q., Ye, Y., Xu, Y., Zhou, H., Xiong, C., Li, S., Yu, J., Hong, S., Yu, X., Zou, P., Chen, C., Chang, X., Wang, W., Lv, Y., Sun, Y., L, M., Shen, B., and C, Z. (2014). Genome sequence of anopheles sinensis provides insight into genetics basis of mosquito competence for malaria parasites. BMC Genomics, 15:42.