AGN feedback and the origin of the enhancement in early type galaxies - insights from the GAEA model
Abstract
We take advantage of our recently published model for Galaxy Evolution and Assembly (GAEA) to study the origin of the observed correlation between [/Fe] and galaxy stellar mass. In particular, we analyse the role of radio mode AGN feedback, that recent work has identified as a crucial ingredient to reproduce observations. In GAEA, this process introduces the observed trend of star formation histories extending over shorter time-scales for more massive galaxies, but does not provide a sufficient condition to reproduce the observed enhancements of massive galaxies. In the framework of our model, this is possible only assuming that any residual star formation is truncated for galaxies more massive than . This results, however, in even shorter star formation time-scales for the most massive galaxies, that translate in total stellar metallicities significantly lower than observed. Our results demonstrate that (i) trends of [/Fe] ratios cannot be simply converted in relative time-scale indicators, and (ii) AGN feedback cannot explain alone the positive correlation between [/Fe] and galaxy mass/velocity dispersion. Reproducing simultaneously the mass-metallicity relation and the enhancements observed poses a challenge for hierarchical models, unless more exotic solutions are adopted such as metal-rich winds or a variable IMF.
keywords:
Galaxy: formation – Galaxy: evolution – Galaxy: abundances1 Introduction
Metal abundances of early-type galaxies have long been used to constrain their star formation histories. These studies typically take advantage of the ratio between elements (O, Mg, Si, S, Ca, and Ti) and iron, [/Fe], that is known to increase with galaxy stellar mass or velocity dispersion (e.g. Trager et al., 2000; Kuntschner et al., 2001; Thomas et al., 2010). elements are released mainly by type II supernovae (SNII), originating from massive progenitors with relatively short life-times (3-20 Myr). In contrast, Fe-peak elements are mainly contributed from type Ia supernovae (SNIa), whose progenitors have life-times ranging from 30 Myr up to several Gyrs. Therefore, the [/Fe] ratio quantifies the relative importance of SNII and SNIa, and is sensitive to different parameters including the relative abundance of massive stars i.e. the slope of the initial mass function (IMF), the delay time distribution (DTD) of SNIa, differential losses of metals via galactic winds, and the time-scale of star formation i.e. the time-scale over which a significant fraction of the stars in the final system formed (Tinsley, 1979; Worthey, Faber & Gonzalez, 1992; Matteucci, 1994). It has become, however, common practice to interpret variations of [/Fe] in terms of different time-scales of star formation: in a closed-box system, a relatively large [/Fe] ratio is obtained if most of the stars formed before SNIa could enrich the gas with significant amounts of Fe. Lower values are obtained if star formation continues for longer times, allowing the progressive incorporation of Fe into the star forming material.
The enhancement of massive elliptical galaxies has been considered traditionally as a serious problem for the hierarchical merging scenario, where massive galaxies are expected to assemble later than their lower mass counter-parts, from progressive mergers/accretion of smaller systems. Thomas & Kauffmann (1999) used star formation histories of elliptical galaxies extracted from a hierarchical model, and showed that model predictions were in stark contrast with the observed trends exhibiting a decrease of [Mg/Fe] with increasing luminosity. One limit of this work was that it was based on a closed box approximation and did not model chemical enrichment in a self-consistent way, i.e. by tracing the metal flows among different galaxy components. In addition, the adopted semi-analytic model (Kauffmann & Charlot, 1998), predicted bright ellipticals to be younger than their fainter counterparts, in contrast with observational evidence.
The star formation histories predicted by the latest renditions of hierarchical models are in much better agreement with trends inferred from data. This success can be largely ascribed to the inclusion of ‘radio-mode’ feedback, i.e. the suppression of late gas cooling (and hence star formation) in relatively massive haloes. De Lucia et al. (2006) showed that accounting for this process naturally gives rise to shorter time-scales of star formation for more massive ellipticals, in qualitative agreement with the conventional interpretation given to the observed increase of [/Fe] ratios as a function of galaxy stellar mass. This work, however, was based on an instantaneous recycling approximation for the newly produced metals, and therefore was not able to provide direct predictions for the [/Fe] ratios. Parallel work by Nagashima et al. (2005) included a sophisticated chemical enrichment treatment in a semi-analytic model, assuming a top-heavy IMF during starbursts. This work did not discuss the star formation histories predicted for elliptical galaxies, but showed that no simple modification of the adopted model was able to invert the negative slope predicted for the galaxy velocity dispersion-[/Fe] relation.
In the last decade, detailed chemical enrichment models tracing individual chemical abundances have been implemented both in in hydrodynamical simulations and in semi-analytic models of galaxy formation. This has allowed the problem of the enhancements of elliptical galaxies to be revisited in greater details. Pipino et al. (2009) showed that the inclusion of radio-mode feedback in their semi-analytic model was able to invert the slope of the galaxy stellar mass-[/Fe] relation for massive ellipticals. The predicted slope was, however, still relatively shallow and the scatter too large, particularly for intermediate mass galaxies. The role of ‘quasar mode’ feedback, associated with galaxy mergers, in reproducing the observed trends was highlighted in Calura & Menci (2011), although this work also used an approach based on a post-processing of star formation histories extracted from a hierarchical model. Consistent results have been obtained more recently by Taylor & Kobayashi (2015) and Segers et al. (2016) based on hydrodynamical simulations, although the effect of the specific AGN implementation used in the former study appears somewhat weaker and does not reproduce the observed trend.
In contrast with these results, Arrigoni et al. (2010) found that, albeit introducing the correct trend for the star formation histories of model galaxies, AGN feedback (in this case both quasar and radio mode were included) was not the key factor in reproducing the mass-[/Fe] relation. In their model, a good agreement with data could be achieved by assuming a mildly top-heavy IMF. More recently, Yates et al. (2013) have argued that a positive (but shallower than observed) slope in the mass-[/Fe] relation of local elliptical galaxies can be obtained using a DTD with per cent of SNIa exploding within Myr, or including metal-rich winds that can drive light elements directly into the circumgalactic medium. Stronger slopes are obtained assuming a variable IMF (e.g. as a function of the integrated star formation rate in the galaxy) as in Gargiulo et al. (2015) and Fontanot et al. (2016). These arise from the fact that massive galaxies tend to be associated with IMFs top-heavier (thus characterized by larger contributions from SNII) than less massive galaxies. The models presented in Arrigoni et al. (2010), Gargiulo et al. (2015), and Fontanot et al. (2016) predict a flat mass-[/Fe] relation when assuming a universal IMF, although AGN feedback is included in all of them. This is in contrast with claims from e.g. Segers et al. (2016).
2 The galaxy formation model
In this work, we use our recently published model for GAlaxy Evolution and Assembly (GAEA - Hirschmann, De Lucia & Fontanot, 2016). The model is based on that described in De Lucia & Blaizot (2007), with modifications introduced to follow more accurately processes on the scales of the Milky Way satellites (De Lucia & Helmi, 2008; Li, De Lucia & Helmi, 2010). Our new model features a sophisticated chemical enrichment scheme that accounts for the finite lifetime of stars and non instantaneous recycling of metals, gas and energy from asymptotic giant branch stars (AGBs), SNIa, and SNII (for details, see De Lucia et al., 2014). GAEA also features an updated stellar feedback scheme that adopts parametrizations based on results from hydrodynamical simulations (the FIRE feedback scheme defined in Hirschmann et al. 2016). As shown in that paper, this model is able to reproduce both the evolution of the galaxy stellar mass function and that observed for the correlation between galaxy stellar mass and gaseous metallicity.
Our galaxy formation model is coupled to the Millennium Simulation (Springel et al., 2005), a high resolution cosmological simulation following 2,1603 particles of mass , from to present, in a cubic region of comoving on a side, and based on a WMAP1 cosmology (, , , , and ). More recent measurements of cosmological parameters provide slightly different values and, in particular, a larger value for and a lower one for . We do not expect our predictions to be significantly affected by these differences (see e.g. Wang et al., 2008). For the following analysis, we have used only about 10 per cent of the entire volume of the Millennium Simulation, but we have verified that results would not change when using a larger volume.
3 enhancement of model galaxies
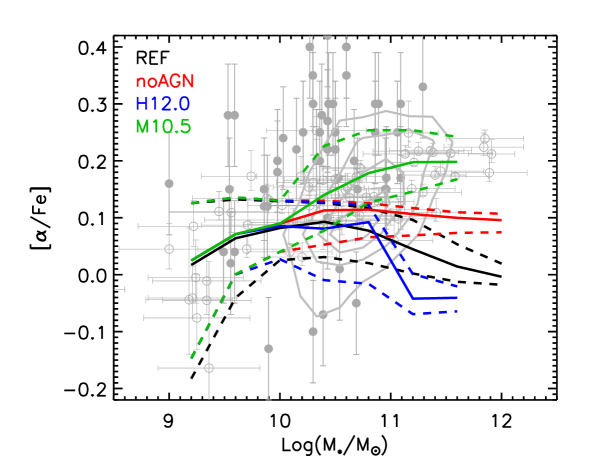
Fig. 1 shows the relation between [/Fe]111For model galaxies, this is approximated by [O/Fe], as oxygen is the most abundant of the elements. and galaxy stellar mass as predicted by our reference run (REF, black lines), and by additional runs that we discuss below. Grey symbols with error bars correspond to observational estimates by Spolaor et al. (2010, filled symbols) and Arrigoni et al. (2010, empty symbols). The grey contours show measurements by Thomas et al. (2010). Only model galaxies with a bulge-to-total stellar mass ratio larger than 0.7 (results are not very sensitive to this cut) have been considered. Solid lines correspond to the median of the distributions, while dashed lines show the 10th and 90th percentiles. Our REF run predicts a relatively flat relation, with a bend towards lower [/Fe] ratios for galaxies more massive than . This is in contrast with observational measurements, that show an enhancement of [/Fe] for the most massive galaxies. The red lines correspond to our reference model with radio mode feedback switched off (noAGN). The inclusion of radio-mode feedback, in our model, turns a relatively flat relation into a relation with a negative slope. This is in contrast with results from previous studies, and appears counter-intuitive as AGN feedback does introduce the expected trend for the star formation histories (see below). The blue and green lines correspond to two toy models where our default AGN feedback model is off but that assume either (i) gas cooling is suppressed when halo mass becomes larger than (blue lines in the figure, H12.0) or (ii) star formation is truncated when the galaxy stellar mass becomes larger than (green lines, M10.5). The former corresponds to the implementation adopted in Pipino et al. (2009). In this case, the average mass-[/Fe] relation is close to that obtained within our REF model, but there is an even more pronounced turn over at the most massive end. The other toy model is the only one, among those we tested, that predicts a positive slope.
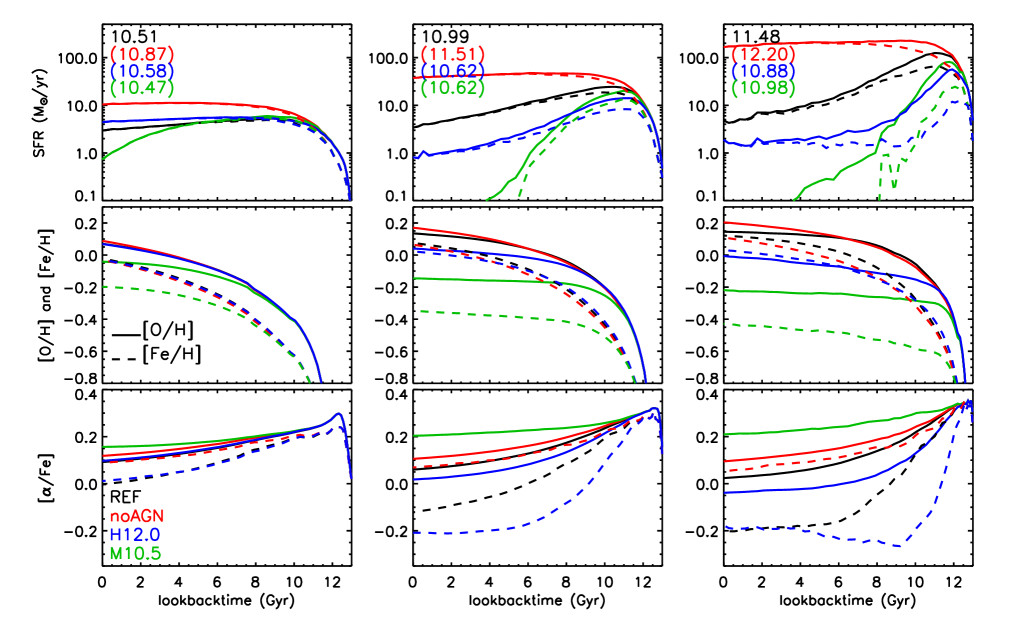
Fig. 2 shows the average star formation histories (top row), [O/H] and [Fe/H] abundances (middle row, solid and dashed lines respectively) and [/Fe] (bottom row, solid for the stellar component and dashed for the gas) for central galaxies with log, , and (from left to right) in our REF run. Coloured lines correspond to the averages computed using the same galaxies in the other runs, to better highlight the effect of the different assumptions. This implies that the mean final mass of the galaxies in each panel is different with respect to the REF run (as indicated in the legend). In the top panels, solid lines correspond to the star formation histories computed summing up the contributions from all progenitors, while dashed lines are obtained considering only the main progenitor (the most massive at each redshift). The evolution of [O/H], [Fe/H], and [/Fe] plotted corresponds to that of the main progenitor. In our REF model, the most massive galaxies form their stars on shorter time intervals than their less massive counterparts. The final average [/Fe] ratios for the stellar mass bins considered are, however, very similar. Switching off radio mode feedback (noAGN) translates in a larger [O/H] value because more stars are formed at late times, when the gas has been enriched to higher levels by previous generations of stars. The [Fe/H] is slightly lower in the noAGN run because of its delayed release by SNIa. The final values of the [/Fe] ratios in the noAGN run are larger than in the REF run, but again very similar for the three mass bins considered. Since the effect described is stronger for the most massive galaxies, the predicted mass-[/Fe] relation is flatter than in the REF run.
The H12.0 model predicts star formation histories that are in between the REF and noAGN run for the lowest mass bin considered. For the other two bins, the shape of the star formation histories is close to that predicted by the REF run but the overall levels of star formation are reduced. The almost systematic difference between the predicted star formation rates in the last several Gyrs translates in systematically lower abundances of both [O/H] and [Fe/H]. However, since a larger fraction of the stars in the final system originate from lower abundance gas, the [/Fe] ratio decreases with respect to the REF run. Finally, in the M10.5 model, the star formation histories are artificially truncated at increasing cosmic epochs for increasing stellar mass. The [O/H] and [Fe/H] abundances (and therefore [/Fe]) of the stellar component are effectively frozen at the times corresponding to the last star formation events, and only vary because of mergers/accretion events. The M10.5 model is the only one, among those considered, predicting both the right trend for the star formation time-scales as a function of galaxy stellar mass, and a positive slope of the mass-[/Fe] relation.
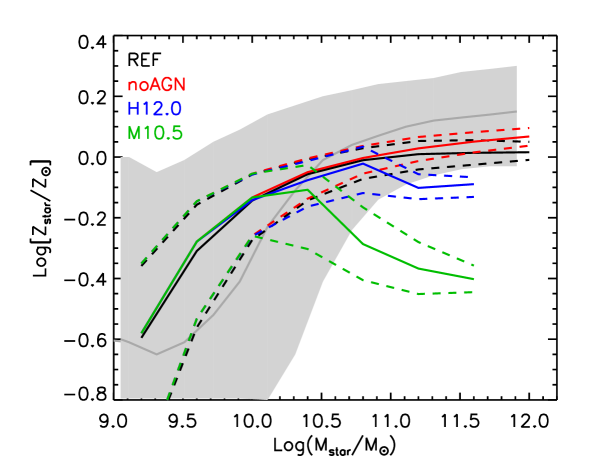
The time-interval over which most of the stars in the galaxies form has important consequences also on their total metallicity. This can be appreciated in Fig. 3, that shows the relation between galaxy stellar metallicity and stellar mass at . The grey region shows measurements by Gallazzi et al. (2005), based on the Sloan Digital Sky Survey (SDSS). Solid coloured lines show the median relations obtained for our different models. Predictions from our REF and noAGN runs are in quite good agreement with data. The median metallicity of model galaxies is, in both runs, above (below) the median of the observational data for stellar masses below (above) log, but always within the uncertainties. The two toy models considered in our study exhibit a bend of the mass-metallicity relation towards lower metallicity for more massive galaxies. This is particularly pronounced for the M10.5 model. This problem has been discussed earlier in De Lucia & Borgani (2012): in hierarchical models, massive galaxies grow primarily by accretions of low mass galaxies: stars form in different progenitors, most of them at high redshift, and then assemble at later time. These accretion events typically involve very little gas, and so negligible amounts of new stars form during merger driven starbursts. Since the stars form at high redshift, from material that is metal-poor, the final object also has low metallicity. Late mergers and accretions would tend to lower further the stellar metallicity. In reality, some of the accreted low mass galaxies could be destroyed by efficient tidal stripping. In addition, simulations show that stars accreted during minor mergers tend to reside in the outer regions of the remnant galaxy (Naab et al., 2009; Hirschmann et al., 2015), outside the region typically considered for the observational estimates (a 3 arcsec diameter fibre for SDSS). Even neglecting, however, all stars accreted below does not alleviate the problem, simply driven by the fact that stars formed over a too short time interval preventing a sufficient enrichment of the star forming material.
4 Discussion and Conclusions
We have studied the origin of the relation between the [/Fe] ratio and galaxy stellar mass in the framework of our recently published model for Galaxy Evolution and Assembly (GAEA, De Lucia et al., 2014; Hirschmann et al., 2016). In particular, we have focused on the role of AGN radio mode feedback that recent studies have identified as a crucial ingredient to reproduce the observed trend as a function of galaxy stellar mass (Taylor & Kobayashi, 2015; Segers et al., 2016, see also Pipino et al. 2009). In the framework of our model, radio mode feedback introduces the observed (inferred) trend of star formation histories extended on shorter time intervals for more massive galaxies. Contrary to conventional expectations, however, this is not a sufficient condition to reproduce the observed increase of the [/Fe] ratio with increasing galaxy stellar mass. Switching off AGN feedback destroys any correlation between galaxy stellar mass and star formation time-scale (as expected), but has the consequence of flattening a relation that is otherwise weakly negative. This is in contrast with recent claims, and with the conventional interpretation of the [/Fe]-mass relation. As discussed in Fontanot et al. (2016), we have verified that no simple modification of our chemical model (e.g. a different DTD for SNIa) is sufficient to invert the predicted slope of the mass-[/Fe] relation. A positive slope is obtained in GAEA when using a variable IMF (Fontanot et al., 2016), or a toy model where any residual star formation is truncated for galaxies more massive than (our M10.5 model). For galaxies with log, this means no stars are formed, on average, in the last 8 Gyrs. These very short time-scales of star formation (yet significantly larger than those inferred by e.g. Thomas et al. 2010) make it very difficult for the most massive galaxies in this model to reach the observed levels of total stellar metallicity.
Our results are only in apparent contradiction with previous studies. Pipino et al. (2009) were the first to reproduce a positive slope in the mass-[/Fe] relation in the framework of a hierarchical model. They argued that the success of their model was due to the inclusion of AGN radio mode feedback. In fact, their model corresponds to one of the toy models used in our study: gas cooling is suppressed in haloes more massive than (our H12.0 model). In the framework of their model, however, this parametrization gives results that are similar to those from our M10.5 model: star formation is effectively suppressed in massive galaxies in the last 8-9 Gyrs (see their Fig. 5). Pipino et al. (2009) also showed (see their Fig. 8) that their model predicts total stellar metallicities for massive galaxies that are significantly lower than observed, in agreement with results shown above. Our results are also fully consistent with Arrigoni et al. (2010): their model including both quasar and radio mode AGN feedback predicts a relatively flat [/Fe]-mass relation when coupled with a chemical model assuming ‘standard’ yields and IMF. The behaviour of the three example galaxies discussed in Taylor & Kobayashi (2015) is very close to that of our model including/excluding radio mode feedback (see the blue arrows in their Figs. 11 and 13). Gargiulo et al. (2015) use a semi-analytic model that includes AGN feedback prescriptions corresponding to those of our reference run. They claim that a variable IMF is needed to reproduce the observed enhancements trends, as we also find for GAEA (Fontanot et al., 2016). They also show that, in their model, the distributions of the star formation time-scales explain the scatter in the observed mass-[/Fe] relation, but are not responsible for the positive slope. Their model galaxies, however, do not exhibit a trend for shorter time-scales of star formation for more massive galaxies (see their Fig. 14). Segers et al. (2016) use simulations from the Evolution and Assembly of GaLaxies and their Environments (EAGLE) project and argue that AGN feedback can account for the -enhancement of massive galaxies. Also in this case, the local mass-metallicity relation bends at the most massive end, as shown in the recent work by Okamoto et al. (2016, their Fig. 4). Results from the hydrodynamical simulations presented in this latter paper also support our conclusions and highlight the difficulties in reproducing the enhancements and mass-metallicity at the same time.
Our study demonstrates that, generally speaking: (i) [/Fe] ratios cannot be used as simple indicators of the star formation time-scale, and (ii) AGN feedback is not the key ingredient to explain the enhancement of massive elliptical galaxies. Indeed, Fig. 2 shows that three out of the four runs used in this study predict shorter star formation time-scales for more massive galaxies. In two of these models, the relation between stellar mass and [/Fe] has a negative slope. In the framework of our model, radio mode feedback would be able to introduce a positive slope for the mass-[/Fe] relation only if effective in truncating star formation in massive galaxies in the past several Gyrs. This, however, would translate in too low total stellar metallicities for massive galaxies. Reproducing simultaneously the measured enhancements and the observed mass-metallicity relation in the local Universe represents a challenge for hierarchical models of galaxy formation, unless more extreme solutions like a variable IMF or enhanced winds are invoked.
Acknowledgements
We thank the referee for constructive comments that improved significantly the clarity of our work. GDL and FF acknowledge financial support from the MERAC foundation, and from the Italian Ministry of University and Research under the contract PRIN-MIUR-2012 ‘The Intergalactic Medium as a probe of the growth of cosmic structures’. MH acknowledges financial support from the European Research Council via an Advanced Grant under grant agreement n. 321323 (NEOGAL).
References
- Arrigoni et al. (2010) Arrigoni M., Trager S. C., Somerville R. S., Gibson B. K., 2010, MNRAS, 402, 173
- Calura & Menci (2011) Calura F., Menci N., 2011, MNRAS, 413, L1
- De Lucia & Blaizot (2007) De Lucia G., Blaizot J., 2007, MNRAS, 375, 2
- De Lucia & Borgani (2012) De Lucia G., Borgani S., 2012, MNRAS, 426, L61
- De Lucia & Helmi (2008) De Lucia G., Helmi A., 2008, MNRAS, 391, 14
- De Lucia et al. (2006) De Lucia G., Springel V., White S. D. M., Croton D., Kauffmann G., 2006, MNRAS, 366, 499
- De Lucia et al. (2014) De Lucia G., Tornatore L., Frenk C. S., Helmi A., Navarro J. F., White S. D. M., 2014, MNRAS, 445, 970
- Fontanot et al. (2016) Fontanot F., De Lucia G., Hirschmann M., Bruzual G., Charlot S., Zibetti S., 2016, ArXiv:1606.01908
- Gallazzi et al. (2005) Gallazzi A., Charlot S., Brinchmann J., White S. D. M., Tremonti C. A., 2005, MNRAS, 362, 41
- Gargiulo et al. (2015) Gargiulo I. D., Cora S. A., Padilla N. D., Muñoz Arancibia A. M., Ruiz A. N., Orsi A. A., Tecce T. E., Weidner C., Bruzual G., 2015, MNRAS, 446, 3820
- Hirschmann et al. (2016) Hirschmann M., De Lucia G., Fontanot F., 2016, MNRAS
- Hirschmann et al. (2015) Hirschmann M., Naab T., Ostriker J. P., Forbes D. A., Duc P.-A., Davé R., Oser L., Karabal E., 2015, MNRAS, 449, 528
- Kauffmann & Charlot (1998) Kauffmann G., Charlot S., 1998, MNRAS, 294, 705
- Kuntschner et al. (2001) Kuntschner H., Lucey J. R., Smith R. J., Hudson M. J., Davies R. L., 2001, MNRAS, 323, 615
- Li et al. (2010) Li Y.-S., De Lucia G., Helmi A., 2010, MNRAS, 401, 2036
- Matteucci (1994) Matteucci F., 1994, A&A, 288, 57
- Naab et al. (2009) Naab T., Johansson P. H., Ostriker J. P., 2009, ApJ, 699, L178
- Nagashima et al. (2005) Nagashima M., Lacey C. G., Okamoto T., Baugh C. M., Frenk C. S., Cole S., 2005, MNRAS, 363, L31
- Okamoto et al. (2016) Okamoto T., Nagashima M., Lacey C. G., Frenk C. S., 2016, ArXiv:1610.06578
- Pipino et al. (2009) Pipino A., Devriendt J. E. G., Thomas D., Silk J., Kaviraj S., 2009, A&A, 505, 1075
- Segers et al. (2016) Segers M. C., Schaye J., Bower R. G., Crain R. A., Schaller M., Theuns T., 2016, MNRAS, 461, L102
- Spolaor et al. (2010) Spolaor M., Kobayashi C., Forbes D. A., Couch W. J., Hau G. K. T., 2010, MNRAS, 408, 272
- Springel et al. (2005) Springel V., White S. D. M., Jenkins A., Frenk C. S., Yoshida N., Gao L., Navarro J., Thacker R., Croton D., Helly J., Peacock J. A., Cole S., Thomas P., Couchman H., Evrard A., Colberg J., Pearce F., 2005, Nature, 435, 629
- Taylor & Kobayashi (2015) Taylor P., Kobayashi C., 2015, MNRAS, 448, 1835
- Thomas & Kauffmann (1999) Thomas D., Kauffmann G., 1999, in Hubeny I., Heap S., Cornett R., eds, Spectrophotometric Dating of Stars and Galaxies Vol. 192 of Astronomical Society of the Pacific Conference Series. p. 261
- Thomas et al. (2010) Thomas D., Maraston C., Schawinski K., Sarzi M., Silk J., 2010, MNRAS, 404, 1775
- Tinsley (1979) Tinsley B. M., 1979, ApJ, 229, 1046
- Trager et al. (2000) Trager S. C., Faber S. M., Worthey G., González J. J., 2000, AJ, 119, 1645
- Wang et al. (2008) Wang J., De Lucia G., Kitzbichler M. G., White S. D. M., 2008, MNRAS, 384, 1301
- Worthey et al. (1992) Worthey G., Faber S. M., Gonzalez J. J., 1992, ApJ, 398, 69
- Yates et al. (2013) Yates R. M., Henriques B., Thomas P. A., Kauffmann G., Johansson J., White S. D. M., 2013, MNRAS, 435, 3500