A new outburst of the yellow hypergiant star Cas
Abstract
Spectroscopic monitoring of the yellow hypergiant Cas revealed a new outburst in 2013, which is obvious from the development of TiO bands in the spectra. Also many atmospheric lines characteristic for a later spectral type appear. This spectroscopic outburst is in agreement with the photometric light curve, which displays a drop by about 0.6 mag during the same period.
Introduction
Yellow hypergiants are massive stars that have passed through the red-supergiant phase. On their way back bluewards in the Hertzsprung-Russell diagram (HRD) their envelopes become unstable as soon as the effective temperature reaches a value of 7000 K, and the star experiences an outburst. The yellow hypergiant Cas is famous for its outbursts, during which the star develops TiO bands in a cool, optically thick wind with a very brief but high mass-loss rate (Lobel et al. 2003). Each outburst is accompanied by a steep drop in the light curve. At least three such outbursts were recorded for Cas: 1945–1947, 1985–1986, and 2000–2001.
In 2010 we started to monitor spectroscopically several yellow hypergiants using the Ondřejov 2m telescope. The aim of this campaign is to track and study their mass ejection phases. One of the objects we monitor is Cas. Our spectroscopic data show that during 2013 another outburst occurred. The decrease of the time interval between the outbursts might indicate that Cas is preparing for its passage through the Yellow Void region (de Jager & Nieuwenhuijzen 1997) towards the hot side of the HRD.
Observations and results
The observations were obtained during 2010–2015 using the Coudé spectrograph attached to the Perek 2-m telescope at Ondřejov Observatory (Šlechta & Škoda 2002). Spectra were taken in the wavelength regions 6250–6760 Å ( 13 000) and 6990–7500 Å ( 15 000).
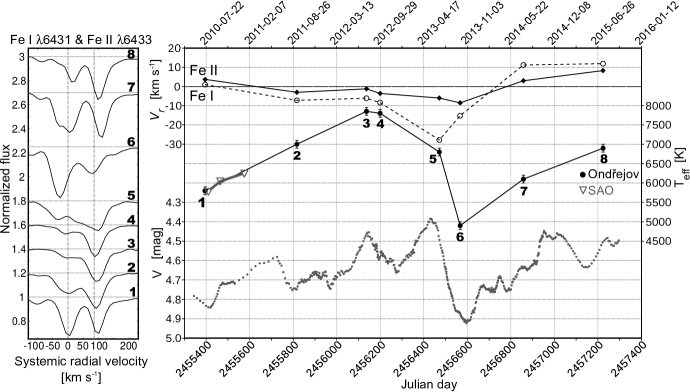
The spectra taken on October 1, 2013 reveal weak TiO absorption bands at 7055 Å and 7126 Å together with many atmospheric lines characteristic for a later spectral type. Photometric light curve obtained from the AAVSO International Database and BAAVSS database (contributed by W. Vollmann and D. Loughney, respectively) shows a drop in brightness by about 0.6 mag from May to October 2013. Changes in the line profiles are remarkable already in the spectra taken in June 2013 (data point 5 in Fig.1), when the visual brightness was still high. Note the broad blue wings of the Fe i and Fe ii lines indicating the onset of a strong stellar wind.
We estimated the temperature of Cas (right panel in Fig.1) using the Fe i 6431 / Fe ii 6433 line ratio (left panel in Fig.1), calibrated by high resolution spectra (Elodie and UVES POP) of 19 late A to early K supergiants with precise effective temperature values from the literature (Kovtyukh 2007). The estimated error is 100 K. Variations of follow the general trend of the light curve: hotter during bright phases and cooler during the outburst. Our temperature estimates agree with the results by Klochkova et al. (2014) during the time overlap of our observations in 2010–2011 (SAO spectra: empty triangles in Fig.1).
The radial velocity variability displayed by lines of different elements in various ionization stages indicates the vertical velocity structure within the outer atmosphere. The amplitude in Fe i is larger than in Fe ii: the outer layers where Fe i lines form are much more affected by the outburst activity. We observe the same shift of the Fe i radial velocity curve with respect to the light curve as reported by Lobel et al. (2003), while the Fe ii radial velocity curve follows both the light and effective temperature curves.
Acknowledgments
A.A. and I.K. acknowledge financial support from Estonian grant IUT40-1; M.K. and G.M. from GA ČR (14-21373S) and RVO:67985815.
References
- de Jager & Nieuwenhuijzen (1997) de Jager, C., & Nieuwenhuijzen, H. 1997, MNRAS, 290, L50
- Klochkova et al. (2014) Klochkova, V. G., et al. 2014, Astronomy Reports, 58, 101
- Kovtyukh (2007) Kovtyukh, V. V. 2007, MNRAS, 378, 617
- Lobel et al. (2003) Lobel, A., et al. 2003, ApJ, 583, 923
- Šlechta & Škoda (2002) Šlechta, M., & Škoda, P. 2002, Publ. Astron. Inst. Acad. Sci. Czech Republic, 90, 1