How the interbank market becomes systemically dangerous: an agent-based network model of financial distress propagation
Abstract
Assessing the stability of economic systems is a fundamental research focus in economics, that has become increasingly interdisciplinary in the currently troubled economic situation. In particular, much attention has been devoted to the interbank lending market as an important diffusion channel for financial distress during the recent crisis. In this work we study the stability of the interbank market to exogenous shocks using an agent-based network framework. Our model encompasses several ingredients that have been recognized in the literature as pro-cyclical triggers of financial distress in the banking system: credit and liquidity shocks through bilateral exposures, liquidity hoarding due to counterparty creditworthiness deterioration, target leveraging policies and fire-sales spillovers. But we exclude the possibility of central authorities intervention. We implement this framework on a dataset of 183 European banks that were publicly traded between 2004 and 2013. We document the extreme fragility of the interbank lending market up to 2008, when a systemic crisis leads to total depletion of market equity with an increasing speed of market collapse. After the crisis instead the system is more resilient to systemic events in terms of residual market equity. However, the speed at which the crisis breaks out reaches a new maximum in 2011, and never goes back to values observed before 2007. Our analysis points to the key role of the crisis outbreak speed, which sets the maximum delay for central authorities intervention to be effective.
I Introduction
The financial instability which characterised the last decade made clear to academic and regulators that the economy and the financial system have become so inherently complex that a multidisciplinary effort is needed to disentangle the intertwined set of connections between different actors and institutions (Gai et al.,, 2011; Acemoglu et al.,, 2015; Sorkin,, 2009; Beale et al.,, 2011; Haubrich and Lo,, 2013). Indeed, the network structure of the financial system is now acknowledged as a potential trigger of instability (Chan-Lau et al.,, 2009; Bardoscia et al.,, 2016), thus the many recent studies on the origin of the crisis investigating the interplay between network topology and contagion processes (an approach originally developed in statistical physics111Net gains. Nature Physics 9, 119 (2013) doi:10.1038/nphys2588.). Among the various subjects, researchers focused in particular on the interbank lending market, namely the network of financial interlinkages between banks resulting from unsecured overnight loans. This system has been ascribed as one of the principal diffusion channels for financial distress during the 2007/2008 crisis (Bluhm and Krahnen,, 2011; Cont et al.,, 2013; Gabrieli and Co-Pierre,, 2014; Georg,, 2013; Krause and Giansante,, 2012): after the collapse of Lehman Brothers, the interbank market froze causing a severe liquidity drought within the whole financial system (Acharya and Merrouche,, 2013; Adrian and Shin,, 2008; Brunnermeier,, 2009; Berrospide,, 2013). Such a black swan was due to the collapse of different liquidity channels, e.g., Asset-Backed-Commercial-Paper and Repo, and to a burst in the spread between long-term and over-night interest rates (or Libor-OIS spread) (Brunnermeier,, 2009). As this problem became systemic, central banking authorities intervened with extraordinary monetary policies to restore the solvency of the financial system.
Liquidity issues threaten the stability of the financial system by generating important spillover effects. Different subcategories of problems have been identified in the literature: funding liquidity, market liquidity, flight to liquidity-quality, liquidity spirals, liquidity hoarding, market freeze, and assets fire sales. Authors like Acharya and Skeie, (2011) and Brunnermeier and Pedersen, (2009) have modeled liquidity dynamics using a theoretical approach. Others like Berrospide, (2013) and Acharya and Merrouche, (2013) resorted to empirical econometric analyses to study the causes of interest rate spreads. Eisenberg and Noe, (2001) have been the first to tame the complexity of the problem using a theoretical approach explicitly considering the set of interconnections within the financial system. Their work originated a flourishing line of research aimed at assessing the systemic importance of financial institutions under a network perspective—see, among the others, Greenwood et al., (2015); Gabrieli and Co-Pierre, (2014); Bluhm and Krahnen, (2011); Hausenblas et al., (2015); Barucca et al., (2016).
A second approach to deal with the complexity of the financial system has been that of using agent-based models (ABM). An ABM is a simulated framework in which several agents interact following optimal selfish strategies, creating spin-off effects such as the emergence of an endogenous trading market (Caporale et al.,, 2009; Lucas et al.,, 2014). The use of ABM in economics and finance started in parallel with the development of calculators and computer science. The Santa Fe Institute Artificial Stock Market model in the early 1990s was one of the first ABM developed—and later complemented with market orders (Lux and Marchesi,, 1999). Recent advances in ABM for financial stability studies include the work of Fischer and Riedler, (2014), who showed the fundamental role of leverage in assessing systemic risk, and of Georg, (2013) and Hałaj and Kok, (2014), who modeled an emerging interbank market via a stylised trading mechanisms. All these studies agree on the relevance of the topology of interactions for contagion mechanisms. Others studies like Cont et al., (2013), Bookstaber et al., (2014) and Klinger and Teplý, (2014) consider an exogenous interbank network (data-driven or simulated) affected by shocks that induce an idiosyncratic response such as the emergence of bank runs and fire sales. The aim is to evaluate systemic risk, and find effective regulatory capital buffer and requirements to prevent cascade failures.
In this work we bring together these two approaches by introducing and ABM which describes the network dynamics of the interbank market. We build on the framework introduced by Chan-Lau et al., (2009) and Krause and Giansante, (2012), and later developed by Cimini and Serri, (2016). We consider a data-driven network of bilateral exposures between banks (the agents of our model), which use micro-optimal rules to interact with each other and with the rest of the financial system. We explicitly model various categories of spillover effects arising during financial crises, such as fire sales and interest rate jumps due to leverage targeting and liquidity hoarding behavior of banks. The modeled dynamics of pro-cyclical policies then spread financial losses via credit and liquidity interconnections, and may result in cascades of defaults. In our approach, we just assume the existence of events in order to focus on the description of the dynamical evolution of the financial system. Our ABM can thus be used to stress-test the robustness of the financial system to an external shock, which can be either absorbed or cause an avalanche of failures eventually leading to the market freezing.
Note that the use of an ABM allows us to have a complete description of the system dynamics during a crisis (i.e., out of the economic equilibrium), which would be very difficult to obtain by analytical modeling. The ABM presented here also allows to consider a flow of events which is different from what happened in reality during, e.g., the 2007-2008 financial crisis. In particular, we are interested in the scenario characterised by the absence of a lender of last resort like a central bank, whose monetary policies can completely re-design the market. Indeed, our aim is not to reproduce the real dynamics of the crisis, but to define the worst-possible scenario without any quantitative easing nor bail-out program by regulatory institutions. The rest of the paper is organised as follows. Sections II and III report basic assumptions and detailed description of the ABM framework, respectively. Results of our extensive simulation program are discussed in Section IV, and Section V concludes.
II Model assumptions
The main ingredients of the model are the set of connections and the strategies of the agents. In order to define them, we make the choices listed below.
Network definition
-
•
The interbank network is assumed to consist of loans with overnight (ON) duration. Thus, is the overall amount that bank lends to bank (i.e., the interbank asset of towards ), which corresponds to the liquidity that borrowed from (i.e., the interbank liability of towards ). As contracts are of short duration (ON), we assume that links are continuously placed and immediately resolved and rolled over, so that the same (current) interest rates applies to both assets and liabilities. In other words, the market dynamics we consider here is on a time scale longer than that of contracts duration.
-
•
The network is derived from aggregate interbank exposures and obligations: and . We use the Bureau van Dijk Bankscope database222Raw Bankscope data are available from Bureau van Dijk: https://bankscope.bvdinfo.com. Refer to Battiston et al., (2015) for all the details about the handling of missing data., that contains yearly-aggregated balance sheets information of large European banks from 2004 to 2013, and resort to the procedure described in Cimini et al., (2015) which uses the fitness model (Caldarelli et al.,, 2002) to build an ensemble of interbank networks from such aggregate data.
-
•
For each bank , the balance sheet equation reads:
(1) where and are, respectively, the external assets and liabilities of . and are the total amount of assets and liabilities (external plus interbank) held by , respectively. For each bank to be solvent, it must be .
Strategies definition
In order to build agent strategies and model dynamics, we take inspiration from the most important facts characterising the crises.
-
•
If hit by a shock, a bank sells assets following a leverage targeting policy in order to reinforce its reputation and expectation of the stakeholders.
-
•
After the shock and during the realignment, worries about creditworthiness may cause a “flight to quality”, for which banks withdraw liquidity from the market.
-
•
Liquidity hoarding coupled with a constant liquidity demand triggers an increase of interbank interest rates, and the consequent revaluation of interbank assets and liabilities.
-
•
If a bank defaults, credit and funding shocks propagate through its bilateral exposures like a bank-run contagion on financial interbank contracts.
-
•
Interbank network connections and fire sales spillovers may lead to default cascades, with a consequent increasing of liquidity hoarding and interest rate.
-
•
In extreme conditions, the market freezes triggering exacerbated fire sales.
III Model dynamics
Building on the above definitions and assumptions, we now specify the model dynamics of the interbank market.
III.0.1 Exogenous shock
- •
-
•
At first, bank tries to realign to its target leverage by selling assets. To this end, the amount of assets to be sold is given by (Brunnermeier,, 2009; Adrian and Shin,, 2008):
(3) As bank has increased worries on its financial situation, it adopts a microprudential policy (Acharya and Merrouche,, 2013; Berrospide,, 2013) by hoarding the liquidity granted by such sales. This means that its interbank loans are not rolled over for their entire amount. We thus assume that external and interbank assets are sold proportionally to their balance sheet shares and , respectively. We further assume that interbank assets rescale proportionally to the contracts size: each loan decreases of an amount equal to times the ratio of itself to the total exposure of . The net result is that part of the total value of the interbank market is lost. The consequent increase of counterparty and roll-over risk perceived in the market causes the interbank interest rate to grow up (Acharya and Skeie,, 2011). In particular we assume:
(4) where the factor is as a small quantity which leaves the system stable, and is a random variable drawn from . Thus, interbank assets and liabilities increase as and , respectively and . Note that while the external assets sold by are turned into liquidity333Models usually assume that external assets do not revalue as the most unbiased assumption that the overall contribution of market fluctuations averages to zero. and thus do not cause any change of equity for , the liquidated interbank assets causes the bank’s equity to shrink as they do not get revalued by the new interest rate. Therefore, the target leverage of is substantially respected, except for the non appreciation of a part of its interbank assets (that is, however, minimal). Overall, the balance sheet of bank becomes:
indicating that the equity of has changed due to the external shock and the revaluation of its interbank contracts, except the part which is not rolled-over.
-
•
Banks that borrow from receive a funding shock given by the interbank assets dries up for liquidity hoarding, and replace it with an external liability. Thus their balance sheets becomes:
(6) -
•
For all other banks :
(7)
These steps are repeated until a first default is triggered.
III.0.2 Cascade Failures
-
•
After some rounds of exogenous shocks, at iteration step a given bank becomes insolvent and defaults, meaning . Bank is removed from the system, but this event triggers a cascade of credit and liquidity losses in the interbank market (Chan-Lau et al.,, 2009; Krause and Giansante,, 2012). We use a one-step Debt-Solvency rank dynamics (Cimini and Serri,, 2016) to model this process, i.e., we have
-
A)
Credit shocks. Bank cannot meet its obligations, so that each other bank suffers a loss equal to . Here indicates the amount of loss given default. We set to consider only un-collateralized markets.
-
B)
Funding shocks. Banks are unable to replace all the liquidity previously granted by the defaulted institutions but by selling their assets, triggering fire sales Brunnermeier and Pedersen, (2009). In particular, each bank is able to replace only a fraction of the lost funding from , and its assets trade at a discount: must sell assets worth in book value terms444Following a common approach (Ellul et al.,, 2011; Feldhütter,, 2012; Greenwood et al.,, 2015), we assume that fire sales generate a linear impact on prices. Given that is the total amount of assets to be liquidated, we have no price change when , and assume that assets value vanishes when (i.e., when the whole market has to be sold). Thus we have a relative assets price change . To obtain the corresponding , we equate the loss to the amount sold times , obtaining ., corresponding to an overall loss of . Here we set , meaning that banks actually cannot replace the lost funding from and are thus forced to entirely replace the corresponding liquidity by assets sales.
Overall, the balance sheet of a bank connected to becomes:
(8) If any other bank fails because of the suffered loss, the procedure above is repeated, until no other bank fails.
-
A)
-
•
After the default cascade has ended, the net change of equity drives each survived bank to realign to its leverage before the cascade, and to liquidate some of its assets. Thus, the dynamics restart from the exogenous shock phase, even if the shock is endogenous this time. However, now the interbank market has shrunk significantly by a loss . This triggers a sudden interest rate increase, which we model by adding to eq. (4) a source term depending on the ratio of to the exogenous shock :
(9) Thus, if the interest rate grows by the same factor as before, but if the interest rate blows up. Overall, the equities of each bank change555We consider a random sequence of survived banks to perform target leveraging sequentially. according to eq. (• ‣ III.0.1) with , where however is replaced by , and the interest rate has changed according to eq. (9). This process may trigger again a default cascade. Otherwise, the exogenous shock dynamics continues afterwards.
III.0.3 Market freeze
The market freezes at iteration when the total relative equity of the market becomes smaller than a critical ratio . At this point, interbank assets get totally liquidated. Whenever for a given bank this liquidation is not enough to repay debts (that is, if ), such bank is forced to fire sale its external assets. However, differently from normal sales due to funding shocks, now the market is frozen and the value of external assets is therefore enormously decreased. Thus bank must sell a fraction of assets worth , with . To evaluate the depricing factor , we rescale by the relative wealth of potential buyers of fire-sold assets Duarte and Eisenbach, (2013) (i.e., their current wealth compared to the initial value):
| (10) |
meaning that if the interbank market shrinks it is more difficult to sell assets and grows. Note that to compute , we subtract from the current total equity the total assets that must be fire sold (because these assets cannot be used to acquire other assets). The market freeze condition ends the ABM dynamics of the interbank market.
IV Results
| Symbol | Value | Description |
|---|---|---|
| density of the reconstructed interbank network | ||
| 1.0 | loss given default | |
| lost funding fraction to be replaced | ||
| $ | entity of the exogenous shock | |
| initial interest rate | ||
| interest rate increase factor | ||
| variation of the random variable in the interest rate dynamics | ||
| prefactor of the source term for interest rate dynamics | ||
| critical ratio of residual equity for market freeze |
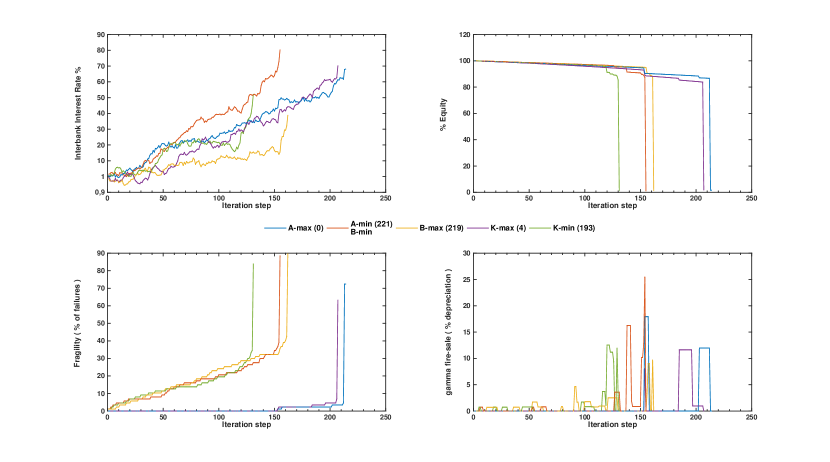
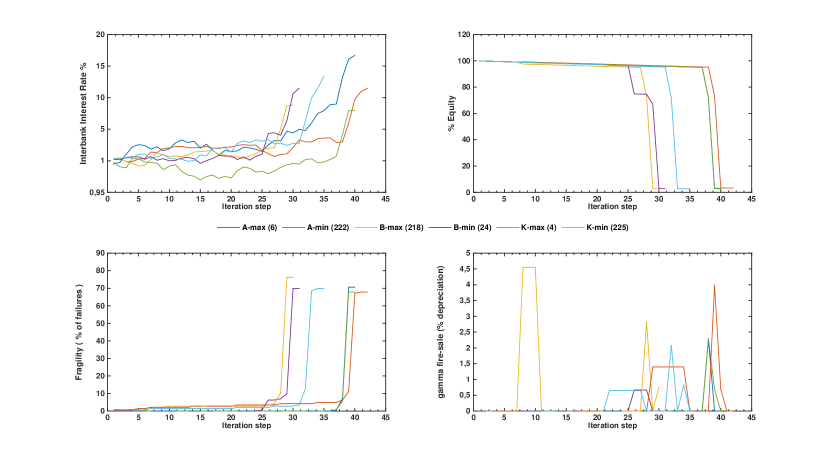
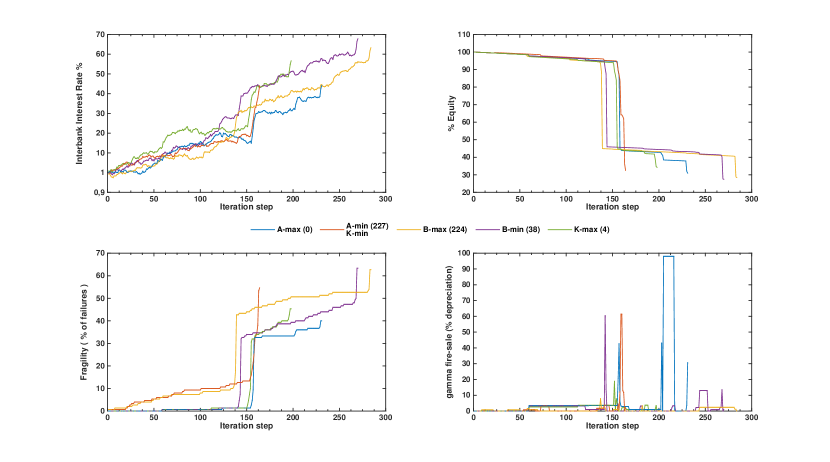
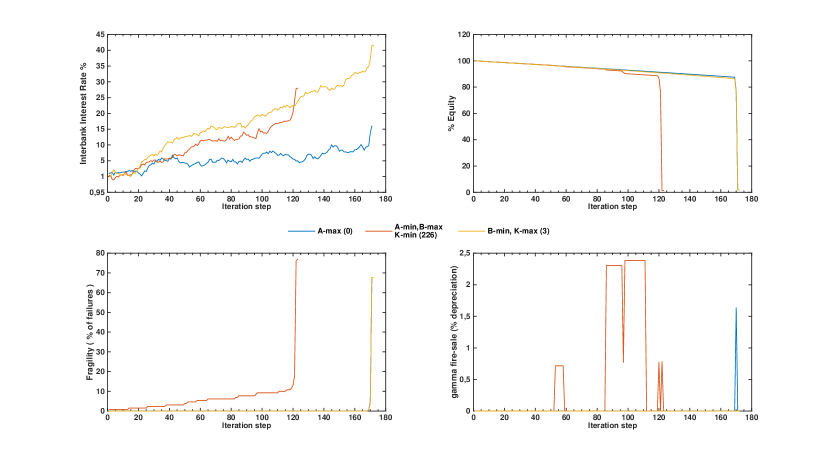
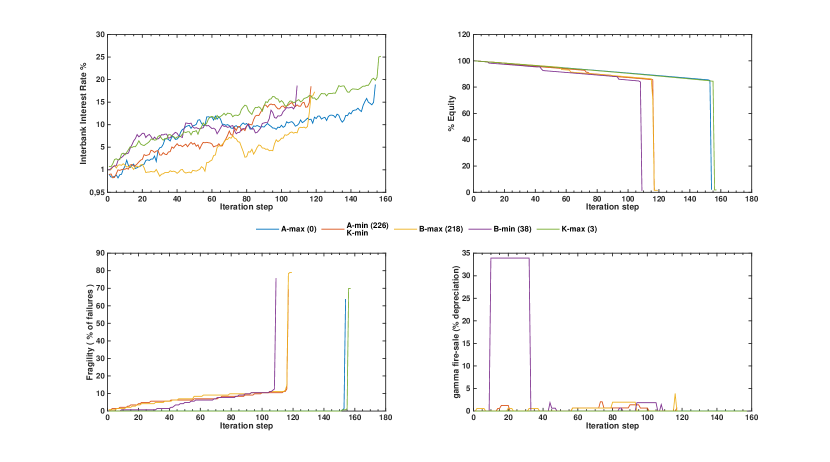
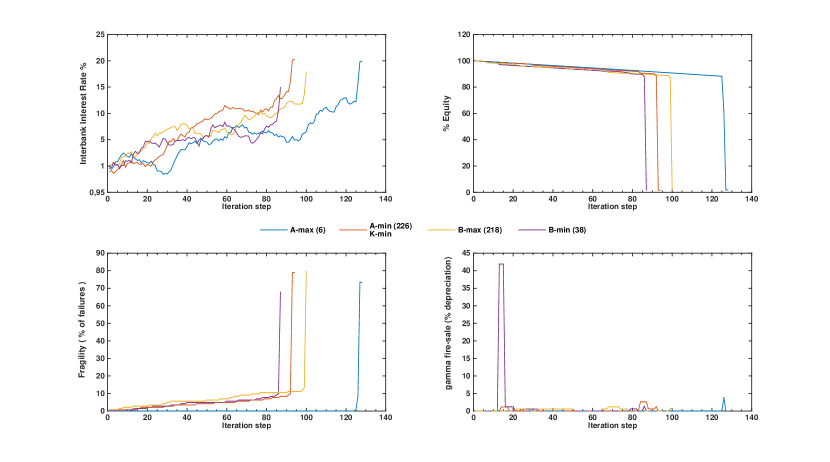
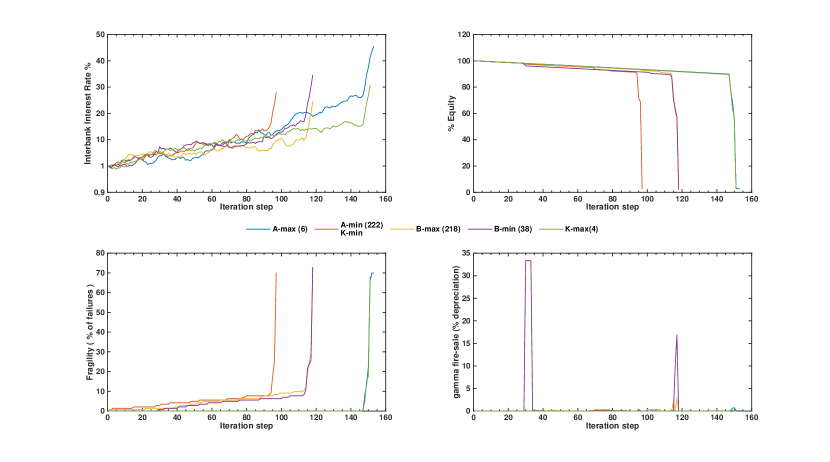
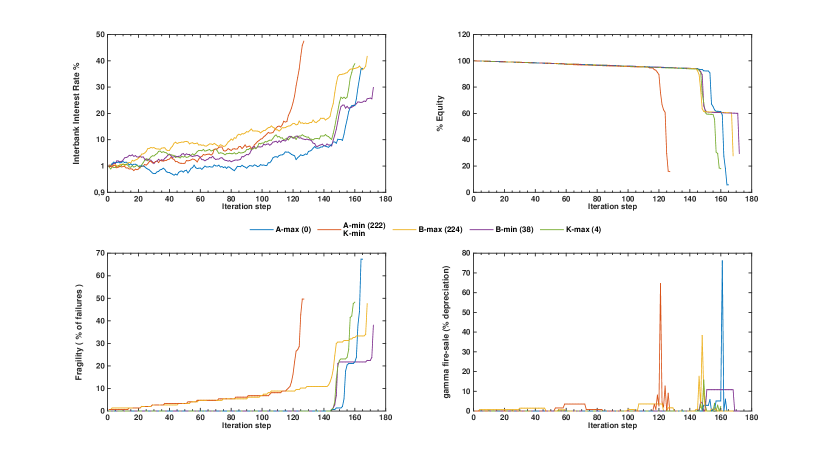
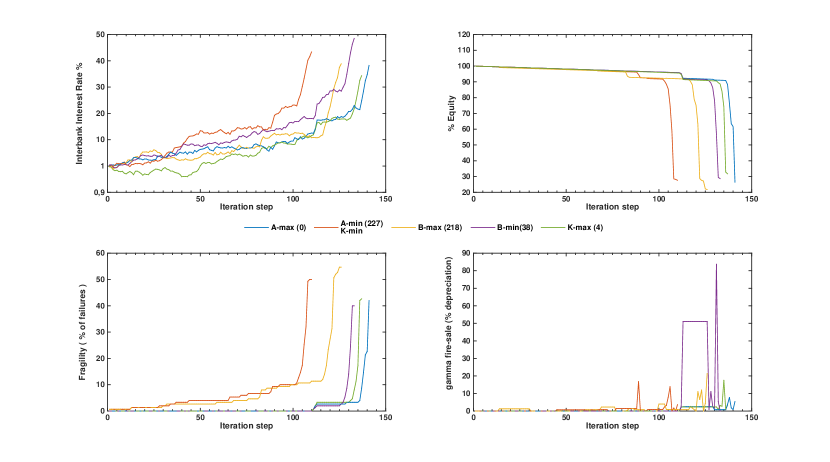
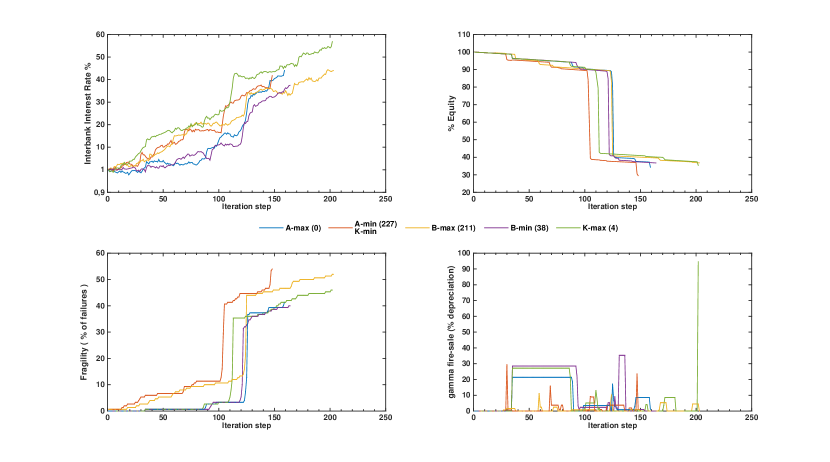
We now present results of our ABM simulations (Table 1 reports the list of parameter values we use). Firstly, we look at the dynamics of a single realization of the system. Figures 1, 2 and 3 report results of the model run on balance sheet data of some representative years: 2004, 2008 and 2013, respectively. These are the extremal years of the dataset at our disposal plus the year of the global financial crisis666Results for other years are reported in the Supplementary Materials, Figures from S1 to S7.. These figures show various important quantities characterizing the market at different iteration steps : interest rate (upper left panels), percentage of total residual equity (upper right panels), percentage of defaulted banks (lower left panels) and the depricing factor (lower right panels). The different trajectories refer to different model configurations, in which we systematically hit a given bank with the exogenous shock . Thus, the line -max (-min) refer to being the biggest (smallest) bank in terms of total assets; the line -max (-min) to being the bank with the highest (lowest) leverage; the line -max (-min) to being the bank with most (less) bilateral contracts in the interbank market.
Looking at the figures, the first striking observation is that the ABM dynamics converge to the market freeze condition much faster in 2008 than in the other years. Indeed, the maximum interest rate which can be sustained by the market is also much lower in 2008. Actually, final values of reached both in years 2004 and 2013 appear to be unreasonably high, meaning that the interbank market is rather stable to the proposed dynamics. The total residual equity in the market and the number of defaults have, as expected, a symmetrical trend, and the sudden drop of residual equity usually marks the transition to the market freeze state where the assets fire sale depreciation is maximal. Note however a significant difference between the “stable” years 2004 and 2013. In the first case, the equity drop ends with the total depletion of the market, just as in 2008. In 2013 instead the system can absorb the first systemic crash, falling into a state with non-zero residual equity. Market freeze is not triggered immediately, and even when it occurs it does not zero the value of the market. This points to the effectiveness of the new regulatory requirements on banks balance sheets in place after the crisis. Concerning the difference of system dynamics between the various shock configurations, we see in general that the convergence of the system to the market freeze is faster when the systematically shocked bank is “small” (i.e., owning a few total assets and a few contracts, and typically having high leverage). “Big” and less leveraged banks are indeed more robust to an extensive exogenous shock, but they eventually fail causing the same kind of market transition. The difference in behavior is less evident in 2013, suggesting that balance sheets became more homogeneous because of the new regulation.
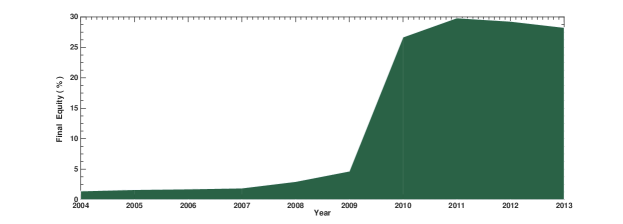
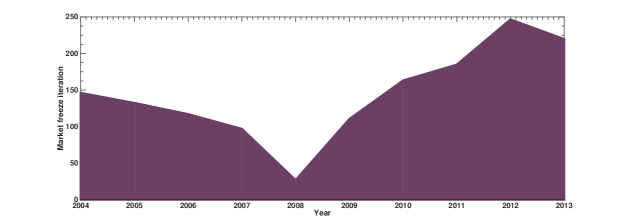
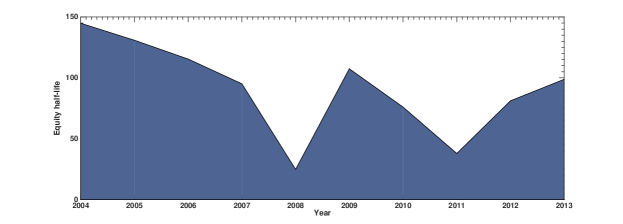
We further discuss more robust results, which are obtained as averages over 1000 realizations of the ABM dynamics and for distributed exogenous shocks (the bank to be shocked is randomly drawn at each iteration). Figure 4 supports our findings outlined above: up to years 2008-2009, the final equity in the system is basically zero, whereas, after 2010 we observe a higher resilience of the system, with a residual equity around 30% even after the freezing of the interbank market. Figure 5 shows instead the length of the ABM dynamics, namely the number of iterations for the system to converge to the market freeze. This indicator basically quantifies the maximum delay allowed for a regulatory intervention aimed at taming the crisis spiral. Notably, the minimum value of is six times smaller in 2008 than in 2012. We see that the system monotonically loses its resilience before the global crisis, and increases it afterwards. Yet, according to our previous analysis, the system converges to its final state in different ways for early and late years of our dataset. In particular, the first drop of total equity can well represent the outbreak of the crisis event. We thus introduce the half-life of the system as the iteration step at which the total equity in the system is halved, i.e., . In the whole range of years considered, this iteration corresponds to the earliest substantial equity drop. As Figure 6 shows, behaves differently from : there is an additional minimum in 2011 (the year of the European sovereign bond crisis), and the more resilient markets are now those far before the global financial crisis. Overall, according to our results, year 2008 marked a transition between a regime in which a crisis was hard to be triggered but would lead to a total market crash, and a regime in which a crisis is easier to occur but part of the system is likely to survive it.
V Discussion
In this work we have designed an agent based model to mimic the dynamics of the interbank lending market during financial crises. The model relies on banks balance sheet as the only data source, and is build on simple assumptions on banks strategic behavior during periods of financial distress. We find that as we get close to the global financial crisis of 2008, the system becomes less stable in terms of time to collapse. This feature persists after the crisis, and another peak of instability is observed in 2011. However, the consequence of a crisis are much more severe—in term of overall losses—before 2009, as afterwards the new regulation made banks balance positions more solid.
Here we focused on the dynamics interbank market because of its crucial role of liquidity provider to the financial system (Allen et al.,, 2014), and to the economy in general (Gabbi et al.,, 2015). As this system results from the usually uncollateralized (OTC) bilateral contracts between banks, it is rather sensitive to market movements (Smaga et al.,, 2016), and it can dry up under exceptional circumstances (Brunnermeier,, 2009) becoming a main vehicle for distress spreading in the financial system. The dynamics of the interbank market are driven by leverage targeting and liquidity hoarding behaviors of banks. These selfish strategies do consolidate the individual bank position, but spread financial distress through spin-off effects like interest rate increase and fire sale spillovers, which in turn induce other banks to adopt similar pro-cyclic behavior. Exceptional monetary policies by central banks are usually implemented to sustain the interbank market during periods of deteriorated creditworthiness and distributed distress. However, in order to assess the stability of the system, in our model we did not include the possibility of a regulatory intervention nor of bail-outs. Indeed, by measuring the speed at which the crisis breaks out, we provide a temporal window for implemented anti-cyclical policies to be effective in mitigating the crisis.
Acknowledgements
This work was supported by the EU projects GROWTHCOM (FP7-ICT, grant n. 611272), MULTIPLEX (FP7-ICT, grant n. 317532), SIMPOL (FP7 grant n. 610704), DOLFINS (H2020-EU.1.2.2., grant n. 640772) and CoeGSS (EINFRA, no. 676547). The funders had no role in study design, data collection and analysis, decision to publish, or preparation of the manuscript.
References
- Acemoglu et al., (2015) Acemoglu, D., Ozdaglar, A., and Tahbaz-Salehi, A. (2015). Systemic risk and stability in financial networks. The American Economic Review, 105(2):564–608.
- Acharya and Merrouche, (2013) Acharya, V. V. and Merrouche, O. (2013). Precautionary hoarding of liquidity and interbank markets: Evidence from the subprime crisis. Review of Finance, 17(1):107–160.
- Acharya and Skeie, (2011) Acharya, V. V. and Skeie, D. (2011). A model of liquidity hoarding and term premia in inter-bank markets. Journal of Monetary Economics, 58(5):436–447.
- Adrian and Shin, (2008) Adrian, T. and Shin, H. S. (2008). Liquidity and leverage. Staff Reports 328, Federal Reserve Bank of New York.
- Allen et al., (2014) Allen, F., Hryckiewicz, A., Kowalewski, O., and Tümer-Alkan, G. (2014). Transmission of financial shocks in loan and deposit markets: Role of interbank borrowing and market monitoring. Journal of Financial Stability, 15:112–126.
- Bardoscia et al., (2016) Bardoscia, M., Battiston, S., Caccioli, F., and Caldarelli, G. (2016). Pathways towards instability in financial networks. arXiv:1602.05883.
- Barucca et al., (2016) Barucca, P., Bardoscia, M., Caccioli, F., D’Errico, M., Visentin, G., Battiston, S., and Caldarelli, G. (2016). Network valuation in financial systems. ssrn:2795583.
- Battiston et al., (2015) Battiston, S., Caldarelli, G., D’Errico, M., and Gurciullo, S. (2015). Leveraging the network: A stress-test framework based on debtrank. arXiv:1503.00621.
- Beale et al., (2011) Beale, N., Rand, D. G., Battey, H., Croxson, K., May, R. M., and Nowak, M. A. (2011). Individual versus systemic risk and the regulator’s dilemma. Proceedings of the National Academy of Sciences of the United States of America, 108(31):12647–12652.
- Berrospide, (2013) Berrospide, J. M. (2013). Bank liquidity hoarding and the financial crisis: An empirical evaluation. Finance and Economics Discussion Series 03, Board of Governors of the Federal Reserve System (U.S.).
- Bluhm and Krahnen, (2011) Bluhm, M. and Krahnen, J. P. (2011). Default risk in an interconnected banking system with endogeneous asset markets. Technical Report 19, Center for Financial Studies.
- Bookstaber et al., (2014) Bookstaber, R., Paddrik, M., and Tivnan, B. (2014). An agent-based model for financial vulnerability. Technical Report 05, Office of Financial Research (OFR).
- Brunnermeier, (2009) Brunnermeier, M. K. (2009). Deciphering the liquidity and credit crunch 2007-2008. Journal of Economic Perspectives, 23(1):77–100.
- Brunnermeier and Pedersen, (2009) Brunnermeier, M. K. and Pedersen, L. H. (2009). Market liquidity and funding liquidity. Review of Financial Studies, 22(6):2201–2238.
- Caldarelli et al., (2002) Caldarelli, G., Capocci, A., De Los Rios, P., and Muñoz, M. A. (2002). Scale free networks from varying vertex intrinsic fitness. Physical Review Letters, 89(25):258702.
- Caporale et al., (2009) Caporale, G. M., Serguieva, A., and Wu, H. (2009). Financial contagion: Evolutionary optimization of a multinational agent-based model. Intelligent Systems in Accounting, Finance and Management, 16(1-2):111–125.
- Chan-Lau et al., (2009) Chan-Lau, J. A., Espinosa, M., Giesecke, K., and Solé, J. A. (2009). Assessing the systemic implications of financial linkages. Technical report, IMF Global Financial Stability Report.
- Cimini and Serri, (2016) Cimini, G. and Serri, M. (2016). Entangling credit and funding shocks in interbank markets. PLoS ONE, 8(11):e0161642.
- Cimini et al., (2015) Cimini, G., Squartini, T., Garlaschelli, D., and Gabrielli, A. (2015). Systemic risk analysis on reconstructed economic and financial networks. Scientific Reports, 5:15758.
- Cont et al., (2013) Cont, R., Moussa, A., and Santos, E. B. (2013). Network structure and systemic risk in banking systems, pages 327–368. Cambridge University Press.
- Duarte and Eisenbach, (2013) Duarte, F. M. and Eisenbach, T. M. (2013). Fire-sale spillovers and systemic risk. Staff Reports 645, Federal Reserve Bank of New York.
- Eisenberg and Noe, (2001) Eisenberg, L. and Noe, T. H. (2001). Systemic risk in financial systems. Management Science, 47(2):236–249.
- Ellul et al., (2011) Ellul, A., Jotikasthira, C., and Lundblad, C. T. (2011). Regulatory pressure and fire sales in the corporate bond market. Journal of Financial Economics, 101(3):596–620.
- Feldhütter, (2012) Feldhütter, P. (2012). The same bond at different prices: Identifying search frictions and selling pressures. Review of Financial Studies, 25(4):1155–1206.
- Fischer and Riedler, (2014) Fischer, T. and Riedler, J. (2014). Prices, debt and market structure in an agent-based model of the financial market. Journal of Economic Dynamics and Control, 48:95–120.
- Gabbi et al., (2015) Gabbi, G., Iori, G., Jafarey, S., and Porter, J. (2015). Financial regulations and bank credit to the real economy. Journal of Economic Dynamics & Control, 50:117–143.
- Gabrieli and Co-Pierre, (2014) Gabrieli, S. and Co-Pierre, G. (2014). A network view on interbank market freezes. Discussion Paper 44, Deutsche Bundesbank.
- Gai et al., (2011) Gai, P., Haldane, A., and Kapadia, S. (2011). Complexity, concentration and contagion. Journal of Monetary Economics, 58(5):453–470.
- Georg, (2013) Georg, C.-P. (2013). The effect of the interbank network structure on contagion and common shocks. Journal of Banking & Finance, 37(7):2216–2228.
- Greenwood et al., (2015) Greenwood, R., Landier, A., and Thesmar, D. (2015). Vulnerable banks. Journal of Financial Economics, 115(3):471–485.
- Hałaj and Kok, (2014) Hałaj, G. and Kok, C. (2014). Modeling emergence of the interbank networks. Working Paper Series 1646, European Central Bank.
- Haubrich and Lo, (2013) Haubrich, J. G. and Lo, A. W. (2013). Quantifying Systemic Risk. National Bureau of Economic Research.
- Hausenblas et al., (2015) Hausenblas, V., Kubicová, I., and Leăanovská, J. (2015). Contagion risk in the czech financial system: A network analysis and simulation approach. Economic Systems, 39(1):156–180.
- Klinger and Teplý, (2014) Klinger, T. and Teplý, P. (2014). Systemic risk of the global banking system-an agent-based network model approach. Prague Economic Papers, 23(1):24–41.
- Krause and Giansante, (2012) Krause, A. and Giansante, S. (2012). Interbank lending and the spread of bank failures: A network model of systemic risk. Journal of Economic Behavior & Organization, 83(3):583–608.
- Lucas et al., (2014) Lucas, I., Schomberg, N., and Turpyn, V. (2014). Agent-based approach for interbank liquidity issue. International Journal of Trade, Economics and Finance, 5(5).
- Lux and Marchesi, (1999) Lux, T. and Marchesi, M. (1999). Scaling and criticality in a stochastic multi-agent model of a financial market. Nature, 397:498–500.
- Smaga et al., (2016) Smaga, P., Wiliński, M., Ochnicki, P., Arendarski, P., and Gubiec, T. (2016). Can banks default overnight? modeling endogenous contagion on o/n interbank market. arXiv:1603.05142.
- Sorkin, (2009) Sorkin, A. R. (2009). Too Big to Fail: The Inside Story of How Wall Street and Washington Fought to Save the Financial System and Themselves. Viking, New York.
Supplementary Material