Origins of carbon-enhanced metal-poor stars
Abstract
We investigate the nature of carbon-enhanced metal poor (CEMP) stars in Milky Way (MW) analogues selected from the eagle cosmological hydrodynamical simulation. The stellar evolution model in eagle includes the physics of enrichment by asymptotic giant branch (AGB) stars, winds from massive stars, and type Ia and type II supernovae (SNe). In the simulation, star formation in young MW progenitors is bursty due to efficient stellar feedback, which enables poor metal mixing leading to the formation of CEMP stars with extreme abundance patterns. Two classes of CEMP stars emerge: those mostly enriched by low-metallicity type II SNe with low Fe yields that drive galactic outflows, and those mostly enriched by AGB stars when a gas-poor galaxy accretes pristine gas. The first class resembles CEMP-no stars with high [C/Fe] and with low [C/O], the second class resembles CEMP-s stars overabundant in s-process elements and high values of [C/O]. These two enrichment channels explain several trends seen in data: (i) the increase in the scatter and median of [C/O] at low and decreasing [O/H], (ii) the trend of stars with very low [Fe/H] or [C/H] to be of type CEMP-no, and (iii) the reduction in the scatter of [/Fe] with atomic number in metal poor stars. In this interpretation CEMP-no stars were enriched by the stars that enabled galaxies to reionise the Universe.
keywords:
stars: abundances – nuclear reactions, nucleosynthesis, abundances – dark ages, reionisation, first stars – Galaxy: abundances, formation, halo1 Introduction
Whereas hydrogen and most of the helium in the Universe were forged in the Big Bang (Alpher et al., 1948), other elements were predominantly synthesised in stars (e.g. Burbidge et al., 1957). The standard model of stellar evolution includes three main channels of such ‘metal’ enrichment: (i) Massive stars, M⊙, that burn He ashes hydrostatically yielding predominantly elements (of which the nucleus consists of an integer number of particles and hence an even number of protons, such as C, O, Mg, Ne, Si, etc), imprinting a characteristic ‘odd-even’ elemental abundance pattern. These stars explode as core-collapse type II SNe, with neutron capture r-process and trans-Fe elements produced during explosive nucleosynthesis. (ii) Intermediate mass stars () that produce mainly C and O as well as s-process elements, that are brought to the surface and lost in a stellar wind or planetary nebula following the star’s ascent up the asymptotic giant branch (AGB). (iii) Type Ia SNe with significant Fe yields, and that are plausibly the result of mass transfer in a binary star that pushes the SN progenitor over the Chandrasekhar limit. The abundance pattern in stars reflects the extent to which these channels operate and how effective stellar ejecta mix with star-forming gas, see e.g. Nomoto et al. (2013) for a review.
The lifetimes of the progenitors of these three channels are quite different. The short lifetimes ( Myr) of massive stars suggest that star forming gas will be rapidly enriched with elements; the increase in the abundance of C from AGB stars, and Fe from type Ia SNe, delayed by Myrs. The consequences of such timed release of elements is evident in the high111The metallicity, , is the mass fraction in metals - elements more massive than helium. The common notation denotes the number (or mass) ratio of elements X and Y, relative to that in the Sun. Here we take the solar abundances from Table 1 of Wiersma et al. (2009b) but this may not be the case for the data to which we compare our results. Differences in the assumed solar abundances are small compared to the large variations discussed here. abundances of elliptical galaxies in which star formation is rapidly suppressed following a burst (Segers et al., 2016). On the other hand, if star formation is quiescent, abundances of stars in a low- galaxy will increase slowly, with, for example, [C/O] increasing with metallicity , until eventually the abundances reflect the yield of the full stellar initial mass function (IMF).
The abundance patterns of Milky Way (MW) stars that formed relatively recently, such as the Sun for example, do not show large variations relative to the solar abundance pattern. However, the same is not true for extremely metal poor (EMP) stars (those with [Fe/H]-3 in what follows; see Beers & Christlieb (2005) for a review), which can have [C/Fe]+1 (carbon-enhanced metal poor stars, or CEMP stars in what follows). This may be caused by inefficient metal mixing, with the abundance pattern reflecting the yield of a few or even a single enriching supernova (e.g. Chan & Heger, 2016), which makes such stars valuable relics in studies of galactic archaeology (e.g Frebel & Norris, 2015). Abundance patterns different from that of the Sun are also detected in some damped Lyman- systems (DLAs) of low metallicity ([Fe/H], e.g. Cooke et al. (2011a)).
Abundances at low may therefore provide valuable clues to stellar yields at low , and to the efficiency of metal mixing during early star formation. However, the variety of patterns seen at low is baffling. The subclass of CEMP stars alone exhibits examples that show enhancements due to both s-and/or r-process elements (‘s’ for slow and ‘r’ for rapid), and stars with relatively normal abundances of neutron capture elements222Extremely metal poor stars enhanced in s-process elements, r-process elements, both, or neither, are denoted as CEMP-s, CEMP-r, CEMP-rs, and CEMP-no, respectively. (e.g. Beers & Christlieb, 2005). CEMP-s stars may result from mass transfer from an AGB companion (e.g. Aoki et al., 2007; Masseron et al., 2010), and indeed the majority - but crucially not all - CEMP-s stars show radial velocity variations (Lucatello et al., 2005; Starkenburg et al., 2014; Hansen et al., 2016). Komiya et al. (2007) claim that CEMP-r stars result from binary evolution as well, whereas for example Hansen et al. (2015) suggest that the enrichment already happened in the star’s birth-cloud. Below [Fe/H]=-3, most stars are CEMP-no, possibly because the natal gas was enriched by a single, early SN with high [C/Fe], as argued by e.g. Frebel et al. (2006).
Some observed abundance ratios at low metallicity do not appear to be consistent with any of the standard enrichment channels discussed above, possible pointing to the need for more exotic stellar models. Several authors have argued that the increase in [C/Fe] at low Z may be due to enrichment by population III stars (e.g. Umeda & Nomoto, 2003; Ryan et al., 2005; Cooke & Madau, 2014; Ishigaki et al., 2014) which might also explain the elevated [C/O] (Akerman et al., 2004; Fabbian et al., 2009; Pettini & Cooke, 2014), because their C yields are thought to be high (Chieffi & Limongi, 2004), see also Heger & Woosley (2010); Limongi & Chieffi (2012). If confirmed, this would open up the exciting possibility of studying the nature of Pop. III stars. Other abundance ratios in CEMP stars may be anomalous as well, including values of [O/Fe]4 or [Ba/Fe]-2 (see for example the review by Frebel & Norris 2015). Aoki et al. (2014) see evidence for pair-instability SNe (PISN) in the abundance pattern of an EMP star. The abundance patterns in DLAs and their relation to early star formation, are discussed by Pettini et al. (2008); Cooke et al. (2011a).
This variety of scenarios invoked to explain the abundance patterns of EMP stars and DLAs in the recent literature motivated us to examine the abundance patterns of stars in the eagle suite of cosmological hydrodynamical simulations - which does not include any of these more exotic mechanisms. As discussed in detail in the next section, eagle incorporates nucleosynthesis and enrichment from three channels: metallicity dependent nucleosynthesis in AGB stars, type Ia SNe, and elements produced during hydrostatic burning in massive stars and explosive nucleosynthesis in their subsequent type II SNe (but no specific Pop. III yields nor PISN). We examine the resulting trends in abundances, and study how these patterns reflect both metal yields at low and poor metal mixing during the onset of galaxy formation in the progenitors of galaxies like the Milky Way, the latter selection allowing comparison to data.
In Section 2 we describe the details of our simulation. In section 3 we describe the origin of CEMP stars in eagle, including a discussion of why the simulation predicts the appearance of two branches, CEMP-s and CEMP-no. We compare to data when possible, and in particular in section 4. We summarise in section 5.
2 The eagle simulations
eagle (Schaye et al. (2015), hereafter S15) is a suite of cosmological hydrodynamical simulations based on the cold dark matter model of structure formation with parameters taken from the Planck Collaboration et al. (2014) paper. The simulations were performed with the gadget-3 code, based on the public Tree-SPH code of Springel (2005), with changes to the numerical hydrodynamics scheme and new subgrid prescriptions for numerically unresolved physical processes relevant to galaxy formation (S15). The numerical parameters of the subgrid modules were calibrated to reproduce the redshift galaxy stellar mass function, galaxy sizes, and the stellar mass - black hole mass relation, as described by Crain et al. (2015). In this paper we use the simulation labelled L0100N1504 in Table 2 of Schaye et al. (2015); the SPH particle mass is M⊙.
Full details of the subgrid modules and modification to the gadget-3 code used in eagle can be found in S15, we summarise them very briefly here. Modifications to the code include the anarachy SPH implementation described by Dalla Vecchia (in prep., summarised by Schaller et al. (2015)) and the time-step limiter of Durier & Dalla Vecchia (2012). Cooling and photo-heating of cosmic gas in the presence of a pervasive and time-evolving UV/X-ray and cosmic microwave background is implemented as described by Wiersma et al. (2009a). Star formation is implemented following Schaye & Dalla Vecchia (2008), whereby star forming gas particles are converted stochastically to collisionless ‘star’ particles in a way that simulated galaxies follow the Kennicutt-Schmidt law (Kennicutt, 1998).
Star particles in the simulation represent a simple stellar population (SSP) with a Chabrier (2003) stellar initial mass function (IMF) in the mass range [0.1,100] M⊙. As stars evolve, they enrich surrounding gas particles, spreading mass lost according to the SPH formalism; feedback from stars heat the gas as described by Dalla Vecchia & Schaye (2012). eagle tracks 11 elements (H, He, C, N, O, Ne, S, Ca, Si, S, Fe) as well as a ‘total’ metallicity variable, through the timed release of elements from the three channels summarised in the Introduction: SNe of types Ia and II (and winds from the massive star progenitors of type II SNe) and AGB stars. Metallicity-dependent yields were taken from Woosley & Weaver (1995) for type II SNe, from Marigo (2001) and Portinari et al. (1998) for intermediate mass stars, and from model W3 of Thielemann et al. (2003) for type Ia SNe (see Wiersma et al. 2009b for full details and the Appendix for an illustration of some characteristic yields of these channels)333There can be an uncertainty in the yields, roughly of a factor of 2, however, this does not affect our results significantly as the abundances shown in the forthcoming sections vary by orders of magnitude. . We track the contribution to Fe from SNe of type Ia, and the total mass from each of the three enrichment channels, separately. This allows us to determine which of the three nucleosynthetic channels tracked (AGB, Type Ia, and massive stars and their SN type II descendants) dominates the enrichment of a given element. To do so we combine the mass acquired through a particular channel, together with the nucleosynthetic yield of a particular element. For example, a high abundance of carbon relative to say oxygen would indicate the dominance of the AGB channel. This prediction can be verified by calculating the relative amount of metals acquired through the AGB channel compared to that acquired from massive stars.
Observed CEMP stars are often classified as CEMP-s or CEMP-no based on their barium abundance. Unfortunately the eagle enrichment model does not track barium directly. However, since eagle tracks the fraction of mass of any gas or star particle that it received from the AGB enrichment channel, we can estimate the Ba abundance approximately in post-processing. We do so by multiplying this mass fraction by the Ba yield of an AGB star. For the latter, we use the yields of a 3 M⊙ AGB star from the models of Straniero et al. (2014). This allows us to compare to observed abundances in section 4 below.
The three enrichment channels discussed in the introduction are associated with stars of different initial mass (intermediate mass stars give rise to AGB enrichment, binary stars with low or intermediate mass components to type Ia SNe, and massive stars to type II SNe). If metal mixing is poor in real galaxies, as we will argue below, then it would be possible for mostly pristine star forming gas to be enriched predominantly by just one of these three channels - and hence for the appearance of stars that reflect mostly one of the three channels. However this is not possible in eagle, because a simulation star particle represents a simple stellar population: as a simulation star particle ages it enriches its surroundings with both AGB and type Ia ejecta together, following a more rapid enrichment by massive stars. To allow us to study the enrichment by AGB stars separately444 This simulation limitation is not so crucial for enrichment by type II SNe, because the time-scale for enrichment by type II SNe is much shorter and gas can move significant distances between instances of type II enrichment and that by the other two channels., we neglect enrichment by the type Ia channel altogether when computing stellar abundances. We can do so, because eagle tracks the mass acquired through the type Ia channel separately. This implies that we underestimate the Fe abundances of stars.
To identify halos and galaxies in the simulation, we use subfind (Springel et al., 2001; Dolag et al., 2009) as described by McAlpine et al. (2016); the Milky Way-like galaxies whose stellar abundances we compare to observations below, are taken to be central galaxies that inhabit dark matter halos of mass . We will refer to stars in Milky Way-like eagle galaxies as ‘eagle stars’ in what follows.
To mitigate numerical sampling issues related to enrichment, eagle additionally tracks ‘SPH smoothed’ (as opposed to ‘particle’) abundances, as discussed by Wiersma et al. (2009b). However, our confidence in the accuracy of predicted SPH-smoothed absolute abundances is still limited: we are confident that an eagle star with smoothed Fe abundance of , say, has indeed a low metallicity, but we cannot reliably distinguish stars with from those with . However, relative abundances are not affected by sampling since they are sourced by the same star particles for all enrichment channels, and hence are much more reliable. To select candidate CEMP stars in eagle, we will therefore select star particles with low abundance, [Fe/H], and examine their abundance pattern.
Star formation in low-mass halos, , is bursty in eagle: the SFR is high when low-mass halos are gas rich, but the feedback from young massive stars may then remove a large fraction of the gas, dramatically reducing the SFR. We will refer to this phenomenon, whereby the gas fraction varies significantly as a function of time, as ‘breathing’. Although the level of stochasticity of the gas fractions in such small halos may be affected by numerical sampling of the feedback events, simulations of high- dwarf galaxies at much higher resolution typically show similar bursty behaviour (e.g. Wise et al., 2014; Kimm & Cen, 2014; El-Badry et al., 2016), and therefore appear to be a generic prediction of current models. Such bursts may play an important role in reionisation (Sharma et al., 2016a, b).
3 Two paths to CEMPs
In this section, we show that eagle galaxies harbour two different branches of CEMP stars, which result from the interplay between the two nuncleosynthetic channels and strong feedback from type II SNe in the first galaxies.
3.1 An AGB origin for the [C/O] upturn at low
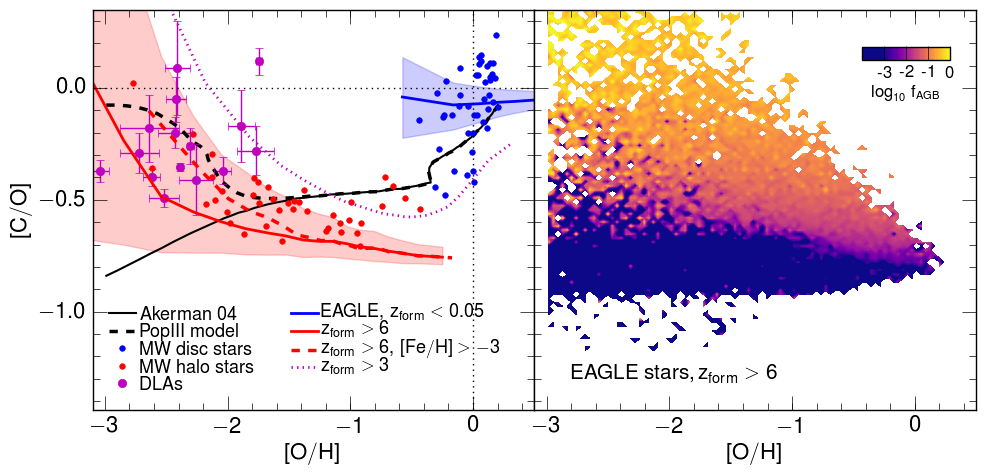
Standard enrichment models predict that [C/O] increases with metallicity, as illustrated by the model of Akerman et al. (2004) plotted in black in Fig. 1, because massive stars drive stronger winds at higher (Henry et al., 2000; Carigi, 2000; Akerman et al., 2004; Cescutti et al., 2009; Romano et al., 2010). Consistent with this prediction, we find that eagle stars formed recently, below , and with metallicity [O/H], have [C/O], whereas older stars of lower metallicity, [O/H], have [C/O].
However, abundances of MW-stars display a surprising upturn in [C/O] below [O/H] (Akerman et al., 2004; Fabbian et al., 2009), and similarly high values of [C/O] are detected in low- DLAs (Pettini et al., 2008; Cooke et al., 2011b; Pettini & Cooke, 2014) and Cooke et al. (2017) (red and magenta circles with error bars refer to MW stars and DLAs in Fig. 1, respectively). It has been suggested that this upturn is a signature of enrichment by Pop. III stars (Akerman et al., 2004; Pettini & Cooke, 2014). In addition to an upturn, the scatter555Error bars on the observed abundances of stars are not plotted in the figure, but are typically small compared to the scatter between points. in [C/O] increases dramatically with decreasing [O/H].
Abundances in eagle (red curve) show a similar upturn and increase in scatter (shaded red region), even though Pop. III stars are not part of the model. Because the simulation tracks enrichment by each channel separately, we know that the high values of [C/O] at low [O/H] reflect enrichment by AGB stars instead. This is demonstrated in the right panel of Fig. 1, where we plot [O/H] versus [C/O] for eagle stars formed early, before , coloured by the ratio
| (1) |
where and are the metal mass received by the precursor gas particle of a star from the AGB and massive stars channels, respectively. Stars with are only enriched by AGB stars (coloured yellow), and have the most extreme values of [C/O].
The stars that have such low [O/H] and high [C/O] formed before (corresponding Gyr after the Big Bang, and only Myrs after the formation of the first stars in this simulation, at ), which, maybe somewhat surprisingly, is late enough for the AGB channel to become active. Indeed, the stellar evolution models of Marigo (2001) and Portinari et al. (1998) used in eagle, already yield significant AGB enrichment 300 Myrs after the stars formed. Since the upturn is due to carbon produced by AGB stars in eagle, oxygen - which is not synthesised significantly in AGB stars (yields of [C/O], see below)- is low. We recall that type II SNe and their massive progenitor stars, produce both carbon and oxygen, and their yields do not become highly super-solar in [C/O]. Therefore, if our interpretation is correct, the high [C/O] stars are not so much carbon-enhanced as oxygen-poor. Somehow, the birth cloud of these stars avoided being enriched by massive stars for long enough, Myr, to allow AGB progenitors to evolve and release carbon.
The model by Salvadori & Ferrara (2012) predicts a population of [C/O] systems with [O/H], which results from enrichment of primordial gas by Pop. III stars. They associate the gentle increase in [C/O] of those systems with increasing [O/H] with enrichment by low- AGB stars. In contrast, the origin of the high values of [C/O] at low [O/H] in eagle is not due to Pop. III enrichment, since the model does not include such stars, and we explore the nature of this enrichment in more detail next.
3.2 Breathing and poor metal mixing
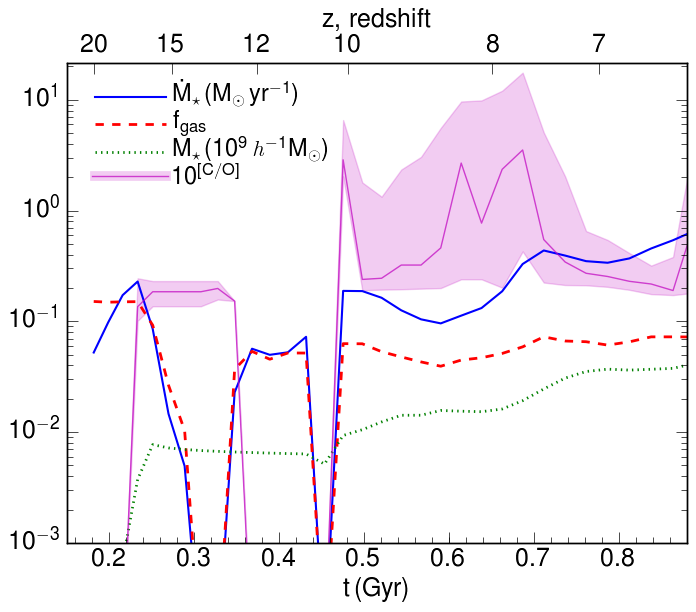
Enrichment due to massive short-lived stars should occur soon after a galaxy starts forming stars. As a consequence, the second generation of stars would be expected to show the signature of such stars - high abundances of elements, for example. However, the abundance pattern of newly formed stars will only reflect the average yields of their precursors if the ejecta of stars mix well with star-forming gas. In eagle, as shown in Fig. 2, and in many other simulations as well (e.g. Wise et al., 2014; Kimm & Cen, 2014; El-Badry et al., 2016), star formation is very bursty and the gas content varies significantly with time in the low-mass progenitors in which low MW-stars form - we refer to this as breathing modes. When the galaxy exhales by ejecting gas, star formation mostly shuts down until new, predominantly pristine, gas accretes. If this happens on a timescale of the order of 300 Myrs later, then accreted pristine gas may be enriched by AGB stars, and stars that form from this gas may show the signature in their abundance pattern of AGB yields - high [C/O], for example. To demonstrate that this scenario occurs in eagle, we first show that stars that form in low mass eagle galaxies show very large variations in the value of , predicting low signatures of pure AGB/type II enrichment. We next demonstrate that this is related to the gas fraction of the galaxy at the time the stars form.
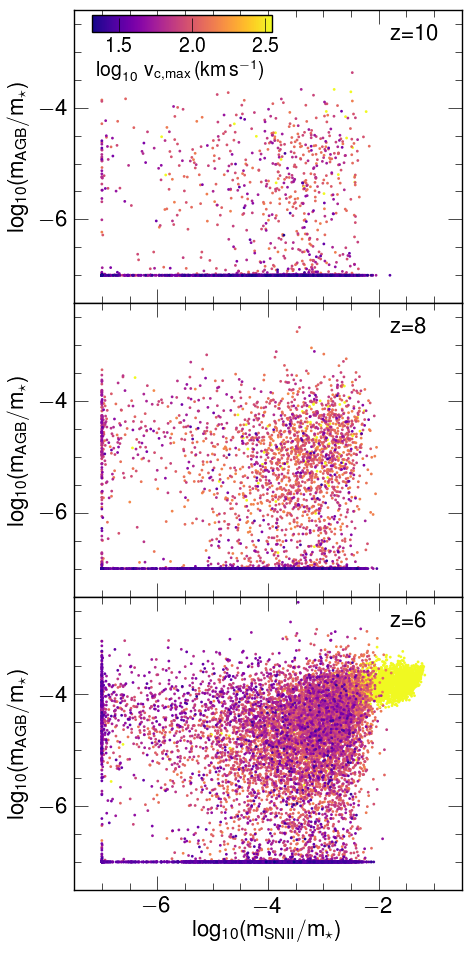
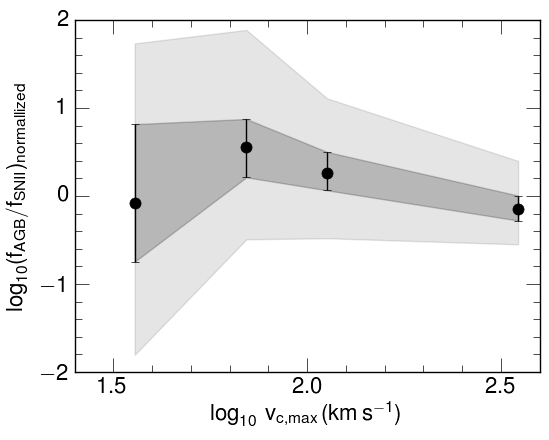
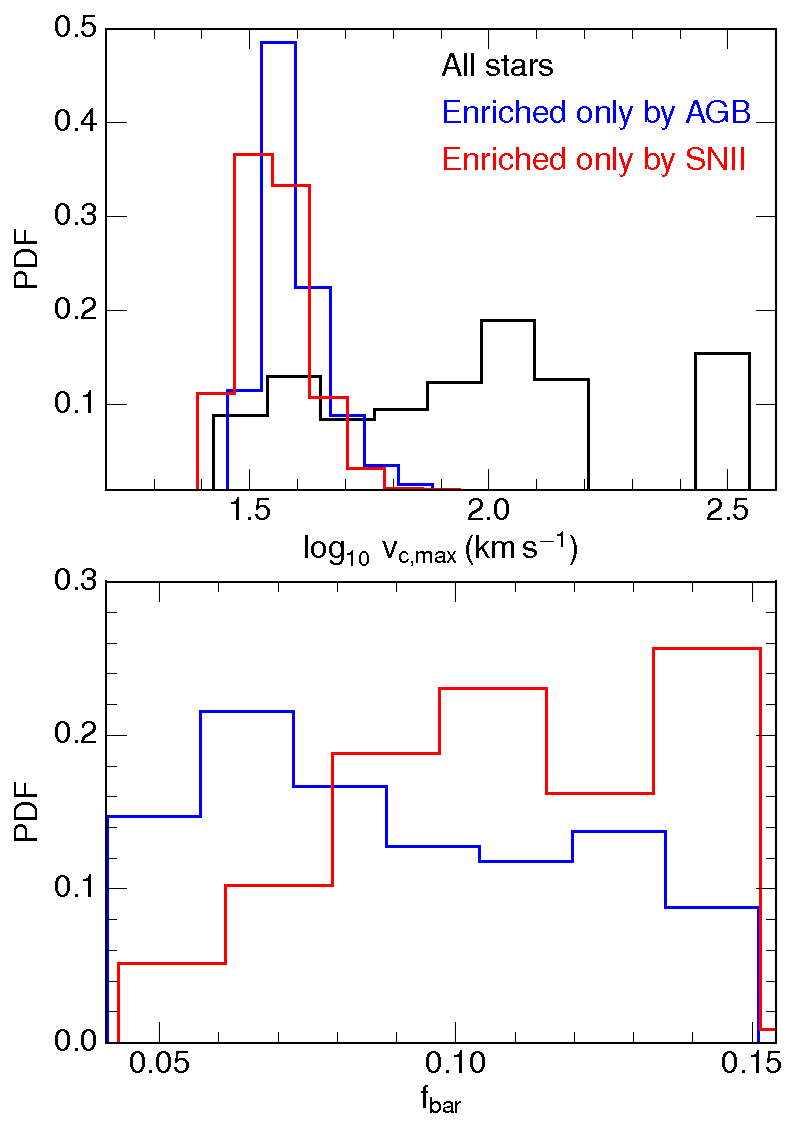
Figures 3 and 4 demonstrate our first claim. Galaxies in halos at with low maximum circular velocity, km s-1, form stars with a wide range of . At (top panel of Fig. 3), they form stars with the abundance patterns characteristic for massive star enrichers (plotted at ) but few show evidence for AGB enrichment, simply because the Universe is too young ( Gyr) for the AGB channel to operate actively. At later times (middle and bottom panels at and in Fig. 3), more stars with high appear, including stars with which exhibit nearly pure AGB abundances (e.g. [C/O]). Such extreme abundance patterns occur far less at higher ; see for example the abundant cloud of orange/yellow points (km s-1), which correspond to stars that form in galaxies in which AGB and type II channels are well mixed. Figure 4 shows in more detail that the scatter in increases dramatically below km s-1, consistent with the first claim.
The second claim is demonstrated in Fig.5: stars with extreme AGB/type II abundances form predominantly in halos with km s-1 (top panel). Those stars predominantly enriched by AGB stars form in halos that, in addition, have low baryon fractions (bottom panel). The latter are small halos where gas has been removed by a previous star burst, with pristine cosmologically accreted gas now being enriched by the early generation of AGB stars, imprinting their characteristic AGB pattern on any newly forming stars. Conversely, gas rich dwarfs (with high baryon fractions) form stars that may have the characteristic pattern of yields for massive stars. The associated type II SNe then power the outflow that causes the galaxy to become gas poor.
How realistic is it that this scenario also applies to early galaxies, given the limitations of eagle? It is based on two aspects of the simulation: (i) large variations in the gas fraction of dwarfs (breathing), and (ii) poor metal mixing of stellar ejecta. A large mass loading factor - the ratio , of the galactic outflow rate to the star formation rate - for high- dwarfs, appears to be an essential ingredient of simulations (e.g. Muratov et al., 2015). Although galactic winds are indeed ubiquitously observed at high-, measuring is challenging; see for example the review by Veilleux et al. (2005). However, metals are observed in the intergalactic medium (Cowie et al., 1995), even at low density (e.g. Schaye et al., 2003), and it is likely that these were deposited there by galactic outflows originating predominantly from dwarf galaxies (Madau et al., 2001; Theuns et al., 2002; Booth et al., 2012). Such wind episodes may also explain the high escape fractions of ionising photons, needed to reionise the Universe (Sharma et al., 2016a). Given this evidence we posit that this aspect of our model is relatively well established.
How about the poor metal mixing of enriched gas? If, as is likely, winds are (at least partially) powered by massive stars, then it would not be surprising if the metallicity of the wind were higher than that of the general ISM, since it is the hot ejecta that provides the buoyancy for the gas to escape. This is indeed seen in the parsec-resolution wind simulations of Creasey et al. (2015). Therefore, it is plausible that dwarfs can indeed lose a significant fraction of SNe type II products in a galactic outflow. But is it then possible for the remaining gas to be enriched by massive stars to the extremely low levels seen in the simulation? Observations by James et al. (2016) of nearby star forming galaxies show that metals are poorly mixed on scales of 50 parsecs, which they attribute to poor metal mixing around young, star forming regions. Another line of observational evidence comes from the work of Schaye et al. (2007), who identified a large population of photo-ionised, compact (sizes 100 pc), metal rich () clouds in the redshift intergalactic medium. They attribute the existence of these clouds to poor metal mixing. Given these two lines of observational evidence, we argue that poor metal mixing in the dwarfs is at least plausible.
The scenario of poor metal mixing in breathing galaxies makes another testable prediction: if metal mixing is indeed poor, especially during the early stages of star formation in a galaxy, we would expect to see stars enriched (almost exclusively) by SNe of type II as well. We investigate observational evidence for this next.
3.3 The origin of stars with high [C/Fe] at low [C/O]
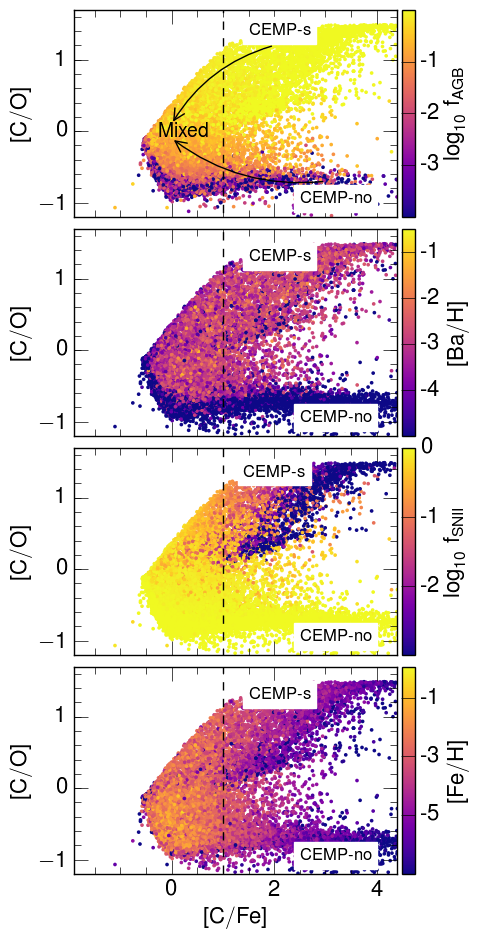
The combination of poor metal mixing and the existence of two channels of carbon production (AGB and massive stars) gives rise to two classes of CEMP stars in eagle: those enriched by AGB stars (which produce s-process elements such as Ba but do not produce Fe), and those enriched by massive stars and their type II SNe descendants with Fe-poor ejecta. In the models of Woosley & Weaver (1995) used in eagle, the latter occur for a wide range of progenitor masses at low metallicity, , and also for progenitor masses of M⊙ for (see also Fig. 11 below).
Massive stars are the first to enrich their surroundings as a galaxy begins to form stars in eagle666We remind the reader that the simulation does not include any Pop. III stars. Their yields are extremely high in [C/Fe] and slightly subsolar in [C/O] (see the Appendix). As time progresses and lower mass type II SNe explode, the enrichment pattern shifts to yields with lower [C/Fe] and values of [C/O] still within dex from solar. The timescale for this initial enrichment is of course very short, with the Myr lifetime of a 20 M⊙ star much shorter than the Myr delay of the appearance of the first AGB events. As time progresses, we therefore expect the abundance of star forming gas that is enriched by massive stars to shift along the bottom arrow in the top panel of Fig. 6.
However, if feedback from these massive stars is able to eject a significant fraction of the star-forming gas, then star formation may temporarily halt. When it resumes, following cosmological accretion of mostly pristine gas, AGB stars may enrich star-forming gas yielding stars with high [C/Fe] and [C/O]. Such stars correspond to the upper branches at high [C/Fe] in Fig. 6. As time progresses and the potential well that hosts the galaxy grows in mass, dramatic outflows following bursts diminish, and AGB and type II (and type I as well) ejecta mix well, so that when [Fe/H], the ratios of [C/Fe] and [C/O] of star forming gas eventually approach solar values.
This scenario predicts that at very low , the value of [C/O] should increase with decreasing [O/H] fastest for stars with [Fe/H]. Indeed, the MW progenitors in which these stars form are sufficiently evolved to host AGB stars, and it is their C-rich but O-poor ejecta that cause [C/O] to increase. At even lower [Fe/H], the MW progenitor is too young to host significant numbers of AGB stars and enrichment is mostly by massive stars: it is in these MW progenitors that the stars with lower [C/O] at very low [O/H] in Fig. 1 form.
4 Observational evidence for the two paths of CEMP formation
In the previous section we demonstrated that there are two distinct paths that yield CEMP stars in eagle - enrichment by AGB stars when the galaxy is gas poor, and enrichment by low Z type II SNe when the galaxy is gas rich. While both paths lead to stars with high [C/Fe] characteristic of CEMP stars, abundance ratios of other elements can be quite different, for example the AGB path leads to stars with much higher [C/O]. It should be possible to directly test the existence and frequency of occurrence of these different paths by measuring the fraction of CEMP stars with high s-process element abundances (CEMP-s stars).
The s-process in AGB stars (slow neutron capture when the neutron bombardment of seed nuclei occurs at a rate that is slow compared to the decay rate of neutron rich nuclei) is thought to originate overabundances of Sr, Yr, Zr, and Ba, La, Ce, Pr and Nd, see e.g. Sneden et al. (2008) for a review. Therefore the prediction from eagle is that the high [C/O] CEMP stars are of sub-type CEMP-s, whereas the low [C/O] stars are not s-process enhanced and of type CEMP-no (see Beers & Christlieb (2005) for definition of these classes).
Because both Ba and Fe produce relatively strong lines in stellar spectra, even at low abundance, and with Ba characteristic for s-process nucleosynthesis, a high value of [Ba/Fe] is often used observationally to distinguish between CEMP-s ([Ba/Fe]) and CEMP-no classes. Other abundance ratios have been used as well. The dominance of the AGB channel over that of type II SNe in eagle, is quantified unambiguously by from Eq. (1) - the fraction of metal mass received from the AGB - and hence this is an excellent measure of whether a star is of type CEMP-s (high ) or CEMP-no (low ), as we did in the previous section. However this ratio is of course not directly observable. The two branches of CEMP stars shown in Fig. 6 both result from channels that may not produce any Fe at all (the AGB channel for the top branch, and low type II SNe that also do not produce Fe). This, combined by our neglect of metals produced by type Ia SNe for the reasons explained in Section 2, makes [Ba/Fe] a poor classifier for CEMP-s stars in eagle. Fortunately, Fig. 6 demonstrates that correlates very well with [Ba/H] as well as with [Ba/C], and we will therefore classify a CEMP star as CEMP-s when [Ba/H]-2. This classification applied to observed stars compiled in the saga database777http://saga.sci.hokudai.ac.jp/wikidoku.php by Suda et al. (2008) yields the same division in CEMP-s versus CEMP-no as a classification based on [Ba/Fe]. In summary we select CEMP stars in eagle using the criteria [C/Fe] following Beers & Christlieb (2005) and denote them CEMP-s if [Ba/H] and CEMP-no otherwise.
4.1 CEMP-s versus CEMP-no stars: comparison with observations
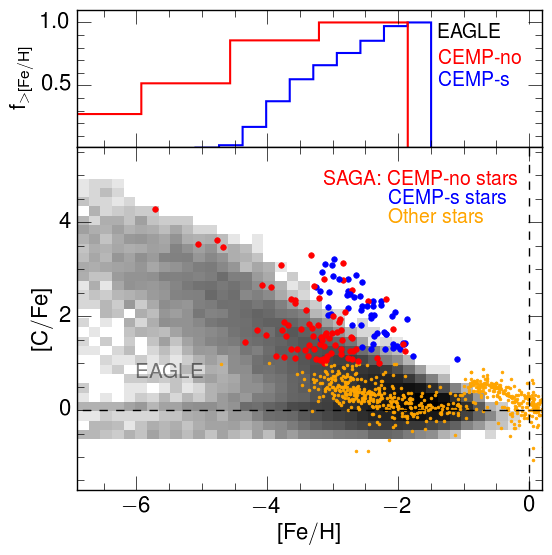
In Fig. 7, we plot [C/Fe] versus [Fe/H] for eagle stars (depicted as a 2D greyscale histogram) and compare this to abundance ratios of Milky Way stars taken from the saga database. The observed stars are collected from a diverse set of observational surveys with a variety of selection criteria. The database is therefore not a complete sample of CEMP stars.
In red giant branch (RGB) stars, carbon can be burned to nitrogen (Roederer et al., 2014; Placco et al., 2014). When this happens, the measured (surface) carbon abundance does not reflect the initial carbon abundance. We therefore exclude observed RGB stars (using the criterium that their surface gravity ) from Figs. 7 and 8. However, we do show RGB stars in Figs. 9 and 10 below: their [C/] are lower limits, but [/Fe] is unaffected by nuclear burning.
In both eagle and saga, the scatter and the median value of [C/Fe] increase with decreasing [Fe/H] (Fig. 7). The observations show a cluster of points with [C/Fe] at , most of which are CEMP-s stars and a significant fraction of these are believed to be binary stars. The enhancement in carbon and s-process elements in these binary stars likely results from mass transfer. Since eagle does not include binary star evolution, it comes as no surprise that they are absent from the simulation.
At low values of [Fe/H], observed stars with [C/Fe] are mostly of type CEMP-no (see red dots in Fig. 7, although observed CEMP-s stars with [Fe/H] do exist, Yoon et al. (2016)), suggesting a link between the level of Fe enrichment and CEMP-no nature (e.g. Aoki et al., 2007; Yong et al., 2013). This is true in eagle as well: most stars with low [Fe/H] are of type CEMP-no (see also the upper panel of Fig. 7).
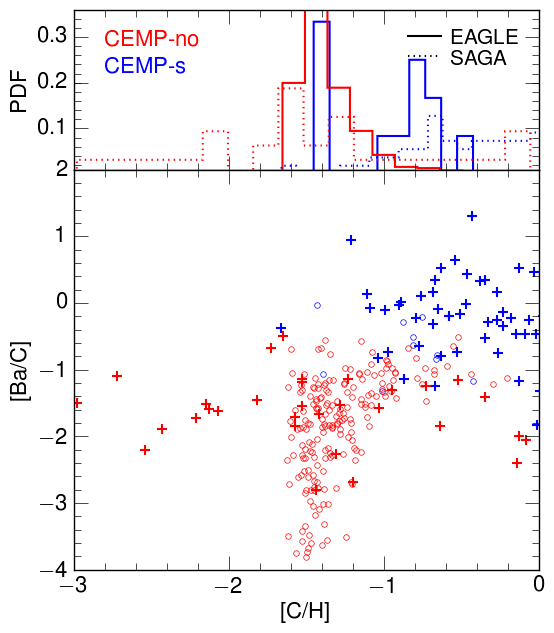
Yoon et al. (2016) argue that [C/H] is tighter correlated with s-process enhancement than [Ba/Fe] or [Fe/H] discussed by Aoki et al. (2007), with CEMP-no stars dominating at low [C/H] and CEMP-s stars at higher [C/H]. This is true in eagle as well: CEMP stars with [C/H] tend to be high in [Ba/C] and are s-process enriched (blue circles), whereas those with lower C abundance are mostly CEMP-no (red circles), as illustrated in Fig. 8. A similar division is apparent for observed stars in the saga database (blue and red crosses, respectively). The top panel of the figure depicts the corresponding probability distributions: we remind the reader that the saga database is not complete nor unbiased.
Although the distribution of [C/H] and the correlation with s-process enhanced CEMP stars clearly differ in detail between eagle and the observed stars from the saga database, nevertheless we see that eagle reproduces the observed trend of CEMP-no stars dominating at lower [C/H]. The underlying reason is that such stars formed out of mostly pristine gas enriched very early on by high mass, low stars, whereas the CEMP-s stars appear later on, forming from gas enriched with C by AGB stars. Given the longer evolutionary timescale of AGB stars, this gas is generally more enriched including having a higher Fe abundance, as we discussed in reference to Fig. 7.
Summarising, we find that in eagle, CEMP-s and CEMP-no stars form as a result of two very different enrichment paths. CEMP-s stars form due to AGB stars enriching primordial gas accreting onto a gas poor dwarf galaxy. They are iron poor because the AGB channel does not produce iron. CEMP-no stars, on the other hand, result from enrichment by metal poor massive stars, whose type II iron yields are very low. These two branches standout when plotting [C/O] vs [C/Fe] at high [C/Fe], with the first branch having [C/O] and the second branch having [C/O]. This scenario also predicts correctly the observed predominance of CEMP-no stars at low [C/H]. We examine observational evidence for enrichment by low SNe for the appearance of the lower branch of CEMP stars in Fig. 6 next.
4.2 Signatures of low- enrichment by massive stars
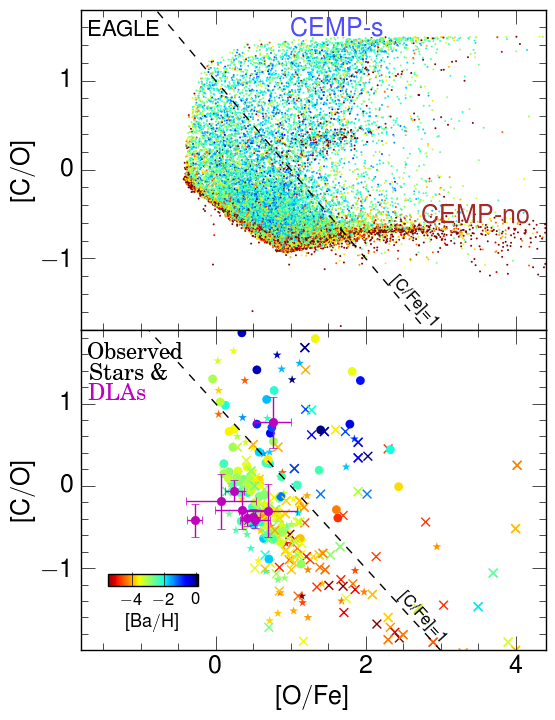
The two classes of CEMP stars ([C/Fe]) are very well separated in Fig. 9, top panel: a branch enriched by massive stars yielding [C/O] and a wide range of [O/Fe], and the AGB enriched stars with [C/O] and [O/Fe] (where the Fe and most of the O comes from a small contribution from type II SNe). The bottom panel of the figure plots observed stars taken from the saga database (filled circles show detections, crosses indicate upper limits, colour represents [Ba/H] as in the top panel). The data also show a large scatter in [C/O], with a trend of lower [Ba/H] stars having higher [O/Fe] which is also clearly seen in eagle. We note that the two branches that stand-out in the simulation (top panel) are not so obvious in the data, however clearly there is an indication of the separation between type-s (bluer points, high barium) and type-no (redder points, low barium) stars.
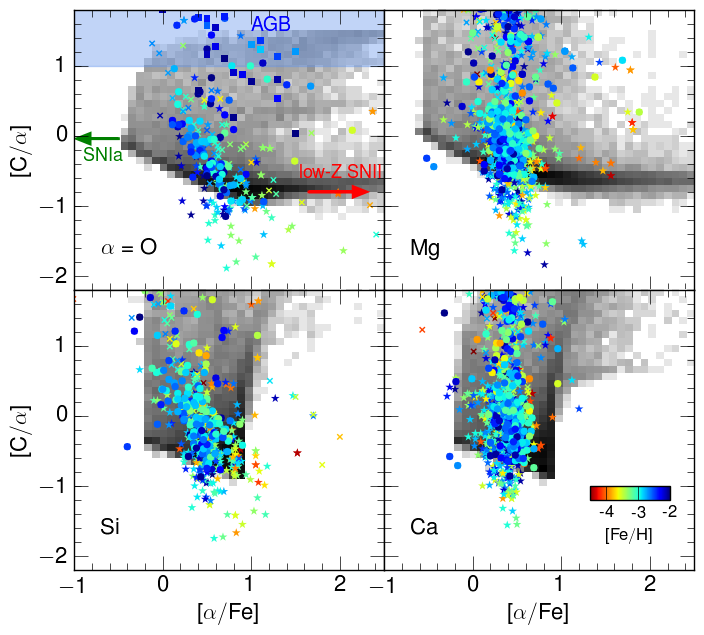
It is difficult to conclusively identify these two sub-classes of CEMP stars observationally in a diagram such as Fig. 9, because measuring the abundance of oxygen is more difficult than of other elements. The upper branch can be distinguished by the high s-process element abundance of such stars, a clear signature of the AGB origin of carbon in CEMP stars as we did in the previous section. The relative abundance pattern of -elements may provide a signature of the stars on the lower branch. This is explored in Fig. 10, where we compare results from eagle in grey, to observed patterns of metal poor stars with [Fe/H] from the saga database (coloured symbols); crosses indicate limits in cases of non-detection of one or more elements.
In the top left panel showing [C/O] versus [O/Fe], we have labelled the loci in which eagle stars are predominantly enriched by AGB or by massive low- stars. Mixing these channels leads to the appearance of stars with [O/Fe], and [C/O]. The [C/O] value differs significantly from either AGB yields, [C/O], or yields from low- massive stars, [C/O]. Although the upper AGB branch is well populated by observed stars, the presence of observed stars on the lower type II branch may be less convincing.
However, a well documented feature of type II SNe yields at low- is the dramatic decrease in the scatter in [/Fe] along the sequence of increasing atomic number from O-Mg-Si to Ca. In the Woosley & Weaver (1995) yields used in eagle, this is clearly seen in the truncation of the grey region at large values of [/Fe] particularly for Si and Ca for low values of [C/]. The physical reason underlying this trend is that in the ‘onion’ model of the SN precursor, the Ca shell lies close to the Fe core, whereas the Si, Mg and O shells, in that order, lie further away. If the central core is strongly bound, as is the case at low , the SN explosion may not be sufficiently energetic to expel deep stellar layers. In that case Ca and Fe should track each other much more tightly than O and Fe, say, which is indeed what the grey eagle pattern shows. Note in particular the sharp reduction in the number of eagle stars above [Si/Fe] or [Ca/Fe] at low [C/].
Interestingly, a sharp reduction in the scatter of [/Fe] for higher is also seen in the data. In addition, the number of observed stars dramatically decreases above [Mg/Fe], [Si/Fe] or [Ca/Fe]. Recall that in the eagle simulation, AGB stars are the source of carbon in the stars with high [C/]. Therefore stars with low [C/] are enriched mainly by massive stars. Such stars are clearly present in the saga data as well.
5 Summary
We have explored the origin of carbon enhanced metal poor (CEMP) stars in the eagle cosmological hydrodynamical simulation (Schaye et al., 2015), selecting galaxies by halo mass to be ‘Milky Way’-like. Data for Milky Way CEMP stars can be classified in a number of subclasses (Beers & Christlieb, 2005; Frebel & Norris, 2015), and we compared observed and simulated abundance patterns such as [C/O] versus [C/Fe] or [O/H]. Both simulation and data show a large increase in the scatter of [C/O] and an upturn in the median value of [C/O] at low [O/H].
The trends in the simulation are a consequence of two effects that relate to the nature of star formation in eagle at high : bursty star formation combined with poor metal mixing in low-mass galaxies. Stellar feedback powers strong outflows in eagle galaxies, particularly in those with maximum circular velocity km s-1 at . The absence of gas following a star burst then prevents further star formation for sufficiently long times that, when eventually cosmological accretion replenishes the galaxy with mostly pristine gas, stars form but not before their natal gas is enriched by ejecta from asymptotic giant branch (AGB) stars. The simulation therefore yields two distinct classes of CEMP stars: AGB enriched stars, and stars enriched by massive stars whose descendant type II SNe have low iron yields (which result from either massive low progenitors, or M⊙ more metal rich progenitors, in the models of Woosley & Weaver (1995)).
The relatively large differences in the lifetimes of the progenitor stars that cause the enrichment ( Myrs for the AGB stars, but Myrs for a 20 M⊙ star) then leads to the prediction that the lowest [Fe/H] stars that are enriched first are of type CEMP-no, whereas CEMP-s stars form only at slightly higher [Fe/H], as is also observed (Aoki et al., 2007; Yong et al., 2013), as discussed by Frebel et al. (2006). These classes are also distinguished by their [C/H], (see Fig. 8 and Yoon et al. (2016)), and by their [C/O] (see Fig. 9).
This scenario makes several testable predictions. A mixture of carbon enrichment by AGB and Fe-poor massive stars is consistent with the large observed scatter in [C/O] at low [O/H], and is also evidence for poor (metal) mixing of the yields from the AGB and massive star enrichment channels. The observed abundances of -elements compared to carbon show similar trends with atomic number, , as seen in eagle; a dramatic decrease in the scatter of [/Fe] for Si and Ca, compared to O and Mg. In the simulations, this pattern is imprinted by low- SNe type II yields. The physical mechanism that underlies this is that the core region of massive low stars is so strongly bound that its content is more difficult to eject by the SN explosion. This then also explains the correspondingly high [C/Fe] yields.
The abundance patterns of very low stars are an imprint of the bursty nature of star formation at high , and therefore may provide a handle on the nature of the galaxies that reionized the Universe. Sharma et al. (2016a, b) proposed a model whereby these high- starbursts drive outflows that clear channels through which ionising photons can escape, with binary stars potentially an important source of photons (Stanway et al., 2016). This model may explain why the escape fraction of ionising photons increases dramatically with redshift, as is necessary if galaxies are the dominant sources of reionising photons (e.g. Haardt & Madau, 2012; Khaire et al., 2015).
The bursty nature of these galaxies, combined with poor metal mixing, leaves signatures in the abundance patterns of the stars that formed at those early times, with CEMP-no stars forming predominantly during the gas rich burst phase, and CEMP-s stars forming during a more quiescent phase. In other words, high- star formation determines the elemental abundances of low- stars. This line of reasoning prompts us to speculate that CEMP stars were enriched by the stars that enabled galaxies to reionise the Universe.
Acknowledments
We thank our eagle colleagues (J. Schaye, M. Schaller, R. Crain and R. Bower) for allowing us to use the simulations. We also thank Max Pettini for insightful comments and Stefania Salvadorri for providing the data in her published paper, and for comments on an earlier draft. This work was supported by the Science and Technology Facilities Council [grant number ST/F001166/1], by the Interuniversity Attraction Poles Programme initiated by the Belgian Science Policy Office ([AP P7/08 CHARM]). We used the DiRAC Data Centric system at Durham University, operated by the Institute for Computational Cosmology on behalf of the STFC DiRAC HPC Facility (www.dirac.ac.uk). This equipment was funded by BIS National E-Infrastructure capital grant ST/K00042X/1, STFC capital grant ST/H008519/1, and STFC DiRAC is part of the National E-Infrastructure. The data used in the work is available through collaboration with the authors. M. S. is supported by an STFC post-doctoral fellowship. R. J. C. is supported by a Royal Society University Research Fellowship.
Appendix
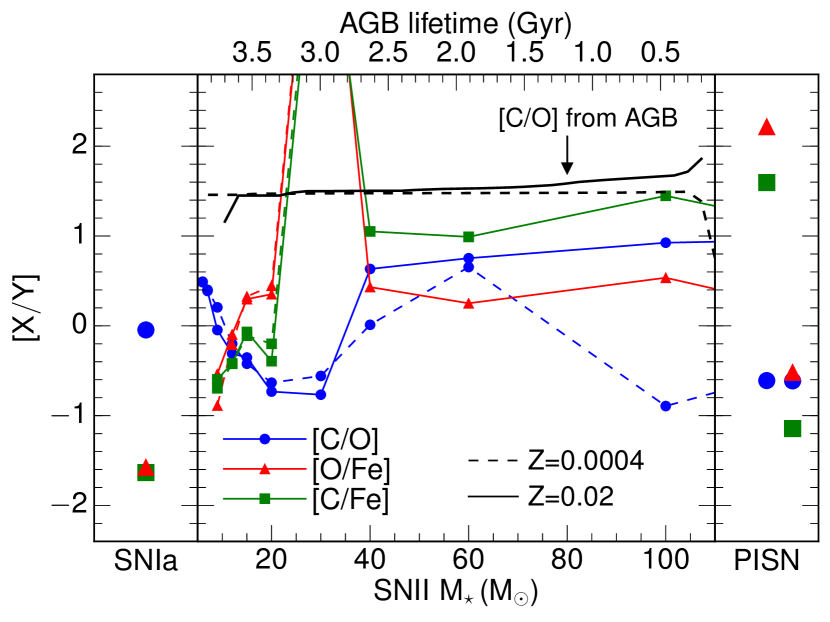
The stellar evolution models and yields used in eagle, implemented as described by Wiersma et al. (2009b), are illustrated in Fig. 11. Abundance ratios of [C/O], [O/Fe] and [C/Fe], are plotted in blue, red and green, respectively. Yields for type Ia SNe, taken from model W3 of Thielemann et al. (2003), are plotted in the left inset. Metallicity-dependent yields for type II SN explosion from Woosley & Weaver (1995) combined with the contribution from the progenitor star, are plotted as a function of the mass, , of the progenitor star in the central panel, for (solar abundance pattern) progenitors with (solid lines), and (dashed lines). These models yield very low or no Fe for M⊙ for either abundance. In addition, stars more massive than M⊙ also do not produce iron for . This is a consequence of the core of the SN precursor being so strongly bound that Fe is not ejected during the explosion (also called ‘fall back’). At (very) low this occurs because of the absence of 12C to kick-start the CNO cycle when the proto-star heats up, consequently it contracts further to reach higher densities and temperatures. The central panel also shows the [C/O] yield of mass ejected by AGB stars as a function of lifetime (top -axis, for solar abundance stars using the models of Marigo (2001) and Portinari et al. (1998). The right inset shows abundances for pair-instability SNe of progenitor mass M⊙ and M⊙ (left and right set of points, respectively), taken from Heger & Woosley (2002).
References
- Akerman et al. (2004) Akerman C. J., Carigi L., Nissen P. E., Pettini M., Asplund M., 2004, A&A, 414, 931
- Alpher et al. (1948) Alpher R. A., Bethe H., Gamow G., 1948, Physical Review, 73, 803
- Aoki et al. (2007) Aoki W., Beers T. C., Christlieb N., Norris J. E., Ryan S. G., Tsangarides S., 2007, ApJ, 655, 492
- Aoki et al. (2014) Aoki W., Tominaga N., Beers T. C., Honda S., Lee Y. S., 2014, Science, 345, 912
- Beers & Christlieb (2005) Beers T. C., Christlieb N., 2005, ARA&A, 43, 531
- Booth et al. (2012) Booth C. M., Schaye J., Delgado J. D., Dalla Vecchia C., 2012, MNRAS, 420, 1053
- Burbidge et al. (1957) Burbidge E. M., Burbidge G. R., Fowler W. A., Hoyle F., 1957, Reviews of Modern Physics, 29, 547
- Carigi (2000) Carigi L., 2000, Rev. Mexicana Astron. Astrofis., 36, 171
- Cescutti et al. (2009) Cescutti G., Matteucci F., McWilliam A., Chiappini C., 2009, A&A, 505, 605
- Chabrier (2003) Chabrier G., 2003, PASP, 115, 763
- Chan & Heger (2016) Chan C., Heger A., 2016, ArXiv e-prints
- Chieffi & Limongi (2004) Chieffi A., Limongi M., 2004, ApJ, 608, 405
- Cooke et al. (2011a) Cooke R., Pettini M., Steidel C. C., Rudie G. C., Jorgenson R. A., 2011a, MNRAS, 412, 1047
- Cooke et al. (2011b) Cooke R., Pettini M., Steidel C. C., Rudie G. C., Nissen P. E., 2011b, MNRAS, 417, 1534
- Cooke & Madau (2014) Cooke R. J., Madau P., 2014, ApJ, 791, 116
- Cooke et al. (2017) Cooke R. J., Pettini M., Steidel C. C., 2017, MNRAS, 467, 802
- Cowie et al. (1995) Cowie L. L., Songaila A., Kim T.-S., Hu E. M., 1995, AJ, 109, 1522
- Crain et al. (2015) Crain R. A. et al., 2015, MNRAS, 450, 1937
- Creasey et al. (2015) Creasey P., Theuns T., Bower R. G., 2015, MNRAS, 446, 2125
- Dalla Vecchia & Schaye (2012) Dalla Vecchia C., Schaye J., 2012, MNRAS, 426, 140
- Dolag et al. (2009) Dolag K., Borgani S., Murante G., Springel V., 2009, MNRAS, 399, 497
- Durier & Dalla Vecchia (2012) Durier F., Dalla Vecchia C., 2012, MNRAS, 419, 465
- El-Badry et al. (2016) El-Badry K., Wetzel A., Geha M., Hopkins P. F., Kereš D., Chan T. K., Faucher-Giguère C.-A., 2016, ApJ, 820, 131
- Fabbian et al. (2009) Fabbian D., Nissen P. E., Asplund M., Pettini M., Akerman C., 2009, A&A, 500, 1143
- Frebel et al. (2006) Frebel A. et al., 2006, ApJ, 652, 1585
- Frebel & Norris (2015) Frebel A., Norris J. E., 2015, ARA&A, 53, 631
- Haardt & Madau (2012) Haardt F., Madau P., 2012, ApJ, 746, 125
- Hansen et al. (2016) Hansen T. T., Andersen J., Nordström B., Beers T. C., Placco V. M., Yoon J., Buchhave L. A., 2016, A&A, 588, A3
- Hansen et al. (2015) Hansen T. T., Andersen J., Nordström B., Beers T. C., Yoon J., Buchhave L. A., 2015, A&A, 583, A49
- Heger & Woosley (2002) Heger A., Woosley S. E., 2002, ApJ, 567, 532
- Heger & Woosley (2010) Heger A., Woosley S. E., 2010, ApJ, 724, 341
- Henry et al. (2000) Henry R. B. C., Edmunds M. G., Köppen J., 2000, ApJ, 541, 660
- Ishigaki et al. (2014) Ishigaki M. N., Tominaga N., Kobayashi C., Nomoto K., 2014, ApJ, 792, L32
- James et al. (2016) James B. L., Auger M., Aloisi A., Calzetti D., Kewley L., 2016, ApJ, 816, 40
- Kennedy et al. (2011) Kennedy C. R. et al., 2011, AJ, 141, 102
- Kennicutt (1998) Kennicutt, Jr. R. C., 1998, ARA&A, 36, 189
- Khaire et al. (2015) Khaire V., Srianand R., Choudhury T. R., Gaikwad P., 2015, ArXiv e-prints : 1510.04700
- Kimm & Cen (2014) Kimm T., Cen R., 2014, ApJ, 788, 121
- Komiya et al. (2007) Komiya Y., Suda T., Minaguchi H., Shigeyama T., Aoki W., Fujimoto M. Y., 2007, ApJ, 658, 367
- Limongi & Chieffi (2012) Limongi M., Chieffi A., 2012, ApJS, 199, 38
- Lucatello et al. (2005) Lucatello S., Gratton R. G., Beers T. C., Carretta E., 2005, ApJ, 625, 833
- Madau et al. (2001) Madau P., Ferrara A., Rees M. J., 2001, ApJ, 555, 92
- Marigo (2001) Marigo P., 2001, A&A, 370, 194
- Masseron et al. (2010) Masseron T., Johnson J. A., Plez B., van Eck S., Primas F., Goriely S., Jorissen A., 2010, A&A, 509, A93
- McAlpine et al. (2016) McAlpine S. et al., 2016, Astronomy and Computing, 15, 72
- Muratov et al. (2015) Muratov A. L., Kereš D., Faucher-Giguère C.-A., Hopkins P. F., Quataert E., Murray N., 2015, MNRAS, 454, 2691
- Nomoto et al. (2013) Nomoto K., Kobayashi C., Tominaga N., 2013, ARA&A, 51, 457
- Pettini & Cooke (2014) Pettini M., Cooke R. J., 2014, Mem. Soc. Astron. Italiana, 85, 542
- Pettini et al. (2008) Pettini M., Zych B. J., Steidel C. C., Chaffee F. H., 2008, MNRAS, 385, 2011
- Placco et al. (2014) Placco V. M., Frebel A., Beers T. C., Stancliffe R. J., 2014, ApJ, 797, 21
- Planck Collaboration et al. (2014) Planck Collaboration et al., 2014, A&A, 571, A16
- Portinari et al. (1998) Portinari L., Chiosi C., Bressan A., 1998, A&A, 334, 505
- Roederer et al. (2014) Roederer I. U., Preston G. W., Thompson I. B., Shectman S. A., Sneden C., Burley G. S., Kelson D. D., 2014, AJ, 147, 136
- Romano et al. (2010) Romano D., Karakas A. I., Tosi M., Matteucci F., 2010, A&A, 522, A32
- Ryan et al. (2005) Ryan S. G., Aoki W., Norris J. E., Beers T. C., 2005, ApJ, 635, 349
- Salvadori & Ferrara (2012) Salvadori S., Ferrara A., 2012, MNRAS, 421, L29
- Schaller et al. (2015) Schaller M., Dalla Vecchia C., Schaye J., Bower R. G., Theuns T., Crain R. A., Furlong M., McCarthy I. G., 2015, MNRAS, 454, 2277
- Schaye et al. (2003) Schaye J., Aguirre A., Kim T.-S., Theuns T., Rauch M., Sargent W. L. W., 2003, ApJ, 596, 768
- Schaye et al. (2007) Schaye J., Carswell R. F., Kim T.-S., 2007, MNRAS, 379, 1169
- Schaye et al. (2015) Schaye J. et al., 2015, MNRAS, 446, 521
- Schaye & Dalla Vecchia (2008) Schaye J., Dalla Vecchia C., 2008, MNRAS, 383, 1210
- Segers et al. (2016) Segers M. C., Schaye J., Bower R. G., Crain R. A., Schaller M., Theuns T., 2016, MNRAS, 461, L102
- Sharma et al. (2016a) Sharma M., Theuns T., Frenk C., Bower R., Crain R., Schaller M., Schaye J., 2016a, MNRAS, 458, L94
- Sharma et al. (2016b) Sharma M., Theuns T., Frenk C., Bower R. G., Crain R. A., Schaller M., Schaye J., 2016b, ArXiv e-prints
- Sneden et al. (2008) Sneden C., Cowan J. J., Gallino R., 2008, ARA&A, 46, 241
- Springel (2005) Springel V., 2005, MNRAS, 364, 1105
- Springel et al. (2001) Springel V., White S. D. M., Tormen G., Kauffmann G., 2001, MNRAS, 328, 726
- Stanway et al. (2016) Stanway E. R., Eldridge J. J., Becker G. D., 2016, MNRAS, 456, 485
- Starkenburg et al. (2014) Starkenburg E., Shetrone M. D., McConnachie A. W., Venn K. A., 2014, MNRAS, 441, 1217
- Straniero et al. (2014) Straniero O., Cristallo S., Piersanti L., 2014, ApJ, 785, 77
- Suda et al. (2008) Suda T. et al., 2008, PASJ, 60, 1159
- Theuns et al. (2002) Theuns T., Viel M., Kay S., Schaye J., Carswell R. F., Tzanavaris P., 2002, ApJ, 578, L5
- Thielemann et al. (2003) Thielemann F.-K. et al., 2003, in From Twilight to Highlight: The Physics of Supernovae, Hillebrandt W., Leibundgut B., eds., p. 331
- Umeda & Nomoto (2003) Umeda H., Nomoto K., 2003, Nature, 422, 871
- Veilleux et al. (2005) Veilleux S., Cecil G., Bland-Hawthorn J., 2005, ARA&A, 43, 769
- Wiersma et al. (2009a) Wiersma R. P. C., Schaye J., Smith B. D., 2009a, MNRAS, 393, 99
- Wiersma et al. (2009b) Wiersma R. P. C., Schaye J., Theuns T., Dalla Vecchia C., Tornatore L., 2009b, MNRAS, 399, 574
- Wise et al. (2014) Wise J. H., Demchenko V. G., Halicek M. T., Norman M. L., Turk M. J., Abel T., Smith B. D., 2014, MNRAS, 442, 2560
- Woosley & Weaver (1995) Woosley S. E., Weaver T. A., 1995, ApJS, 101, 181
- Yong et al. (2013) Yong D. et al., 2013, ApJ, 762, 27
- Yoon et al. (2016) Yoon J. et al., 2016, ArXiv e-prints: 1607.06336