Limits on the effective quark radius from inclusive ep scattering & contact interactions at HERA
Abstract:
The high–precision HERA data allow searches for up to TeV scales “Beyond the Standard Model” contributions to electron–quark scattering. Combined H1 and ZEUS measurements of inclusive deep inelastic cross sections in neutral and charged current ep scattering are considered, corresponding to a luminosity of around 1 fb-1. A new approach to the beyond the Standard Model analysis of the inclusive data is presented; simultaneous fits of parton distribution functions and contributions of “new physics” processes are performed. Considered are possible deviations from the Standard Model due to a finite radius of quarks, described within the quark form-factor model, and due to new electron-quark interactions in the framework of contact interactions (CI). The resulting 95% C.L. upper limit on the effective quark radius is cm. The limits on the CI mass scale extend up to 10 TeV depending on the CI scenario.
1 Introduction
Precision measurements of deep inelastic scattering (DIS) cross sections at high values of negative four-momentum-transfer squared, , allow searches for contributions beyond the Standard Model (BSM), even far beyond the centre-of-mass energy of the interactions. For many “new physics” scenarios, cross sections can be affected by new kinds of interactions in which virtual BSM particles are exchanged. As the HERA kinematic range is assumed to be far below the scale of any new physics, all such interactions can be approximated as contact interactions (CI).
The H1 and ZEUS collaborations measured inclusive scattering cross sections at HERA from 1994 to 2000 (HERA I) and from 2002 to 2007 (HERA II), collecting together a total integrated luminosity of about 1 fb-1. All inclusive data were combined [1] to create one consistent set of neutral current (NC) and charged current (CC) cross-section measurements for scattering with unpolarised beams. The inclusive cross sections were used as input to a QCD analysis within the DGLAP formalism, resulting in a PDF set denoted as HERAPDF2.0.
For the results presented in this contribution a new approach to the beyond the Standard Model analysis was used, based on the simultaneous fits of parton distribution functions and contributions of the “new physics” processes. This is the only method to properly take into account the possibility that the PDF set may already have been biased by partially or totally absorbing previously unrecognised BSM contributions.
2 New physics scenarios
One of the possible parameterisations of deviations from SM predictions in scattering is achieved by assigning an effective finite radius to electrons and/or quarks. The expected modification of the SM cross section can be described using a semi-classical form-factor approach [2]. For small deviations, the SM predictions for the cross sections are modified, approximately, to:
| (1) |
where and are the mean-square radii of the electron and the quark, respectively, related to new BSM energy scales. In the present analysis, only the possible finite spatial distribution of the quark was considered and the electron was assumed to be point-like (). Both positive and negative values of were considered.
Four-fermion contact interactions (CI) represent an effective theory which describes low-energy effects due to physics at much higher energy scales. CI model the effects of heavy leptoquarks, additional heavy weak bosons and electron or quark compositeness. The CI approach is not renormalizable and is only valid in the low-energy limit. The vector contact-interaction currents considered here are represented by additional terms in the Standard Model Lagrangian:
| (2) |
where the sum runs over electron and quark helicities and quark flavors. The couplings describe the helicity and flavor structure of the contact interactions. It was assumed that the same coupling structure applies to all quarks. The one-parameter scenarios considered in the presented study are defined by sets of four coefficients, , as shown in Tab. 1, and the coupling strength, , or compositeness scale, :
| (3) |
Models that differ in the overall sign of the coefficients are distinct because of the interference with the SM. In two scenarios listed in the upper part of Tab. 1 parity is violated, while it is conserved in the remaining scenarios.
3 QCD+BSM fit procedure
The QCD analysis method used for the HERAPDF2.0 determination [1] was extended to take into account the possible BSM contributions to the expected cross section values, as described in the published ZEUS analysis [3]. The PDFs of the proton are described at a starting scale of GeV2 in terms of parameters. These parameters, denoted in the following (or for the set of parameters), together with the possible contribution of BSM phenomena (described by the effective quark-radius squared, , or the CI coupling ) are fit to the data using a method. For CI, the formula is given by:
| (4) |
Here, and are the respective measured cross-section values and pQCD+BSM cross-section predictions at the point . The quantities , and are the relative correlated systematic, relative statistical and relative uncorrelated systematic uncertainties of the input data. The components, , of the vector represent the correlated systematic shifts of the cross sections (given in units of ), which are fit to the data together with the PDF parameter set and the CI coupling . The summations extend over all data points and all correlated systematic uncertainties . The definition used for this analysis results in a d.o.f. of 1.2 for the SM (N), like already observed for HERAPDF2.0 NLO fit [1].
4 Limit-setting procedure
The limits on the BSM contributions are derived in a frequentist approach using the technique of replicas [3, 4]. Replicas are sets of cross-section values that are generated by varying all cross sections randomly according to their known uncertainties. For the analysis presented here, multiple replica sets were used, each covering cross-section values on all points of the grid used in the QCD fit. For an assumed true value of the quark-radius squared, , or of the CI coupling, , replica data sets were created by taking the reduced cross sections calculated from the nominal PDF fit (with no BSM contribution) and scaling them with the cross section ratio given by the quark form factor or the CI cross section formula. This resulted in a set of cross-section values , which were then varied randomly within statistical and systematic uncertainties taken from the data, taking correlations into account. All uncertainties were assumed to follow Gaussian distributions.
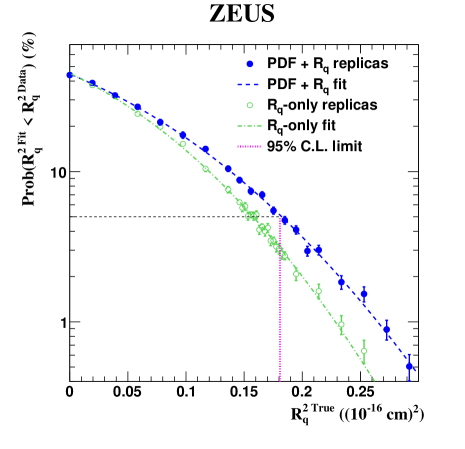
Details of the limit setting procedure are described in this paragraph for the case of the quark form-factor model. The value of the quark-radius squared determined by the fit to the data themselves, , was taken as a test statistic, to which values from fits to replicas, , were compared. To set limits, MC replica cross-section sets for each value of were used for a QCD fit with the PDF parameters and the quark radius as free parameters. The probability to obtain a value smaller than that obtained for the actual data, Prob(), was then studied as a function of , as illustrated in Fig. 1. Positive (negative) values that, in more than 95% of the replicas, result in the fitted radius squared value, , greater than (less than) that obtained for the data, , were excluded at the C.L.
5 Results
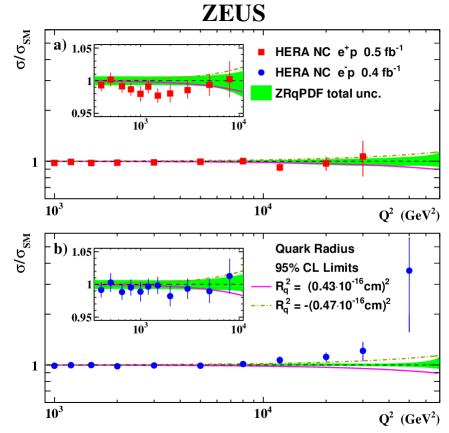
The results of the limit-setting procedure using the simultaneous fit to PDF parameters and , based on sets of Monte Carlo replicas testing the possible cross-section modifications due to a quark form factor, yield the C.L. limits on the effective quark radius of
see Fig. 2. Taking into account the possible influence of quark radii on the PDF parameters is necessary as demonstrated in Fig. 1, because the limits that would be obtained for fixed PDF parameters are too strong by about 10%.
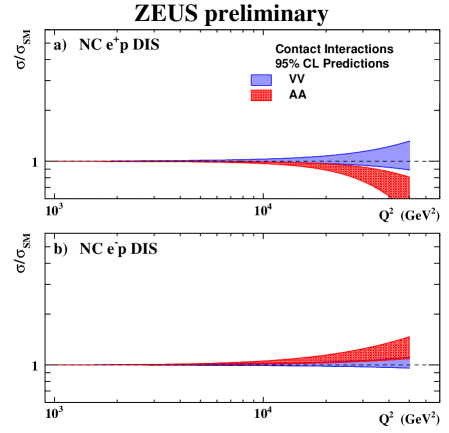
Shown in Fig. 3 are cross section deviations from the SM predictions corresponding to the coupling range allowed at C.L. for VV and AA contact-interaction models. No significant deviation from the SM predictions is observed for the VV scenario. The probability of obtaining larger best-fit coupling for , i.e. the probability that an experiment, assuming the validity of the SM, would produce a value of greater than that obtained from the data, , is %. However, for the AA scenario the best value is for , corresponding to a compositeness scale of about 6.2 TeV. The SM probability is %, which corresponds to a deviation of about . Negative values of are excluded at C.L. for this scenario and the allowed range for positive couplings corresponds to compositeness scales TeV.
The C.L. limits on the compositeness scale for different CI models are summarised in Tab. 1. Also for the VA and X1 scenarios, an improved description of the HERA data can be obtained. The largest improvement is d.o.f. of -0.005 for the X1 model. The probability that the SM experiment reproduces the data is . The fits suggest that the SM underestimates NC DIS cross sections at the highest for , while the predictions for are slightly too high.
| ZEUS preliminary | |||||||||
| HERA 1994-2007 data | |||||||||
| C.L. limits (TeV) | |||||||||
| Coupling structure | Measured | Expected | |||||||
| Model [ | , | , | , | ] | (%) | ||||
| LL [ | +1, | 0, | 0, | 0] | 22.0 | 4.5 | 5.9 | 6.2 | 6.5 |
| RR [ | 0, | 0, | 0, | +1] | 32.9 | 4.4 | 5.7 | 6.1 | 5.6 |
| VV [ | +1, | +1, | +1, | +1] | 14.7 | 9.5 | 11.0 | 11.4 | 24.8 |
| AA [ | +1, | , | , | +1] | - | 4.8 - 10.4 | 7.9 | 7.8 | 0.7 |
| VA [ | +1, | , | +1, | ] | - | 3.6 - 10.1 | 4.1 | 4.1 | 2.1 |
| X1 [ | +1, | , | 0, | 0] | - | 3.5 - 6.6 | 5.7 | 5.6 | 0.3 |
| X2 [ | +1, | 0, | +1, | 0] | 10.8 | 6.8 | 7.8 | 8.2 | 23.1 |
| X4 [ | 0, | +1, | +1, | 0] | 7.6 | 9.2 | 8.0 | 8.6 | 60.3 |
References
- [1] H1 and ZEUS Collaborations, H. Abramowicz et al., Combination of Measurements of Inclusive Deep Inelastic Scattering Cross Sections and QCD Analysis of HERA data, Eur. Phys. J. C 75 (2015) 580 [arXiv:1506.06042].
- [2] G. Kopp et al., Bounds on radii and magnetic dipole moments of quarks and leptons from LEP, SLC and HERA, Z. Phys. C 65 (1995) 545 [hep-ph/9409457].
- [3] ZEUS Collaboration, H. Abramowicz et al., Limits on the effective quark radius from inclusive scattering at HERA, Phys.Lett. B757 (2016) 468 [arXiv:1604.01280].
- [4] O. Turkot, K. Wichmann and A.F. Żarnecki, Simplified QCD fit method for BSM analysis of HERA data [arXiv:1606.06670].