Isotope effect on the transition temperature in Fe-based superconductors:
the current status
Abstract
The results of the Fe isotope effect (Fe-IE) on the transition temperature obtained up to date in various Fe-based high temperature superconductors are summarized and reanalyzed by following the approach developed in [Phys. Rev. B 82, 212505 (2010)]. It is demonstrated that the very controversial results for Fe-IE on are caused by small structural changes occurring simultaneously with the Fe isotope exchange. The Fe-IE exponent on [, is the isotope mass] needs to be decomposed into two components with the one related to the structural changes () and the genuine (intrinsic one, ). The validity of such decomposition is further confirmed by the fact that coincides with the Fe-IE exponent on the characteristic phonon frequencies as is reported in recent EXAFS and Raman experiments.
I Introduction
Historically, the isotope effect plays an important role in elucidating the origin of the pairing interaction leading to the occurrence of superconductivity. The discovery of the isotope effect on the superconducting transition temperature in metallic Hg Maxwell50 ; Reynolds50 in the year 1950 provided the key experimental evidence for phonon-mediated pairing and leads to the subsequent formulation of the BCS theory.
An involvement of the lattice degrees of freedom into the supercarrier formation is generally considered by measuring the isotope effect exponent on :
| (1) |
( is the isotope mass and is the mass difference) and by further comparing it with the universal value as is predicted within the framework of BCS theory of electron-phonon mediated superconductivity.
In conventional phonon-mediated superconductors like simple metals, alloys, etc. , typically, ranges from 0.2 to 0.5, (see Ref. Poole00, and references therein). The only exceptions are Ru and Zr exhibiting zero isotope effect and PdH(D) with .IE-PdH1 ; IE-PdH2 The negative isotope effect of PdH(D) is explained, however, by the presence of strong lattice anharmonicty caused by the double-well potential in the proton (deuteron) bond distribution.Yussouff95 A similar finding exists in organic superconductors where the H(D) isotope effect changes sign as compared, e.g., to 34S, 13C, and 15N isotope replacements, (see Ref. Schlueter01, and references therein). Again, an unusually strong anharmonic lattice dynamics are attributed to this observation.Schlueter01 ; Whangbo97 Recently the sine changed isotope effect was reported by Stucky et al.Stucky_arxiv_2016 for doped SrTiO3 which supposed to be purely phonon-mediated superconductor. It was observed that the substitution of the natural 16O atoms by the heavier isotope 18O causes a giant (of the order of 50%) enhancement of . Also the magnetic critical field is increased by a factor . Such a strong impact on and , with a sign opposite to conventional superconductors was assumed to be caused by strong coupling to the ferroelectric soft modes of SrTiO3.
The cuprate high-temperature superconductors (HTS) are characterized by a vanishingly small but positive isotope effect exponent in optimally doped compounds which increases in a monotonic way upon decreasing doping.Batlogg87 ; Franck91 ; Franck94 ; Zech94 ; Zhao01 ; Khasanov_JPCM_2003 ; Khasanov_PRB_2003 ; Khasanov04 ; Khasanov04a ; Khasanov06 ; Khasanov07 ; Khasanov08 ; Tallon05 ; IE_Bi2201-2212-2223 ; Khasanov08_IE-phase-diagram For the optimally doped cuprate HTS the smallest value of the oxygen-isotope exponent was obtained for YBa2Cu3O7-δ and Bi2Sr2Ca2Cu3O10+δ, while it reaches for Bi2Sr1.6La0.4CuO6+δ.Batlogg87 ; Franck91 ; Franck94 ; Zech94 ; IE_Bi2201-2212-2223 ; Khasanov08_IE-phase-diagram In addition, it was demonstrated that in underdoped materials exceeds substantially the BCS limit .Franck91 ; Franck94 ; Zhao01 ; Khasanov08_IE-phase-diagram
It is worth to emphasize here that the values of both, the oxygen and the copper isotope exponents in cuprate HTS are always positive. Similar tendencies, with the only few above mentioned exceptions, are also realized in a case of conventional phonon-mediated superconductors.
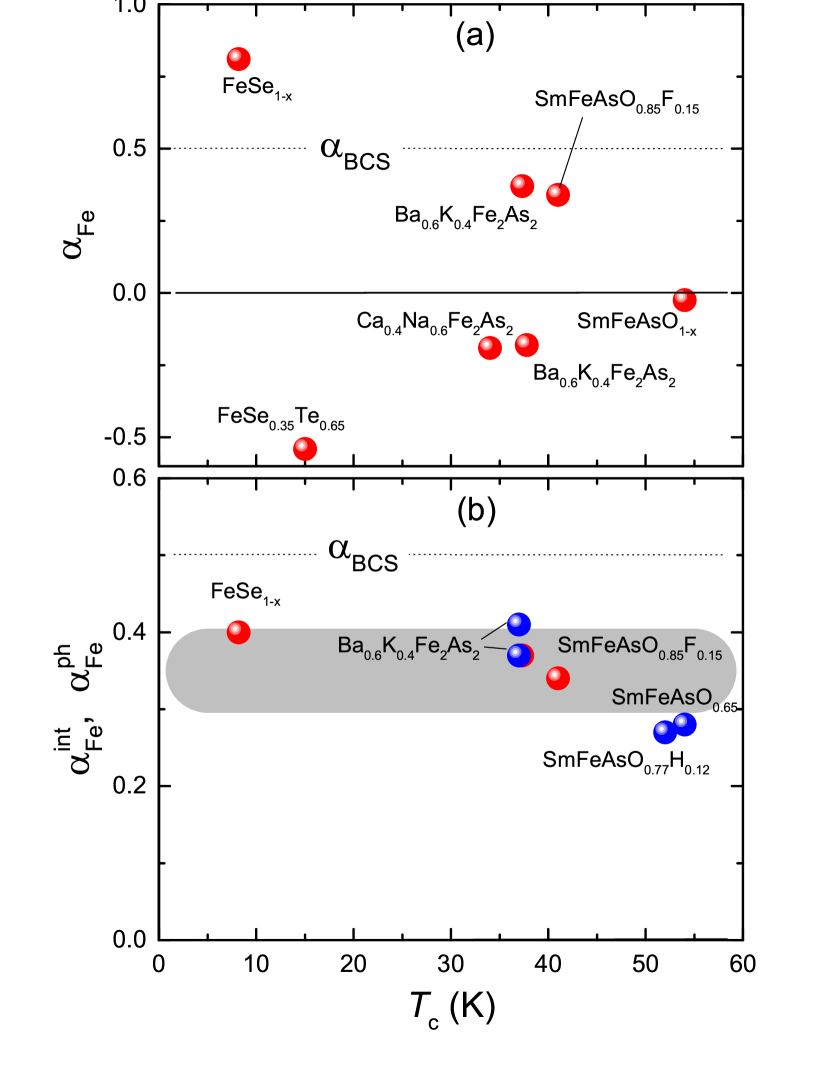
Since the discovery of high-temperature superconductivity in Fe-based compounds few experiments to study the isotope effect on in this new class of materials were performed. The current statement of isotope effect studies on Fe-based HTS remains, however, rather contradicting. Liu09 ; Shirage09 ; Shirage10 ; Khasanov10_FeSe-isotope ; Tsuge_PP_2012 ; Tsuge_JPCS_2014 Liu et al.Liu09 and Khasanov et al.Khasanov10_FeSe-isotope have found a positive Fe isotope effect (Fe-IE) exponent for Ba0.6K0.4Fe2As2 ( K), SmFeAsO0.85F0.15 ( K), and FeSe1-x ( K) with the corresponding values , 0.37(3), and 0.81(15), respectively. Note that for FeSe1-x exceeds substantially the universal BCS value . In the other studies Shirage et al. Shirage09 ; Shirage10 have reported a negative and for Ba0.6K0.4Fe2As2 ( K) and SmFeAsO1-y ( K), respectively. The negative Fe-IE exponents were also reported recently by Tsuge and co-workers for FeSe0.35Te0.65 ( K, ) and Ca0.4Na0.6Fe2As2 ( K, ).Tsuge_PP_2012 ; Tsuge_JPCS_2014 Note that the sine changed isotope effect is unlikely to stem from different pairing mechanisms going to be realized in different Fe-based superconductors. Especially, in the case of Ba0.6K0.4Fe2As2, when nominally identical samples exhibit once a positiveLiu09 and next a negative isotope exponent.Shirage09
The main purpose of the present study is to show that the very controversial results for Fe-IE on are caused by small structural changes occurring simultaneously with the Fe isotope exchange. We demonstrate that the Fe-IE exponent on needs to be decomposed into the one related to the structural changes () and the genuine (intrinsic one, ) to result in:
| (2) |
The validity of such decomposition is further confirmed by the fact that coincides with the Fe-IE exponent on the characteristic phonon frequency as is observed in EXAFS and Raman experiments.Chu_SciRep_2013 ; Singh_AIP_2016 The value of was found to be the same for representatives of various families of Fe-based superconductors and it stays in the range of in good agreement with the theory prediction of Bussmann-Holder et al.Bussmann-Holder09
The paper is organized as follows. In Section II we demonstrate the influence of the Fe isotope exchange on the crystal structure. As an example, FeSe1-x Fe-based HTS with K is considered. It is shown that the substitution of natural Fe (containing % of 56Fe) by its lighter 54Fe isotope leads not only to a shift of , but affects also the structural parameters such as the lattice parameters , , and , the lattice volume , the distance between the Se atom and Fe plane, and the Se height . Results presented in this section are adapted from Ref. Khasanov10_FeSe-isotope, . In Section III the currently available Fe isotope effect data on the superconducting transition temperature for various Fe-based HTS were reanalyzed by separating the measured Fe-IE exponent into a structural and an intrinsic (unrelated to the structural changes) components. By taking structural corrections into account we infer that the value of the genuine Fe-IE exponent is close to . The results presented Section III are partially adapted from Ref. Khasanov_PRB_2010, . The conclusions follow in Section IV.
II isotope effect on and the crystal structure of
In this section the 56Fe/54Fe isotope effects on the superconducting transition temperature and the crystal structure of the iron-chalcogenide superconductor FeSe1-x are described.
The preparation procedure for 56Fe/54Fe isotope submitted FeSe1-x powder samples is given in Ref. Khasanov10_FeSe-isotope, . The Fe-IE on the structural properties and the transition temperature were studied in neutron powder diffraction (NPD) and magnetization experiments, respectively.
II.1 Fe isotope effect on the crystal structure of FeSe1-x
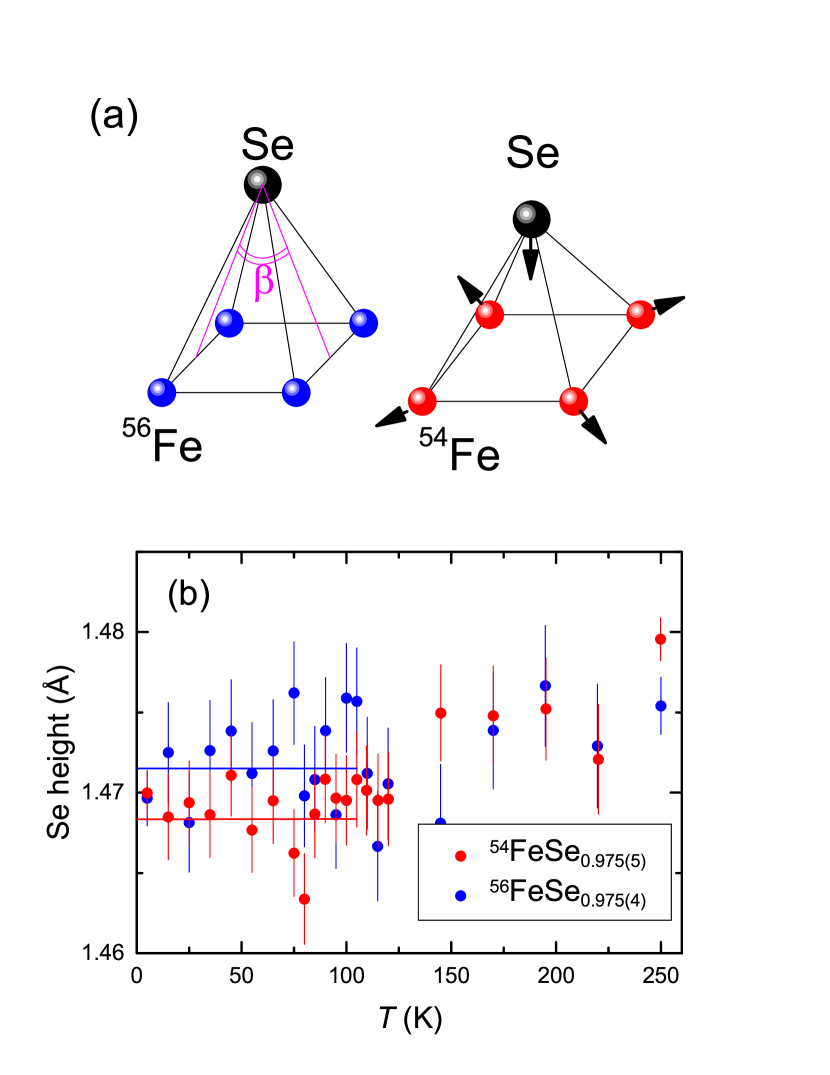
The refined structural parameters at K and 5 K obtained in neutron powder diffraction experiments are summarized in Table 1. The results of NPD measurements imply that the substitution of 56Fe by 54Fe leads to a small, but detectable enhancement of the lattice along the crystallographic and directions and a compression of it along the c-axis, resulting in a change of the shape of the Fe4Se pyramid (see Fig. 1 a). As is shown in Fig. 1 b, for temperatures below 100 K the Se atom is located closer to the Fe plane in 54FeSe1-x than in 56FeSe1-x.
| K | K | |||
|---|---|---|---|---|
| 54FeSe1-x | 56FeSe1-x | 54FeSe1-x | 56FeSe1-x | |
| Space group | ||||
| Se content | 0.975(5) | 0.975(4) | fixed to 0.975 | |
| (Å) | 3.77036(3) | 3.76988(5) | 5.33523(10) | 5.33426(10) |
| (Å) | 5.30984(10) | 5.30933(10) | ||
| (Å) | 5.51619(9) | 5.51637(9) | 5.48683(9) | 5.48787(9) |
| Volume (Å3) | 156.883(3) | 156.797(3) | 155.438(5) | 155.424(5) |
| Se | 0.2319(2) | 0.2326(0.3) | 0.2321(2) | 0.2322(3) |
It is important to note that the observed Fe-IE’s on the lattice parameters are intrinsic and not just a consequence of slightly different samples. As shown in Ref. Pomjakushina09, , various samples of 56FeSe1-x with and K indeed exhibit the same lattice parameters within the experimental error.
II.2 Fe isotope effect on of FeSe1-x
The Fe-IE on the transition temperature was studied by means of magnetization experiments. In order to avoid artifacts and systematic errors in the determination of the isotope shift of a statistical study were performed: i.e. the series of 54FeSe1-x/56FeSe1-x samples synthesized exactly at the same way (the same thermal history, the same amount of Se in the initial composition) were investigated.
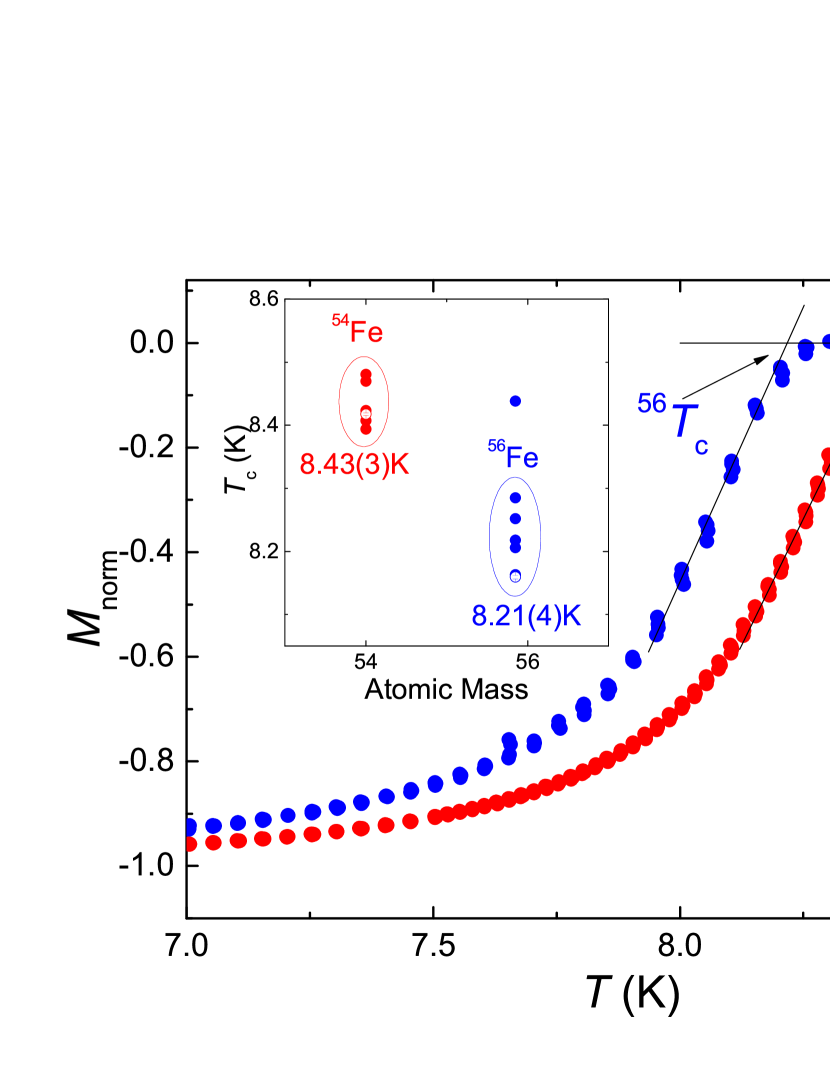
The magnetization experiments were conducted for six 54FeSe1-x and seven 56FeSe1-x samples, respectively. Figure 2 shows an example of zero-field cooled (ZFC) magnetization curves for a pair of 54FeSe1-x/56FeSe1-x samples ( was obtained after subtracting the small paramagnetic offset measured at and further normalization of the obtained curve to the value at K, see Fig. 1 in Ref. Pomjakushina09, for details). The magnetization curve for 54FeSe1-x is shifted almost parallel to higher temperature, implying that of 54FeSe1-x is higher than that of 56FeSe1-x. The resulting transition temperatures determined from the intercept of the linearly extrapolated curves with the line for all samples investigated are summarized in the inset of Fig. 2. The ’s for both sets of 54FeSe1-x/56FeSe1-x samples fall into two distinct regions: K and K, respectively. The corresponding mean values are: K and K. Note, that one out of the seven 56FeSe1-x samples had K which is by more than 5 standard deviations above the average calculated for the rest of the six samples. We have no explanation for this discrepancy, but decided to show this point for completeness of the data collected.
II.3 The structural and the intrinsic contributions to the Fe-IE in FeSe1-x
The Fe-IE exponent obtained for FeSe1-x iron-chalcogenide superconductor is larger than the BCS value as well as more than twice as large as reported for SmFeAsO0.85F0.15 and Ba0.6K0.4Fe2As2.Liu09 We want to emphasize, however, that our structural refined NPD data suggest that part of the large Fe-IE exponent may result from the tiny structural changes occurring due to 54Fe/56Fe substitution.
An estimate of the structural contribution to the Fe-IE exponent in FeSe1-x can be made based on the observed proportionality between and the crystal lattice constant for the 11 family FeSe1-yTey.Horigane09 ; Mizuguchi09 Assuming the relation vs. a also holds for FeSe1-x one obtains from the data presented in Ref. Mizuguchi09, for the relation K/%. With % (see Table 1 and Ref. Khasanov10_FeSe-isotope, ) this results in a structural shift of of K. Taking this correction into account yields a rough estimate of the structural and the intrinsic Fe-IE exponents of . Note that the value of is comparable with reported for SmFeAsO0.85F0.15 and Ba0.6K0.4Fe2As2.Liu09
We want to stress, that the ”structural“ contribution into the Fe-IE exponent in FeSe1-x consists of both: a positive and negative parts. Indeed, in FeSe1-x a decrease of the Se height caused by compression of the Fe4Se pyramid (see Fig. 1 b) leads to an increase of by K/% Mizuguchi10 ; Margadonna09 . In contrast, an increase of the Se(Te)-Fe-Se(Te) angle in the FeSe1-yTey family (angle in our notation, see Fig. 1 a) results for in a decrease of by K/% Horigane09 . Based on the structural data presented in Fig. 1 and Table 1 one obtains % and %, leading to K and K (in this estimate the values of were averaged over the temperature regions denoted as solid lines in Fig. 1 b). Bearing in mind that all Fe-based HTS are similarly sensitive to structural changes as FeSe1-x (see, e.g., Refs. Horigane09, ; Mizuguchi10, ; Mizuguchi09, ; Zhao08, ) we conclude that depending on the particular structural changes caused by the Fe isotope substitution, the shift of the transition temperature could be either positive, negative or may stay at zero. Which particular case is going to be realized would require precise studies of the structural properties for each individual isotope experiment.
III Genuine (Intrinsic) and structural isotope effects in -based HTS
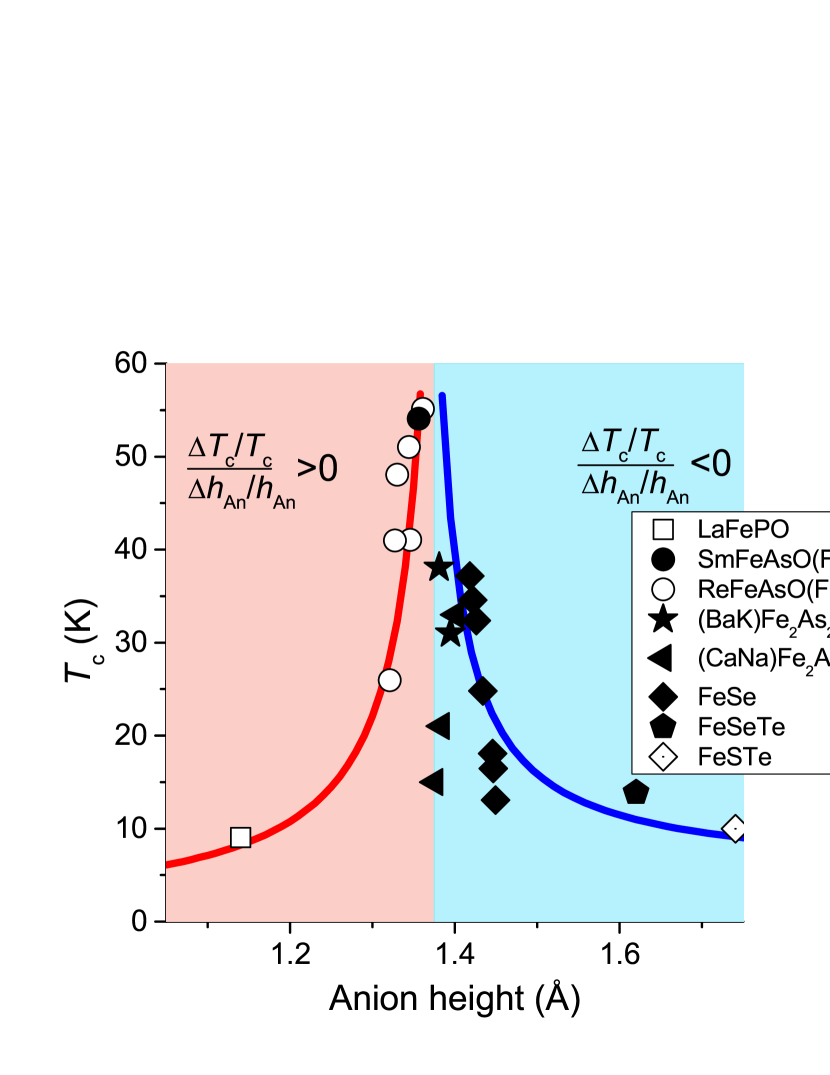
The observation of tiny but not negligible isotope effect on the crystal structure observed in FeSe1-x Fe-based HTS reported in the previous section requires to separate the Fe-IE exponent on into the genuine (intrinsic) and the structural components (see Eq. 2). In fact, the superconductivity in all Fe-based HTS is intimately related to small structural changes as reported in various works. As an example the strong nonlinear dependence of the superconducting transition temperature on the anion atom height (, An=As, P, or Se) with a sharp maximum of at Å, was reported by Mizuguchi et al.Mizuguchi10 (see Fig. 3).
| Sample | Reference | Fe) | c-axis(lightFe) | c-axis(heavyFe) | ||||
| (K) | (Å) | (Å) | ||||||
| Ba0.6K0.4Fe2As2 | Ref. Liu09, | 37.30(2) | 0.37(3) | 13.289(7) | 13.288(7) | |||
| Ba0.6K0.4Fe2As2 | Ref. Shirage09, | 37.78(2) | 13.313(1) | 13.310(1) | – | |||
| SmFeAsO0.85F0.15 | Ref. Liu09, | 41.40(2) | 0.34(3) | 8.490(2) | 8.491(2) | |||
| SmFeAsO1-y | Ref. Shirage10, | 54.02(13) | 8.4428(8) | 8.4440(8) | – | |||
| FeSe1-x | Ref. Khasanov10_FeSe-isotope, | 8.21(4) | 0.81(15) | 5.48683(9) | 5.48787(9) | |||
| FeSe0.35Te0.65 | Ref. Tsuge_PP_2012, | 13.10(5) | -0.54 | – | – | – | – | – |
| Ca0.4Na0.6Fe2As2 | Ref. Tsuge_JPCS_2014, | 34.3(2) | -0.19 | 12.19 | 12.19 | – | – | – |
III.1 Summary of Fe-IE measurements on the transition temperature
The results of Fe-IE measurements of for various Fe-based HTS’s obtained up to date are summarized in Table 2 and Fig. 4 a. In order to account for the structural changes caused by the Fe isotope exchange we have also included in Table 2 the c-axis lattice constants as they measured for the pairs of Fe isotope substituted samples. The choice of the c-axis lattice constant as the relevant quantity in deriving the structural isotope effect might appear to be rather arbitrary since is influenced by all structural details, namely tetrahedral angle, a-axis lattice constant, internal bond lengths, etc. However, the c-axis lattice constant provides a very sensitive probe since its compression(expansion) is directly accompanied by the corresponding variation of the distance from the Fe-planes to the above(below) lying anions which, in turn, is a well characterized property for many Fe-based compounds.Mizuguchi10 A survey of the literature shows that the proportionality between the anion atom height and the c-axis lattice constant indeed holds for various families of Fe-based HTS considered in the present study.Margadonna09 ; Rotter08 ; McQueen09
From Table 2 it follows that in Ba0.6K0.4Fe2As2 and SmFeAsO0.85F0.15 studied in Ref. Liu09, the c-axis constants are the same within the experimental error for both isotopically substituted sets of the samples. In FeSe1-x Khasanov10_FeSe-isotope the c-axis constant is larger, while in Ba0.6K0.4Fe2As2 Shirage09 it is smaller for the sample with the heavier Fe isotope. In SmFeAsO1-y, studied by Shirage et al.,Shirage10 both c-axis lattice constants seem to coincide within the experimental resolution. However, since the difference between them is 1.5 times larger than one standard deviation, it is conceivable to attribute an increase in the c-axis lattice constant in SmFeAsO1-y with the heavier Fe isotope. It should also be noted here that the accuracy in lattice constants determination for Ca0.4Na0.6Fe2As2 from Ref. Tsuge_JPCS_2014, is from one to two orders of magnitude worse than it is reported for other isotope substituted samples, and no structural data were reported for FeSe0.35Te0.65 in Ref. Tsuge_PP_2012, .
The use of the empirical vs. relation from Ref. Mizuguchi10, combined with the intrinsic relation of the proportionality between the c-axis constant and the anion atom height (, see Refs. Margadonna09, ; Rotter08, ; McQueen09, ) enables us to determine the sign of the structurally related shift of induced by isotopic exchange. By following Mizuguchi et al.Mizuguchi10 (see also Fig. 3) the sign of is positive for SmFeAsO(F) as well as for various Fe-based HTS belonging to ReFeAsO(F) family (Re=Nd, Ce, La) and negative for (BaK)Fe2As2, (CaNa)Fe2As2, Fe(SeTe), and FeSe1-x. Consequently the change of the c-axis constant caused by Fe isotope substitution as presented in Table 2 results in an additional structurally related shift of being positive for FeSe1-x,Khasanov10_FeSe-isotope negative for Ba0.6K0.4Fe2As2 and SmFeAsO1-y,Shirage09 ; Shirage10 and close to 0 for Ba0.6K0.4Fe2As2 and SmFeAsO0.85F0.15.Liu09 Note that for the lack of pure(absent) structural data, such estimate is not possible to be made for Ca0.4Na0.6Fe2As2 and FeSe0.35Te0.65 from Ref. Tsuge_PP_2012, ; Tsuge_JPCS_2014, .
We want to emphasize that the above mentioned discussion allows only to determine the sign of the structurally related isotope effect but not its absolute value. The reasons are the following. (i) The relative change of the c-axis constant is proportional, but not identical to the one of . As an example, 56Fe to 54Fe isotope substitution in FeSe1-x leads to an increase of the c-axis constant by approximately 0.02%, while the change of the Se height amounts to ten times higher value % (see Table 1, Fig. 1 b, and Ref. Khasanov10_FeSe-isotope, ). (ii) The height of the anion atom is clearly not the only parameter which is crucial for of Fe-based HTS as already mentioned above.
The analysis of the structural data together with the dependence of on the a-axis lattice constant in FeSe1-x, as is presented in Section II, was allowing to extract the “structural” Fe isotope effect exponent for 56Fe to 54Fe substituted FeSe1-x samples. The absence of precise structural data for the samples studied in Refs. Liu09, ; Shirage09, ; Shirage10, ; Tsuge_PP_2012, ; Tsuge_JPCS_2014, complicates their analysis. However, a zero, within the experimental accuracy, Fe isotope shift of the c-axis lattice constant for Ba0.6K0.4Fe2As2 as reported by Liu et al.Liu09 is a clear indication that no structural effect is present for this particular set of the samples. Consequently, the negative isotope effect exponent obtained for nominally identically doped Ba0.6K0.4Fe2As2 by Shirage et al.Shirage09 stems from summing both effects, i.e., , see Eq. (2). The similar analysis by comparing SmFeAsO(F) Fe-IE exponents from Refs. Liu09, and Shirage10, results in for SmFeAsO1-y from Ref. Shirage10, . It is worth to note, however, that the SmFeAsO(F) samples studied in Refs. Liu09, and Shirage10, have different doping levels (different ’s, see Table 2 and Fig. 4 a).
III.2 The genuine Fe-IE exponent via phonon frequency measurements
The BCS expression for the superconducting transition temperature relates it to the characteristic phonon frequency and the coupling constant via:Tinkham_75
| (3) |
The consequences of this equation are two fold. First of all, since the coupling constant is independent of the ion mass (see e.g. Ref. Alexandrov_book_2003, ) and the characteristic phonon frequency is proportional to , as a frequency of any harmonic oscillator, becomes equal exactly to 0.5. Note that the Coulomb repulsion and the anharmonicity of phonons, which are not considered in Eq. 3, would lead to smaller values.Alexandrov_book_2003 Second, due to direct proportionality between and the isotope exponents on both these quantities are equal to the each other:
| (4) |
Currently we are aware of two experimental works where the Fe-IE on was studied by means of EXAFS and Raman techniques on (BaK)Fe2As2, SmFeAsO0.65, and SmFeAs0.77H0.12 Fe-based HTS.Chu_SciRep_2013 ; Singh_AIP_2016 The corresponding ’s are shown in Fig. 4 b together with presently obtained ’s (see Section III.1 and Table 2). Remarkably enough both sets of Fe-IE exponents stay quite close to the each other with .
III.3 Isotope effect within the multiple gap scenario of -based HTS
Bussmann-Holder et al.Bussmann-Holder09 investigated a multiple gap scenario of superconductivity in Fe-based HTS with the aim to search for possible sources of the isotope effect on . Typical phonon-mediated scenarios were contrasted to polaronic effects and found to have very different impacts on the isotope effect. While phonon-mediated superconductivity slightly suppresses the isotope effect as compared to the BCS value , polaronic effects can largely enhance it. The scenario of electron-phonon mediated superconductivity within the dominant gap channel predicts a independent isotope effect with the value being slightly smaller than 0.5. This agrees rather well with that observed for FeSe1-x,Khasanov10_FeSe-isotope (BaK)Fe2As2,Liu09 ; Shirage09 ; Chu_SciRep_2013 SmFeAsO0.85F0.15,Liu09 SmFeAsO0.65,Singh_AIP_2016 and SmFeAs0.77H0.12.Singh_AIP_2016 Indeed, for these particular samples, which are belong to 3 different families of Fe-based HTS and have ’s ranging from 8 to 54 K, the “intrinsic” Fe isotope exponent is almost constant with , see Table 2 and Fig. 4 b.
IV Conclusions
The purpose of the present study was two-fold. First, by presenting results obtained on FeSe1-x iron-chalcogenide superconductor it was demonstrated that the tiny changes of the structural parameters caused by Fe isotope substitution are clearly contributing to the resulting Fe-IE exponent on the transition temperature . Depending on the particular changes caused by the Fe isotope substitution, the ”structurally“ related shift of the transition temperature could be either positive, negative or stays at zero. Such effects may help to clarify or even be the origin of the previously reported controversial results.Liu09 ; Shirage09 ; Shirage10 ; Khasanov10_FeSe-isotope ; Tsuge_PP_2012 ; Tsuge_JPCS_2014
Second, the currently available Fe isotope effect data on the superconducting transition temperature for various Fe-based HTS were analyzed by separating the measured Fe-IE exponent into a structural () and an intrinsic (unrelated to the structural changes, ) components. The validity of decomposition the Fe-IE exponent was further confirmed by the fact that almost coincides with the Fe-IE exponent on the characteristic phonon frequencies as observed in recent EXAFS and Raman experiments.Chu_SciRep_2013 ; Singh_AIP_2016 We infer that the value of the genuine Fe-IE exponent is close to for compounds having ranging from 8 to 54 K and belonging to at least three different families of Fe-based HTS.
V Acknowledgments
The author acknowledges the broad and successful collaboration with people without whom this work could not be performed: Markus Bendele, Hugo Keller, Annette Bussmann-Holder, Kazimierz Conder, Ekaterina Pomjakushina, and Volodya Pomjakushin. The special thank goes to Karl Alex Müller and Hugo Keller who were initiated my interest to the isotope effect studies.
References
- (1) E. Maxwell, Phys. Rev. 78 477 (1950).
- (2) C.A. Reynolds, B. Serin, W.H. Wright, and L.B. Nesbitt, Phys. Rev. 78 487 (1950).
- (3) C.P. Poole, Handbook of Superconductitivy, Academic press, 24-28 Oval Road, London, (2000).
- (4) W. Buckel and B. Strizker, Phys. Letters 43A, 403 (1973).
- (5) J.E. Schriber and C.J.M. Northrup, Jr., Phys. Rev. B 10, 3818 (1974).
- (6) M. Yussouff, B.K. Rao, and P. Jena, Sol. State. Commun. 94, 549 (1995).
- (7) J.A. Schlueter, A.M. Kini, B.H. Ward, U. Geiser, H.H. Wang, J. Mohtasham, R.W. Winter and G.L. Gard, Physica C 351, 261 (2001).
- (8) M.H. Whangbo, J.M. Willimas, A.J. Schultz, T.J. Emge, and M.A. Beno, J. Am. Chem.Soc., 109, 90 (1997).
- (9) A. Stucky, G. Scheerer, Z. Ren, D. Jaccard, J.-M. Poumirol, C. Barreteau, E. Giannini, D. van der Marel, arXiv:1610.10045.
- (10) B. Batlogg, G. Kourouklis, W. Weber, R.J. Cava, A. Jayaraman, A.E. White, K.T. Short, L.W. Rupp, and E.A. Rietman, Phys. Rev. Lett. 59, 912 (1987).
- (11) J.P. Franck, J. Jung, M.A-K. Mohamed, S. Gygax, and G.I. Sproule, Phys. Rev. B 44, 5318 (1991).
- (12) J.P. Franck, in Physical Properties of High Temperature Superconductors IV, edited by D. M. Ginsberg (World Scientific, Singapore, 1994), pp. 189–293.
- (13) D. Zech, H. Keller, K. Conder, E. Kaldis, E. Liarokapis, N. Poulakis, and K.A. Müller, Nature (London) 371, 681 (1994).
- (14) G.-M. Zhao, H. Keller, and K. Conder, J. Phys.: Condens. Matter 13, R569 (2001).
- (15) R. Khasanov, A. Shengelaya, K. Conder, E. Morenzoni, I.M. Savić, and H. Keller, J. Phys.: Condens. Matter 15, L17 (2003).
- (16) R. Khasanov, A. Shengelaya, E. Morenzoni, M. Angst, K. Conder, I. M. Savić, D. Lampakis, E. Liarokapis, A. Tatsi, and H. Keller, Phys. Rev. B 68, 220506(R) (2003).
- (17) R. Khasanov, A. Shengelaya, E. Morenzoni, K. Conder, I.M. Savić, and H. Keller, J. Phys.: Condens. Matter 16, S4439 (2004).
- (18) R. Khasanov, D. G. Eshchenko, H. Luetkens, E. Morenzoni, T. Prokscha, A. Suter, N. Garifianov, M. Mali, J. Roos, K. Conder, and H. Keller, Phys. Rev. Lett. 92, 057602 (2004).
- (19) R. Khasanov, A. Shengelaya, K. Conder, E. Morenzoni, I. M. Savić, J. Karpinski, and H. Keller, Phys. Rev. B 74, 064504 (2006).
- (20) R. Khasanov, A. Shengelaya, D. Di Castro, D.G. Eshchenko, I.M. Savić, K. Conder, E. Pomjakushina, J. Karpinski, S. Kazakov, and H. Keller, Phys. Rev. B 75, 060505(R) (2007).
- (21) R. Khasanov, S. Strässle, K. Conder, E. Pomjakushina, A. Bussmann-Holder, and H. Keller, Phys. Rev. B 77, 104530 (2008).
- (22) J.L. Tallon, R.S. Islam, J. Storey, G.V.M. Williams, and J.R. Cooper, Phys. Rev. Lett. 94, 237002 (2005).
- (23) X.-J. Chen, B. Liang, C. Ulrich, C.-T. Lin, V.V. Struzhkin, Z. Wu, R.J. Hemley, H.-k. Mao, and H.-Q. Lin, Phys. Rev. B 76, 140502 (2007).
- (24) R. Khasanov, A. Shengelaya, D. Di Castro, E. Morenzoni, A. Maisuradze, I.M. Savić, K. Conder, E. Pomjakushina, A. Bussmann-Holder, and H. Keller, Phys. Rev. Lett. 101, 077001 (2008).
- (25) R.H. Liu, T. Wu, G. Wu, H. Chen, X.F. Wang, Y.L. Xie, J.J. Yin, Y.J. Yan, Q.J. Li, B.C. Shi, W.S. Chu, Z.Y. Wu, and X.H. Chen, Nature 459, 64 (2009).
- (26) P.M. Shirage, K. Kihou, K. Miyazawa, C.-H. Lee, H. Kito, H. Eisaki, T. Yanagisawa, Y. Tanaka, and A. Iyo, Phys. Rev. Lett 103, 257003 (2009).
- (27) P.M. Shirage, K. Miyazawa, K. Kihou, H. Kito, Y. Yoshida, Y. Tanaka, H. Eisaki, and A. Iyo, Phys. Rev. Lett. 105, 037004 (2010).
- (28) R. Khasanov, M. Bendele, K. Conder, H. Keller, E. Pomjakushina, and V. Pomjakushin, New J. Phys. 12, 073024 (2010).
- (29) Y. Tsuge, A. Iyo, Y. Tanaka, H. Eisaki, and T. Nishio, Physics Procedia 36, 731 (2012).
- (30) Y. Tsuge, T. Nishio, A. Iyo, Y. Tanaka, and H. Eisaki, Journal of Physics: Conference Series, 507, 012037 (2014).
- (31) W. Chu, J. Cheng, S. Chu, T. Hu, A. Marcelli, X. Chen, and Z. Wu, Scientific Reports 3, 1750 (2013).
- (32) B. Singh, P.M. Shirage, A. Iyo, and P. Kumar, AIP Advances 6, 105310 (2016).
- (33) A. Bussmann-Holder, A. Simon, H. Keller, and A.R. Bishop, J. Supercond. Nov. Magn. 24,1099 (2011).
- (34) R. Khasanov, M. Bendele, A. Bussmann-Holder, H. Keller, Phys. Rev. B 82, 212505 (2010).
- (35) E. Pomjakushina, K. Conder, V. Pomjakushin, M. Bendele, and R. Khasanov, Phys. Rev. B 80 024517 (2009).
- (36) K. Horigane, H. Hiraka, and K. Ohoyama, J. Phys. Soc. Jpn. 78 074718 (2009).
- (37) Y. Mizuguchi, F. Tomioka, S. Tsuda, T. Yamaguchi and Y. Takano, J. Phys. Soc. Jpn. 78 074712 (2009).
- (38) Y. Mizuguchi, Y. Hara, K. Deguchi, S. Tsuda, T. Yamaguchi, K. Takeda, H. Kotegawa, H. Tou, and Y. Takano, Supercond. Sci. Technol. 23 054013 (2010).
- (39) S. Margadonna, Y. Takabayashi, M.T. McDonald, M. Brunelli, G. Wu, R.H. Liu, X.H. Chen, and K. Prassides, Phys. Rev. B 79, 014503 (2009).
- (40) J. Zhao, Q. Huang, C. de la Cruz, S. Li, J.W. Lynn, Y. Chen, M.A. Green, G.F. Chen, G. Li, Z. Li, J.L. Luo, N.L. Wang, and P. Dai, Nature Materials 7, 953 (2008).
- (41) M. Rotter, M. Pangerl, M. Tegel, and D. Johrendt, Angew. Chem. Int. Ed. 47, 7949 (2008).
- (42) T.M. McQueen, Q. Huang, V. Ksenofontov, C. Felser, Q. Xu, H.W. Zandbergen, Y.S. Hor, J. Allred, A.J. Williams, D. Qu, J. Checkelsky, N.P. Ong, and R.J. Cava, Phys. Rev. B 79, 014522 (2009).
- (43) M. Tinkham, Introduction to Superconductivity, Krieger Publishing company, Malabar, Florida, 1975.
- (44) A.S. Alexandrov, Theory of Superconductivity: From Weak to Strong Coupling, Institute of Physics Publishing, Bristol, 2003.