Fiber and Crystals Dual Readout calorimeters
Abstract
The RD52 (DREAM) collaboration is performing R&D on dual readout calorimetry techniques with the aim of improving hadronic energy resolution for future high energy physics experiments. The simultaneous detection of Cherenkov and scintillation light enables us to measure the electromagnetic fraction of hadron shower event-by-event. As a result, we could eliminate the main fluctuation which prevented from achieving precision energy measurement for hadrons.
We have tested the performance of the lead and copper fiber prototypes calorimeters with various energies of electromagnetic particles and hadrons. During the beam test, we investigated the energy resolutions for electrons and pions as well as the identification of those particles in a longitudinally unsegmented calorimeter.
Measurements were also performed on pure and doped PbWO4 crystals, as well as BGO and BSO, with the aim of realising a crystal based dual readout detector. We will describe our results, focusing on the more promising properties of homogeneous media for the technique. Guidelines for additional developments on crystals will be also given.
Finally we discuss the construction techniques that we have used to assemble our prototypes and give an overview of the ones that could be industrialized for the construction of a full hermetic calorimeter.
keywords:
Dual-Readout; Energy Resolution; Calorimeter.1 Introduction
The role of calorimeter in modern high energy physics experiments
has been identifying particles as well as measuring their energy and
momentum. Such experiments, the calorimeters have provided
the key information on the measured energy and momentum of particles
identified as the electromagnetic particles and hadrons by itself,
and have become the heart of particle physics experiments. From this
fact, we can infer that the measurement of particle energy with excellent calorimeter energy resolution ends up with high quality particle
physics experiments and good physics results. After the Higgs discovery,
it is believed that a future lepton collider will focus on understanding
the Higgs mechanism, and study of the Higgs boson properties.
To accomplish this, we will need a dedicated Higgs factory with excellent
detectors which can measure the energy of jets from hadronic decays
of W’s and Z’s in the same precision as the energy measurement of
electrons and gammas.
However, while the detection of electrons, photons and other particles
that develop electromagnetic showers can be performed with high precision,
the same is not true for hadrons.
This is primarily due to the fact that
-
1.
most calorimeters generate a larger signal per unit deposited energy for the electromagnetic shower component () than for the hadronic one (); that is
-
2.
the fluctuations in the energy sharing between these two components are large and non-Poissonian.
As a result, in typical instruments the hadronic response function is non-Gaussian, the hadronic signals are non-linear.
Several approaches have been proposed to deal with this problem:
- Compensating calorimeters
-
are designed to deliver equal response to the and non- shower components: . This can be achieved by boosting the response to the hadronic component, for instance in calorimeters with a hydrogenous active medium that is very sensitive to the soft neutrons abundantly produced in hadronic shower development. Such calorimeters require a precisely tuned sampling fraction. Since this sampling fraction is typically small (2.3% in lead/plastic-scintillator calorimeters), the em energy resolution of such devices is in practice limited to [1].
- Off-line compensation
-
is a technique applied in devices with , in which signals from different sections of the calorimeter are re-weighted according to some scheme to reconstruct the shower true energy. This is one of the most common approach, however, it requires attention to avoid introducing non linearities in the response.
- Energy Flow
-
combines the calorimeter information with measurements from a tracking system, to improve the performance for jets. This method, usually deployed in combination with the previous one, has been successfully applied in several modern collider experiments.
- Particle Flow
-
extends the previous technique by trying to reconstruct each individual particle in a jet using highly segmented calorimeters and sophisticated reconstruction algorithms.
- Dual Readout Method
-
that is the topic of this paper and will be fully described in the next section.
1.1 The Dual REAdout Method
Since the resolution is determined by fluctuations in the electromagnetic fraction of the shower (), measurement of the value, event by event, is the key to improving the hadronic energy resolution of an intrinsically non-compensating calorimeter. In our method, is measured by comparing the shower signals produced in the form of Scintillation light () and Cherenkov light () in the same detector.
In dual-readout calorimetry each hadronic shower is measured in two nearly independent ways. While the Scintillation channel is sensitive to both components of the shower, the signals from the hadronic fraction are strongly dominated by spallation hadrons produced in nuclear reactions, these are usually not sufficiently relativistic to produce Cherenkov light. The Cherenkov channel is, for all practical purposes, only sensitive to the em shower component ().
This can be realized in different ways:
-
•
In a fiber calorimeters, scintillating fibers and clear fibers can used to measure the S and C channel separately.
-
•
In a crystal calorimeter, both scintillation and Cherenkov light are generated in the same optical volume, and the necessary separation of the two kinds of light is accomplished using time structure, direction, wavelength spectrum, and polarization.
The part is calibrated to unit response, and the resulting average response of the part is denoted by , which is less then unity for most calorimeters. If is the hadronic energy (either single hadron or jet), and the responses expected in the two channels are
These equations can be inverted to measure both and event-by-event.
| (1) |
Where is the corrected energy which is a function of the Scintillation and Cherenkov signals, and the factor , which, in turn, is determined by the physical characteristic of the calorimeter.
2 The RD52 Fiber Calorimeter
The RD52 collaboration has undertaken an extensive experimental campaign to validate the dual readout method with fiber calorimeters. We have a semi permanent setup at H8 beam line in the CERN SPS North Area. The experimental setup for the Nov. 2012 beam test is shown in Fig. 1 and all experimental results described in this paper have been obtained using a substantially unmodified set of detectors.
A number of auxiliary detectors are installed on the beam line:
- Drift chambers
-
(DC) the two wire chambers are used to constrain the particle position and divergence to obtain a well beam spot.
- Preshower detector
-
(PSD) a scintillator placed right after a 5 mm thick Pb plate. Electrons start developing showers in this device, while muons and hadrons typically produced a signal characteristic for a minimum ionizing particle (mip) in the scintillator plate.
- Tail catcher
-
(TC) a scintillation counter placed right after the calorimeter (), used to identify escaping pions and muons.
- Muon counter
-
(MuC)a scintillator placed right after the tail catcher behind an additional of iron.
Elimination of the hadron (electron) and muon contamination in the electron (hadron) beams is performed using these ancillary detectors.
The RD52 fiber calorimeters consisting of 9 Pb-fiber and 2 Cu-fiber modules were housed by the rectangular box, which is shown in the middle of Fig. 1 (a).

Each module is 2.5 m long, corresponding to , and its cross section is mm2. Each tower is a square of 4646 mm2 and has one Cherenkov and one scintillation channels; one module consists of four towers. Fig. 1 (b) shows how the 9 Pb-fiber modules are arranged in a 33 matrix and the relative position of the 2 Cu-fiber modules that are placed on top of the Pb matrix. Tower 15 (T15) is defined as the central tower of the matrix, surrounded by three rings. The results described here were obtained with beams aimed at T15 (for the Pb matrix) or Al2 (for the Cu-fiber calorimeter).
The cross section of 33 matrix is 27.627.6 cm2. It is small compared to the average lateral size of an hadronic shower, so shower leakage affects the performance of the RD52 calorimeters. To try and count for that, 20 leakage counters, made of 505010 cm3 of plastic, are installed around the RD52 fiber calorimeters.
2.1 Electromagnetic performance
Each tower of the RD52 calorimeter contains an equal number of scintillating and clear fibers (where only Cherenkov light is produced). Both channels of every individual tower are calibrated using the response to 20 GeV electrons.
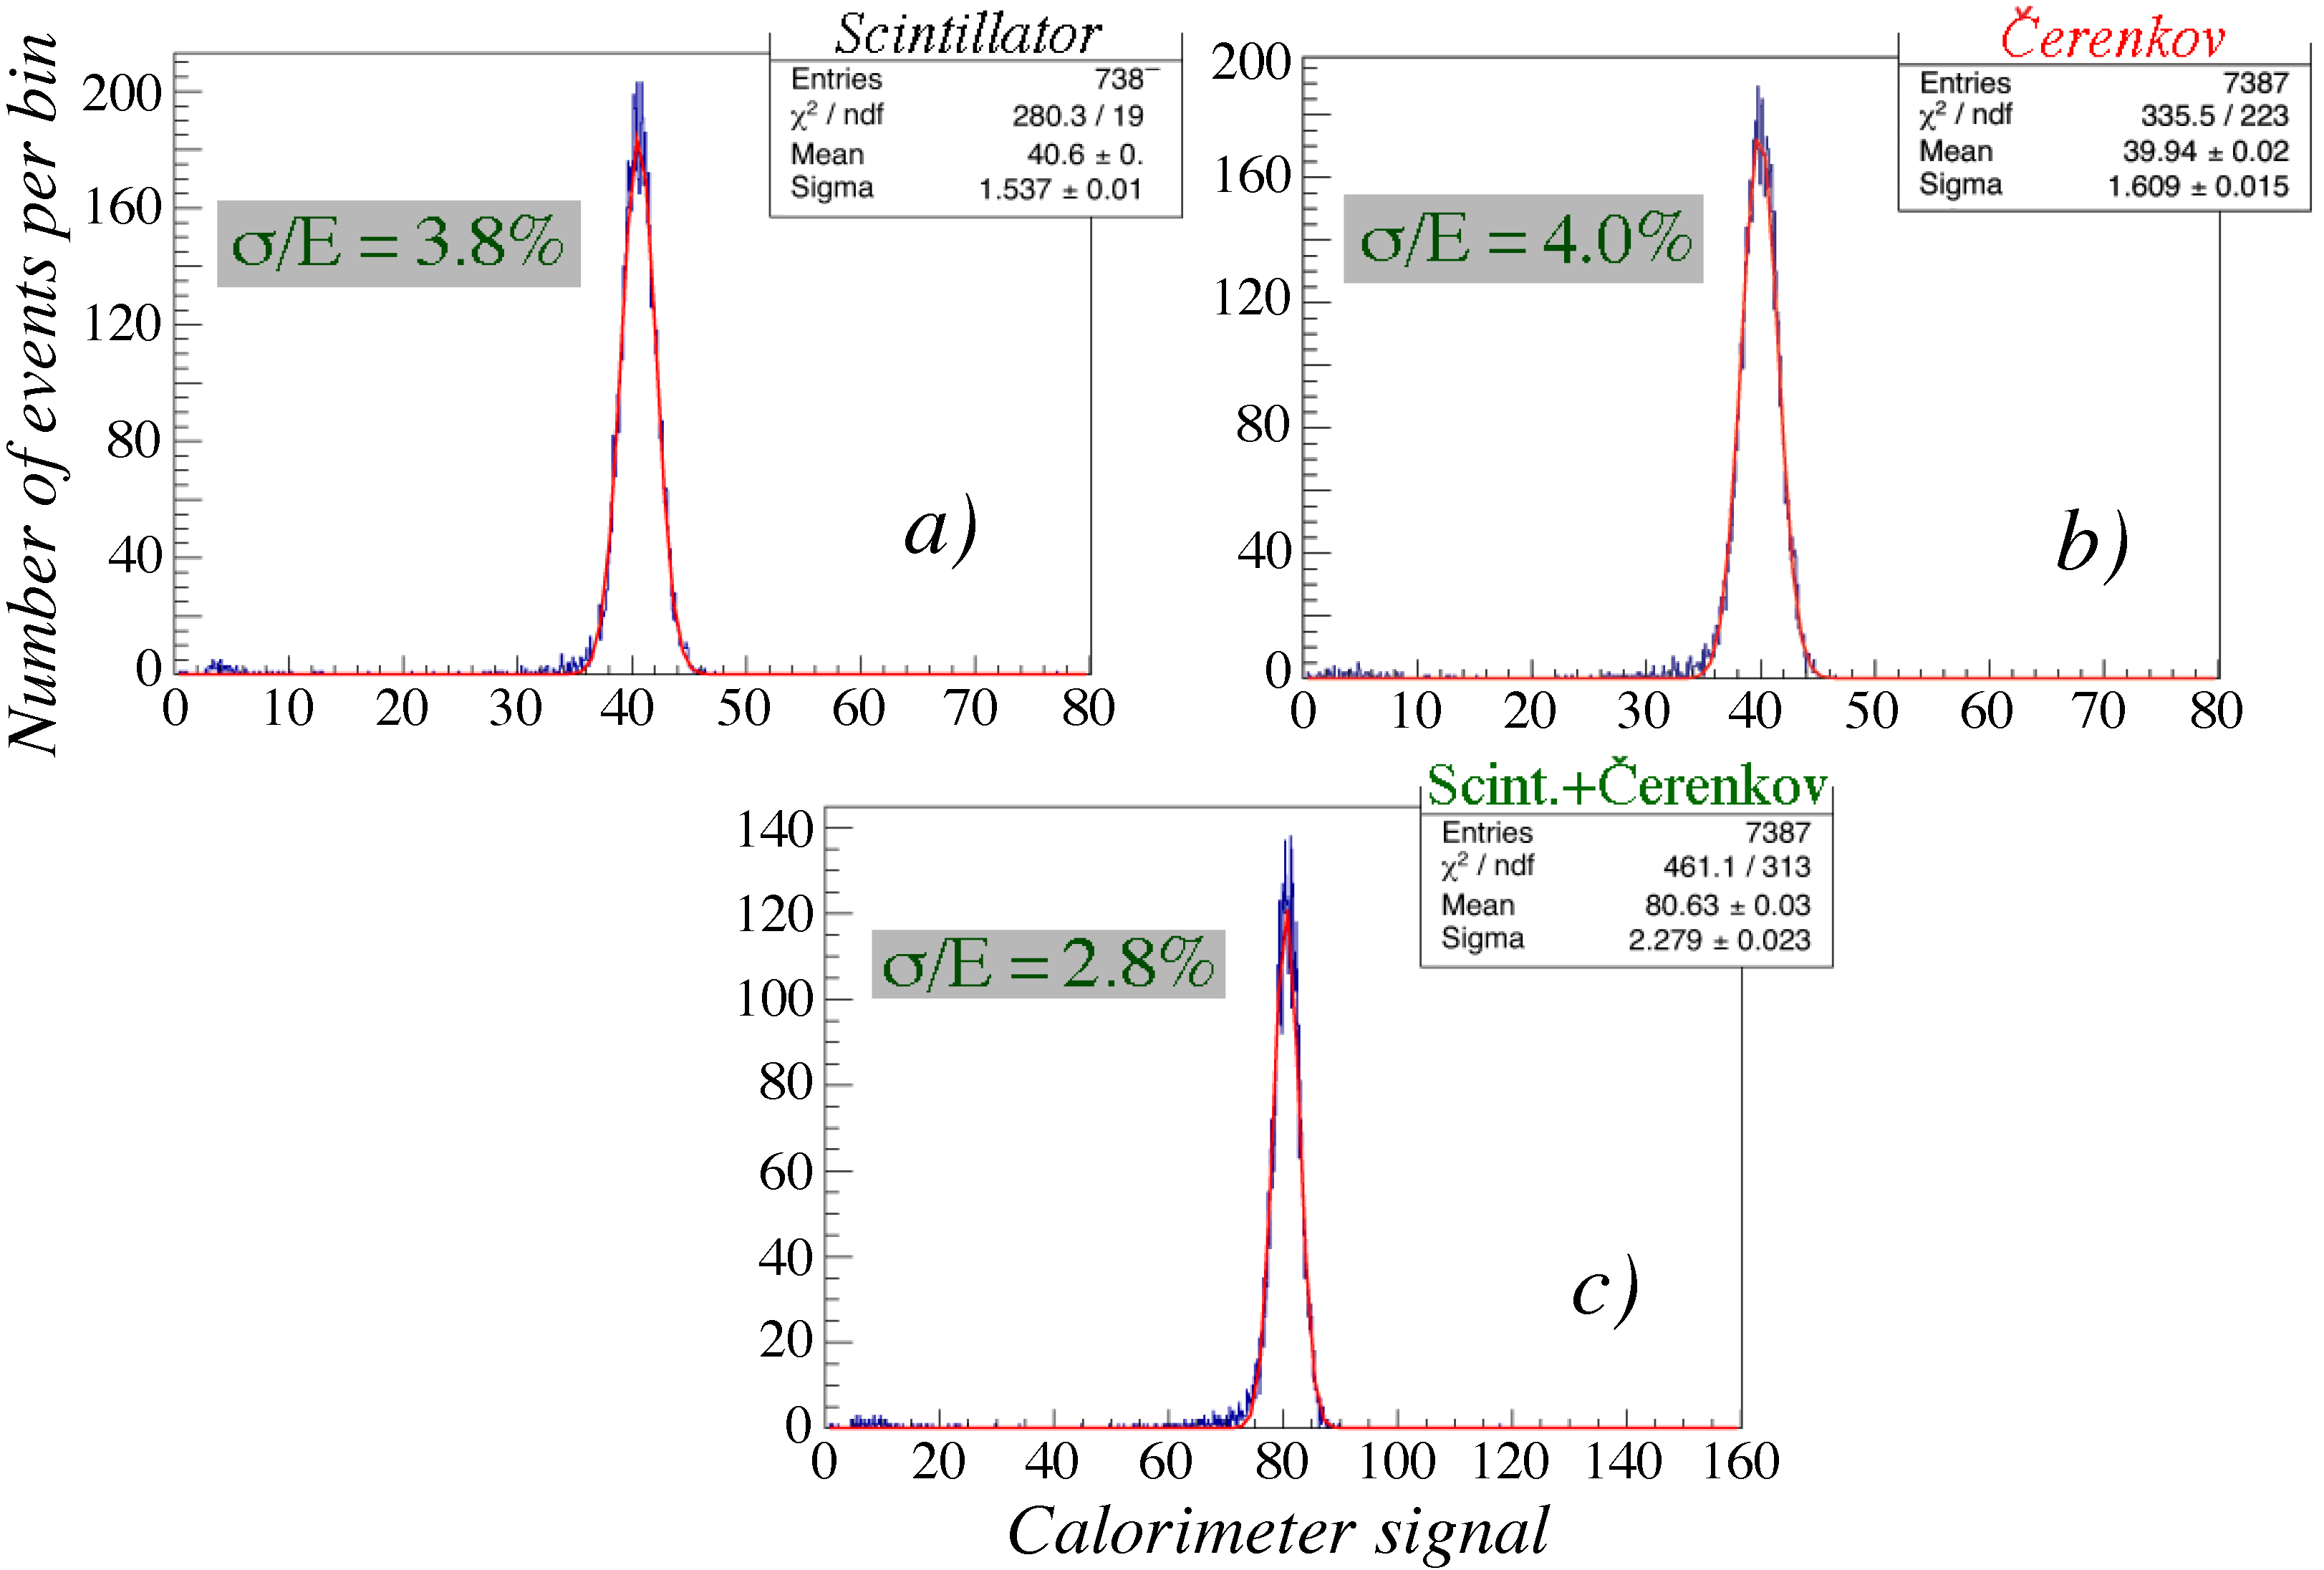
Fig. 2 shows the response of the aluminised Cu-fiber calorimeter to 40 GeV electrons. In both scintillation and Cherenkov channels the electron energy is measured with a resolution of of 3.8% and 4.0% respectively. The signal distributions of the scintillation and Cherenkov channel is plotted in Fig. 2a and b.
Since the same shower is sampled by the Cherenkov and scintillation fibers at the same time the two signals can be simply combined giving an improved energy resolution of .
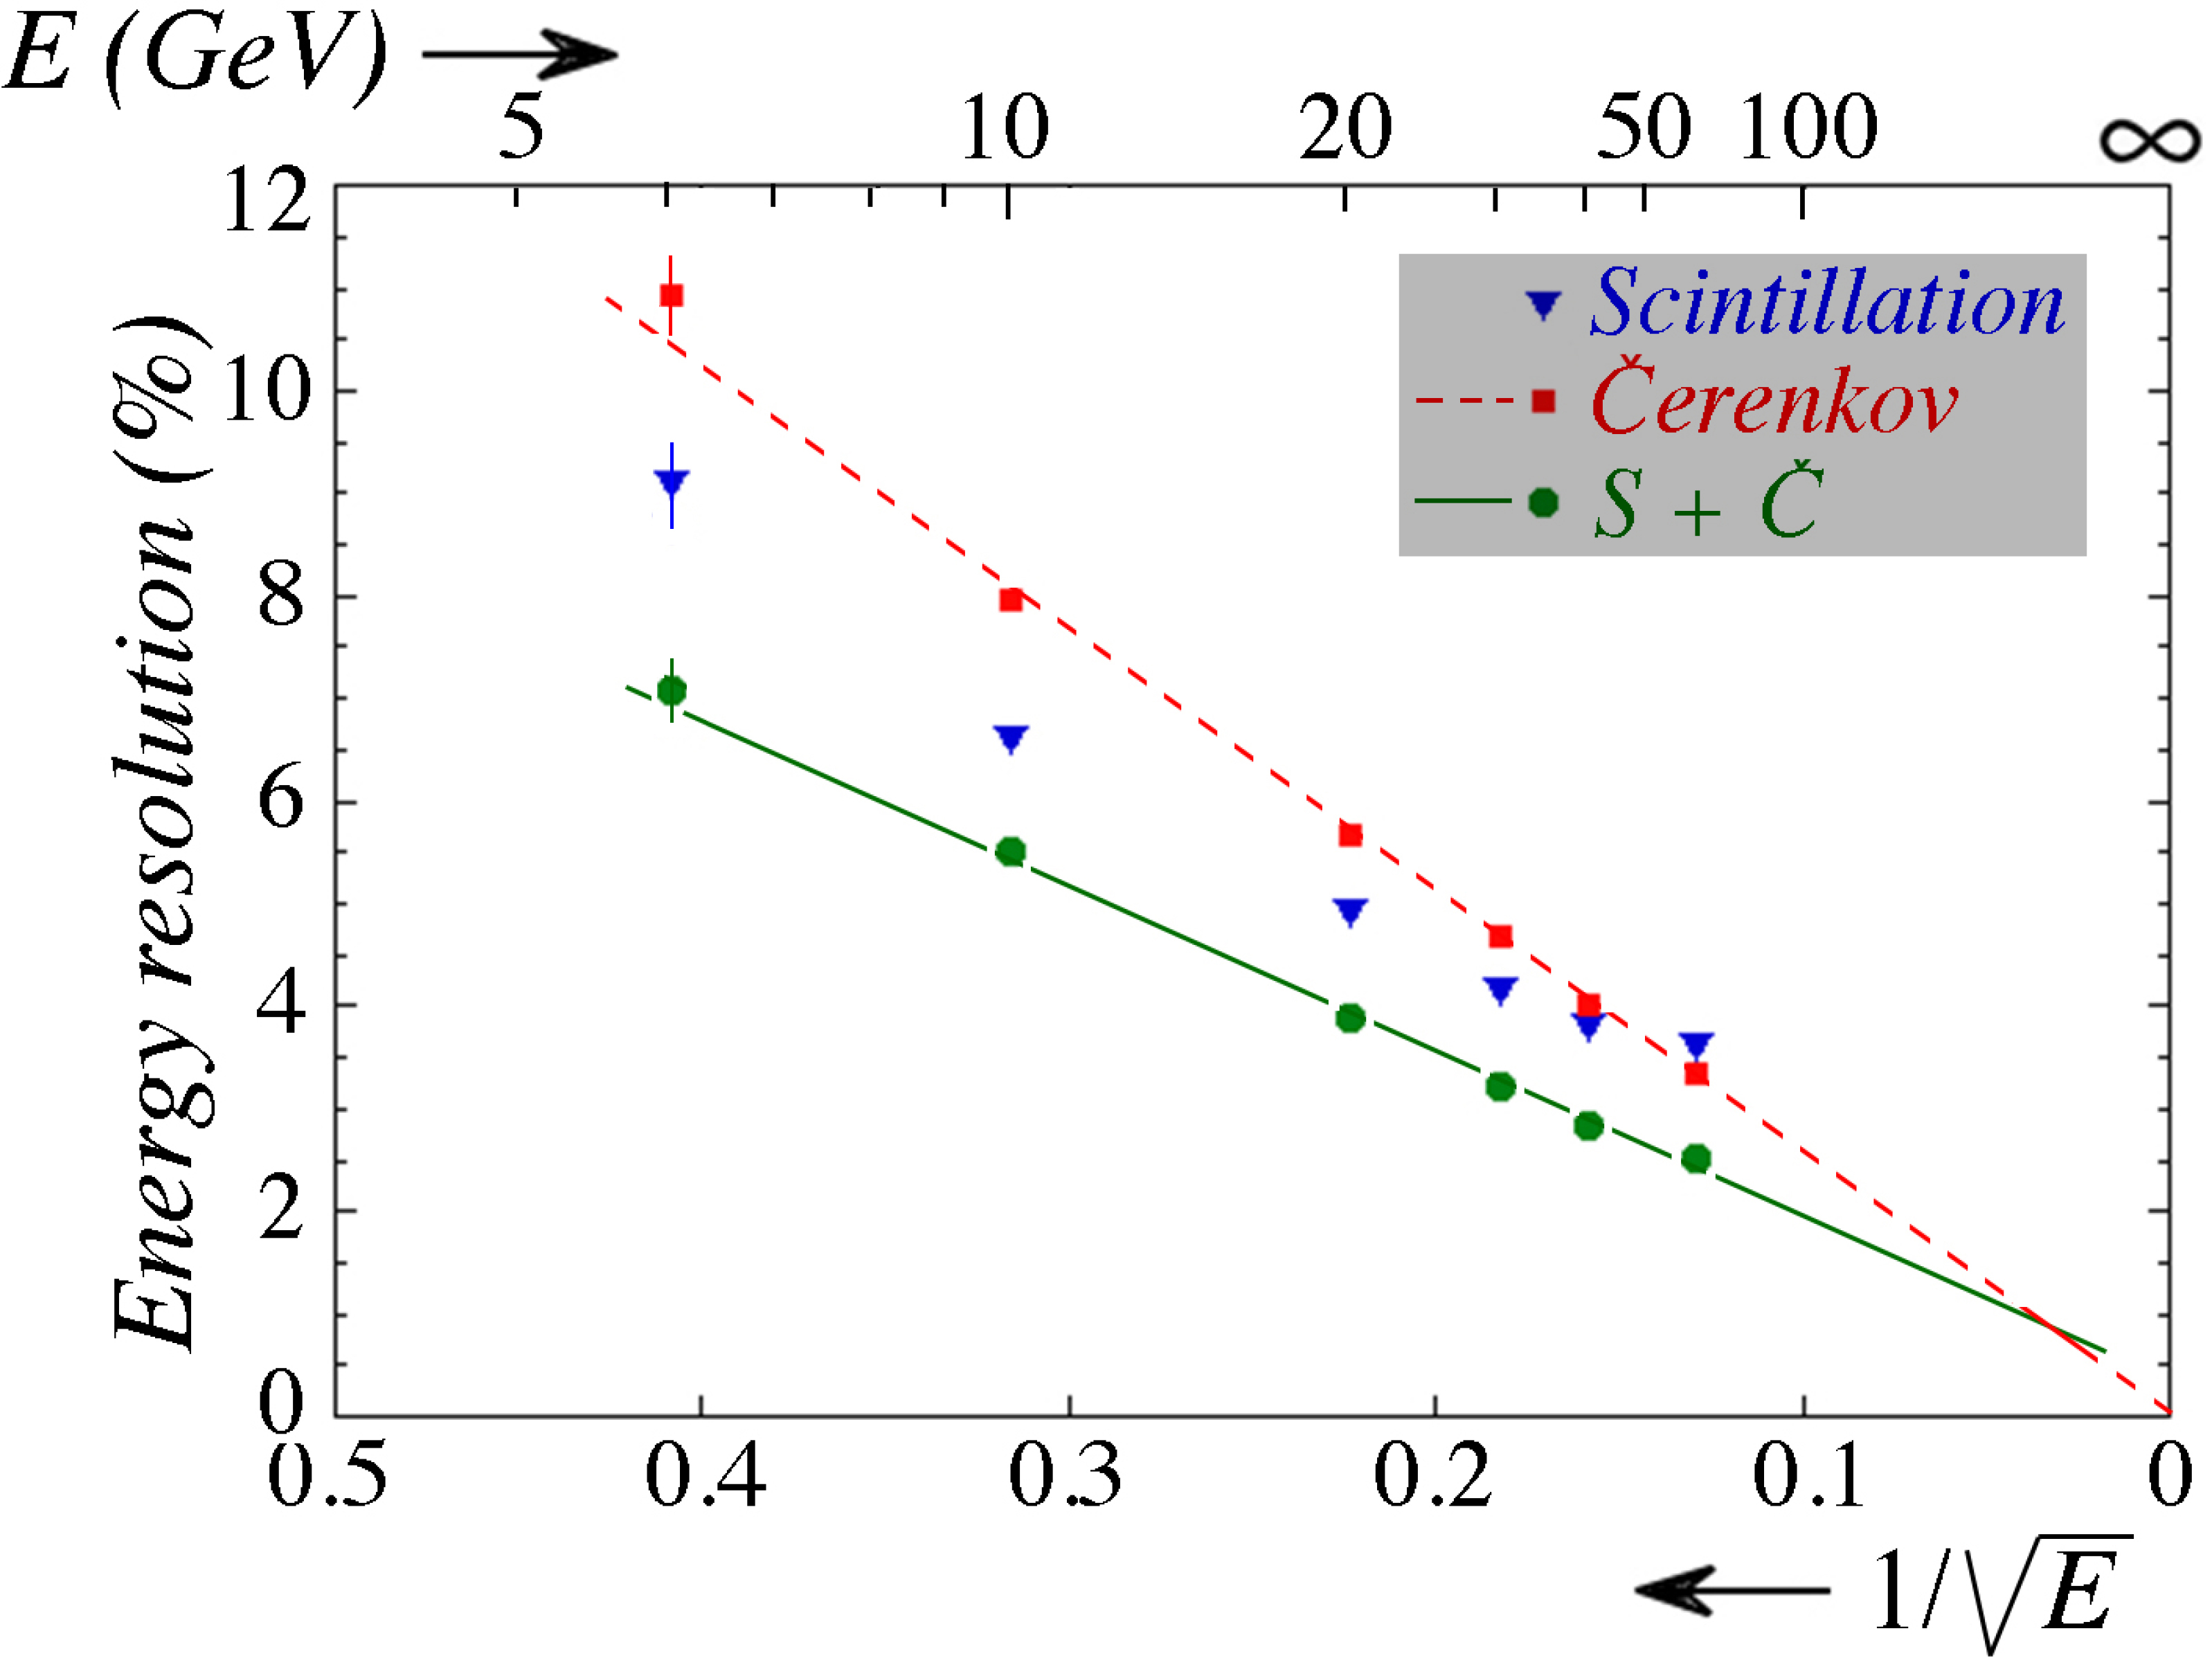
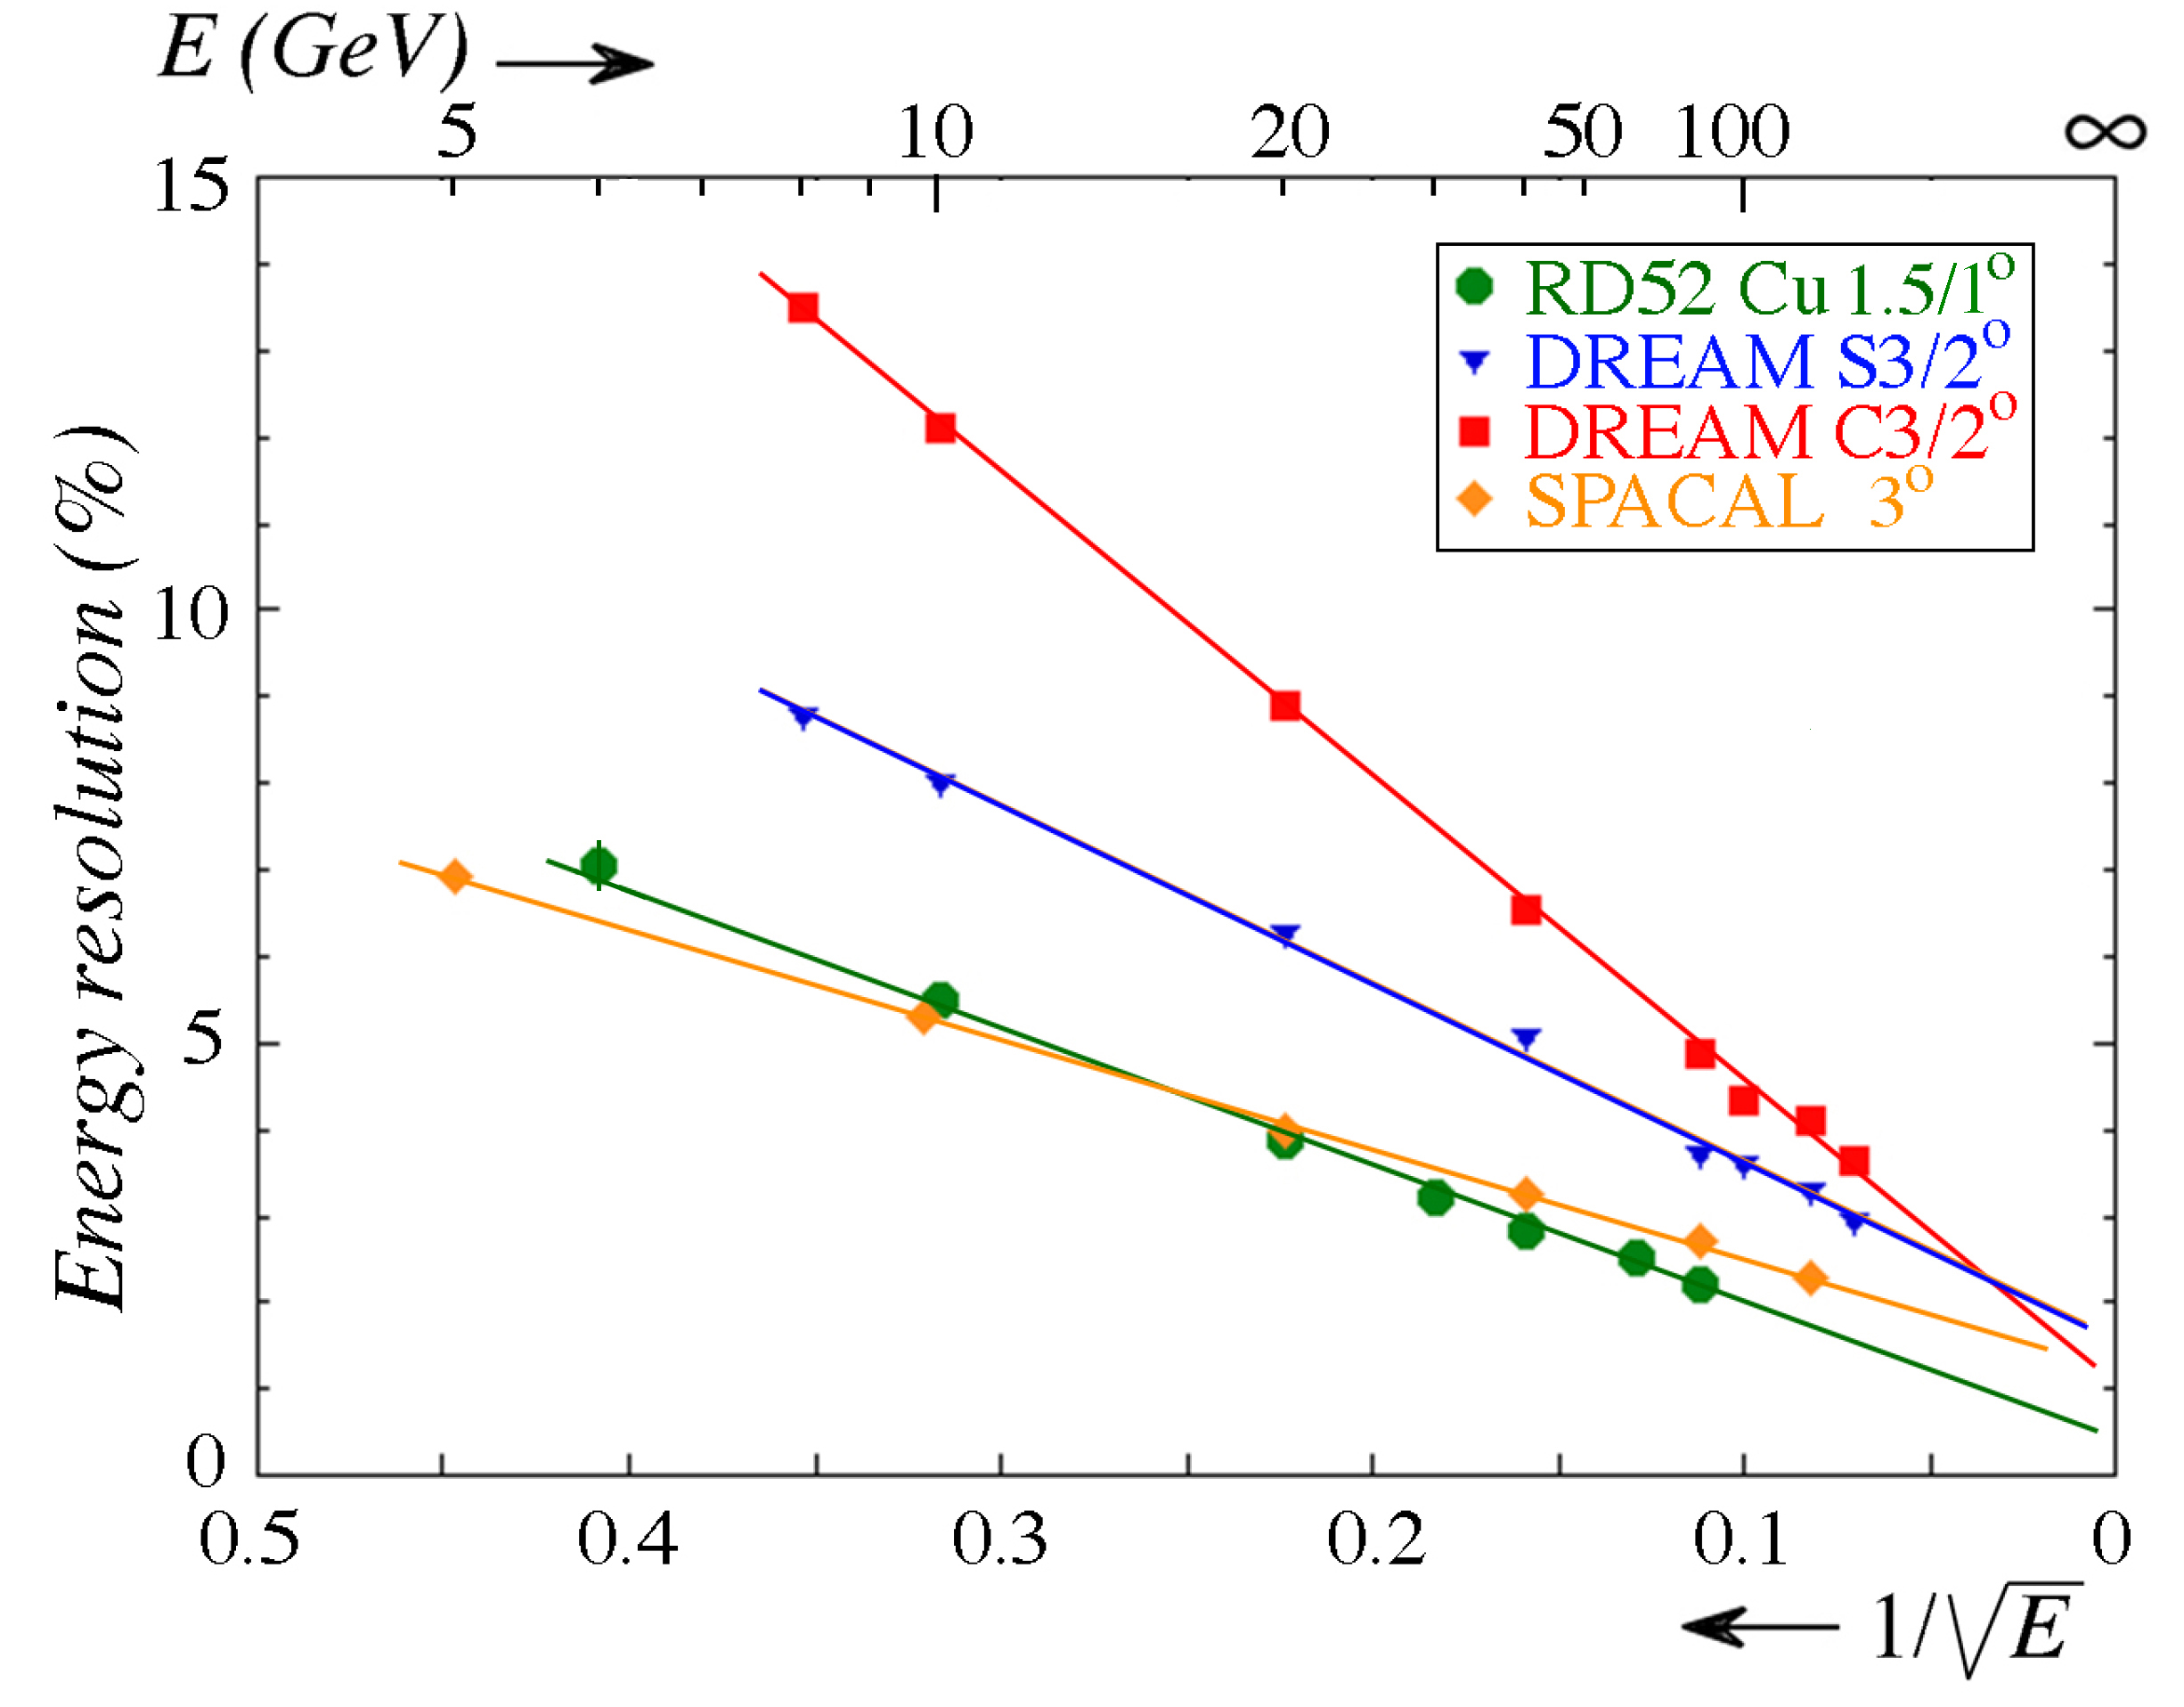
To investigate the electromagnetic performance, the Cu-fiber module was exposed to various electron energies. Fig. 3 shows the energy resolution as a function of . The blue inverted triangles and the red squares are the energy resolutions for the scintillation and Cherenkov channels, respectively. The Cherenkov channel is well described by the straight line, and this suggests a very small constant term. The scintillation channel, on the other hand, deviates from the linear behaviour by 2 to 3%. This deviation comes from the response difference between particle hitting the absorber first or the scintillation fibers first.
Combining the two signals, the energy resolution is clearly improved as the green circles in Fig. 3 show. The green straight line fit results in a resolution
with constant term of less than 1%.
It is useful to compare the electromagnetic performances of the RD52 calorimeter with that of other fiber calorimeters such as SPACAL[1] and the old DREAM (the first prototype dual-readout calorimeter)[2]. Fig. 3 shows that the RD52 calorimeter has better energy resolution than DREAM (thanks to the improved sampling fraction). Moreover the energy resolution of our copper calorimeter comparable to SPACAL and better than that for energies larger than 20 GeV.
2.2 Hadronic performance

Fig. 4 (a), (b), and (c) shows the Pb-fiber calorimeter responses to of 20 GeV, 60 GeV, and 100 GeV pions, respectively. The top three plots show the scintillation (blue) and Cherenkov (red) signal distributions for those three energies. These are typical non-compensating calorimeter response to hadrons. Their response functions are non-Gaussian and the average energies measured are lower than the beam energies. The energy resolutions in the scintillation channel are 20%, 15%, and 13% respectively.
However, we can use the dual-readout method described in Eq. 1 to reconstructs the corrected beam energies with Gaussian response functions, and significantly improve the energy resolution. After the dual-readout correction the resolutions become 13.5%, 8.3%, and 7.0% respectively.
Fig. 5 (a) shows the calorimeter responses as a function of pion energy for the scintillation, Cherenkov, and combined channels. The responses of the scintillation and Cherenkov channels are, on average, 70% and 45%, of that of electrons of the same energy. But the dual-readout method correction restores the electron energy scale and the linearity of the response.
As we have already mentioned the RD52 calorimeter lateral size is smaller than the average lateral size of the typical hadronic shower and its resolution is negatively affected by shower leakage. To see how a bigger module can improve the hadronic performance, we simulated the performance of a 6565 cm2 RD52 fiber matrix with GEANT4 [3] for 50, 80, 90, 100 and 200 GeV pions. We used two physics lists such as FTFP_BERT and FTFP_BERT_HP[4], the second one being much slower but with a high precision neutron model used for neutrons below 20 MeV.

In Fig. 5 (b), we compare the results obtained with the RD52 calorimeter and SPACAL, with the simulation. SPACAL with a stochastic term of still holds the world record for the hadron energy resolution. It was a relatively larger detector than the RD52 calorimeter, so that the leakage fluctuation has a negligible contribution to the the hadronic energy resolution.
First we simulated a dual readout Pb-fibre calorimeter the same size of the real RD52 Pb matrix (27.627.6 cm2) using the FTFP_BERT physics list. The performance of this detector with 100 GeV pions is shown with a blue circle in Fig. 5 (b) and is consistent with the experimental results.
Following this result, we investigated the hadron performance of a larger version of the RD52 calorimeter (6565 cm2, equivalent to a 4x4 matrix) using the FTFP_BERT_HP for 50, 80, 90, 100 and 200 GeV pions (see Fig. 5 b). These simulations indicate that a dual readout calorimeter large enough (and in a collider experiment it certainly would be) to have negligible lateral shower leakage would have an hadronic resolution of about and a very small constant term.
Our simulation predicts that the dual-readout method calorimeter can achieve the high-quality hadron and jet energy measurement with a much better electromagnetic resolution than that of a compensating calorimeter.
2.3 Particle identification
Identification of isolated electrons, pions and muons is of particular importance in particle colliders, for the study of the decay of Higgs bosons into pairs of leptons. In the following we discuss the possibly of doing particle separation with the RD52 Pb-fibre calorimeter. Such an ability would be a great asset for an experiment at a future Higgs factory.
The particle beams in the H8 beam line typically contain a mixture of electrons, pions and muons. Using the auxiliary detectors described above we can select the following samples:
- Electrons
-
are identified as particles that produced a signal larger than that of 2 minimum ionizing particles (mips) in the PSD. We also require a signal compatible with electronic noise in the TC and MuC. The total scintillation signal in the calorimeter should be larger than 15 GeV for the 20 GeV beam and larger than 50 GeV for the 60 GeV beam.
- Pions
-
are particles that produced a signal compatible with a mip traversing in the PSD, and a signal compatible with noise in the MuC. The total scintillation signal in the calorimeter should be larger than 7 GeV.
We have developed several techniques techniques to identify the nature of a particle using our Pb-fiber calorimeter.
The first separation method uses the lateral shower size to distinguish between em and hadronic showers. The calorimeter towers have a lateral size of 1.6 Moliere radii, or 0.2 nuclear interaction lengths. Our measurements show that electrons hitting the center of a tower deposit typically 85% of their energy in that tower, while hadrons typically deposit only 40–50%; this is shown in Fig. 6.
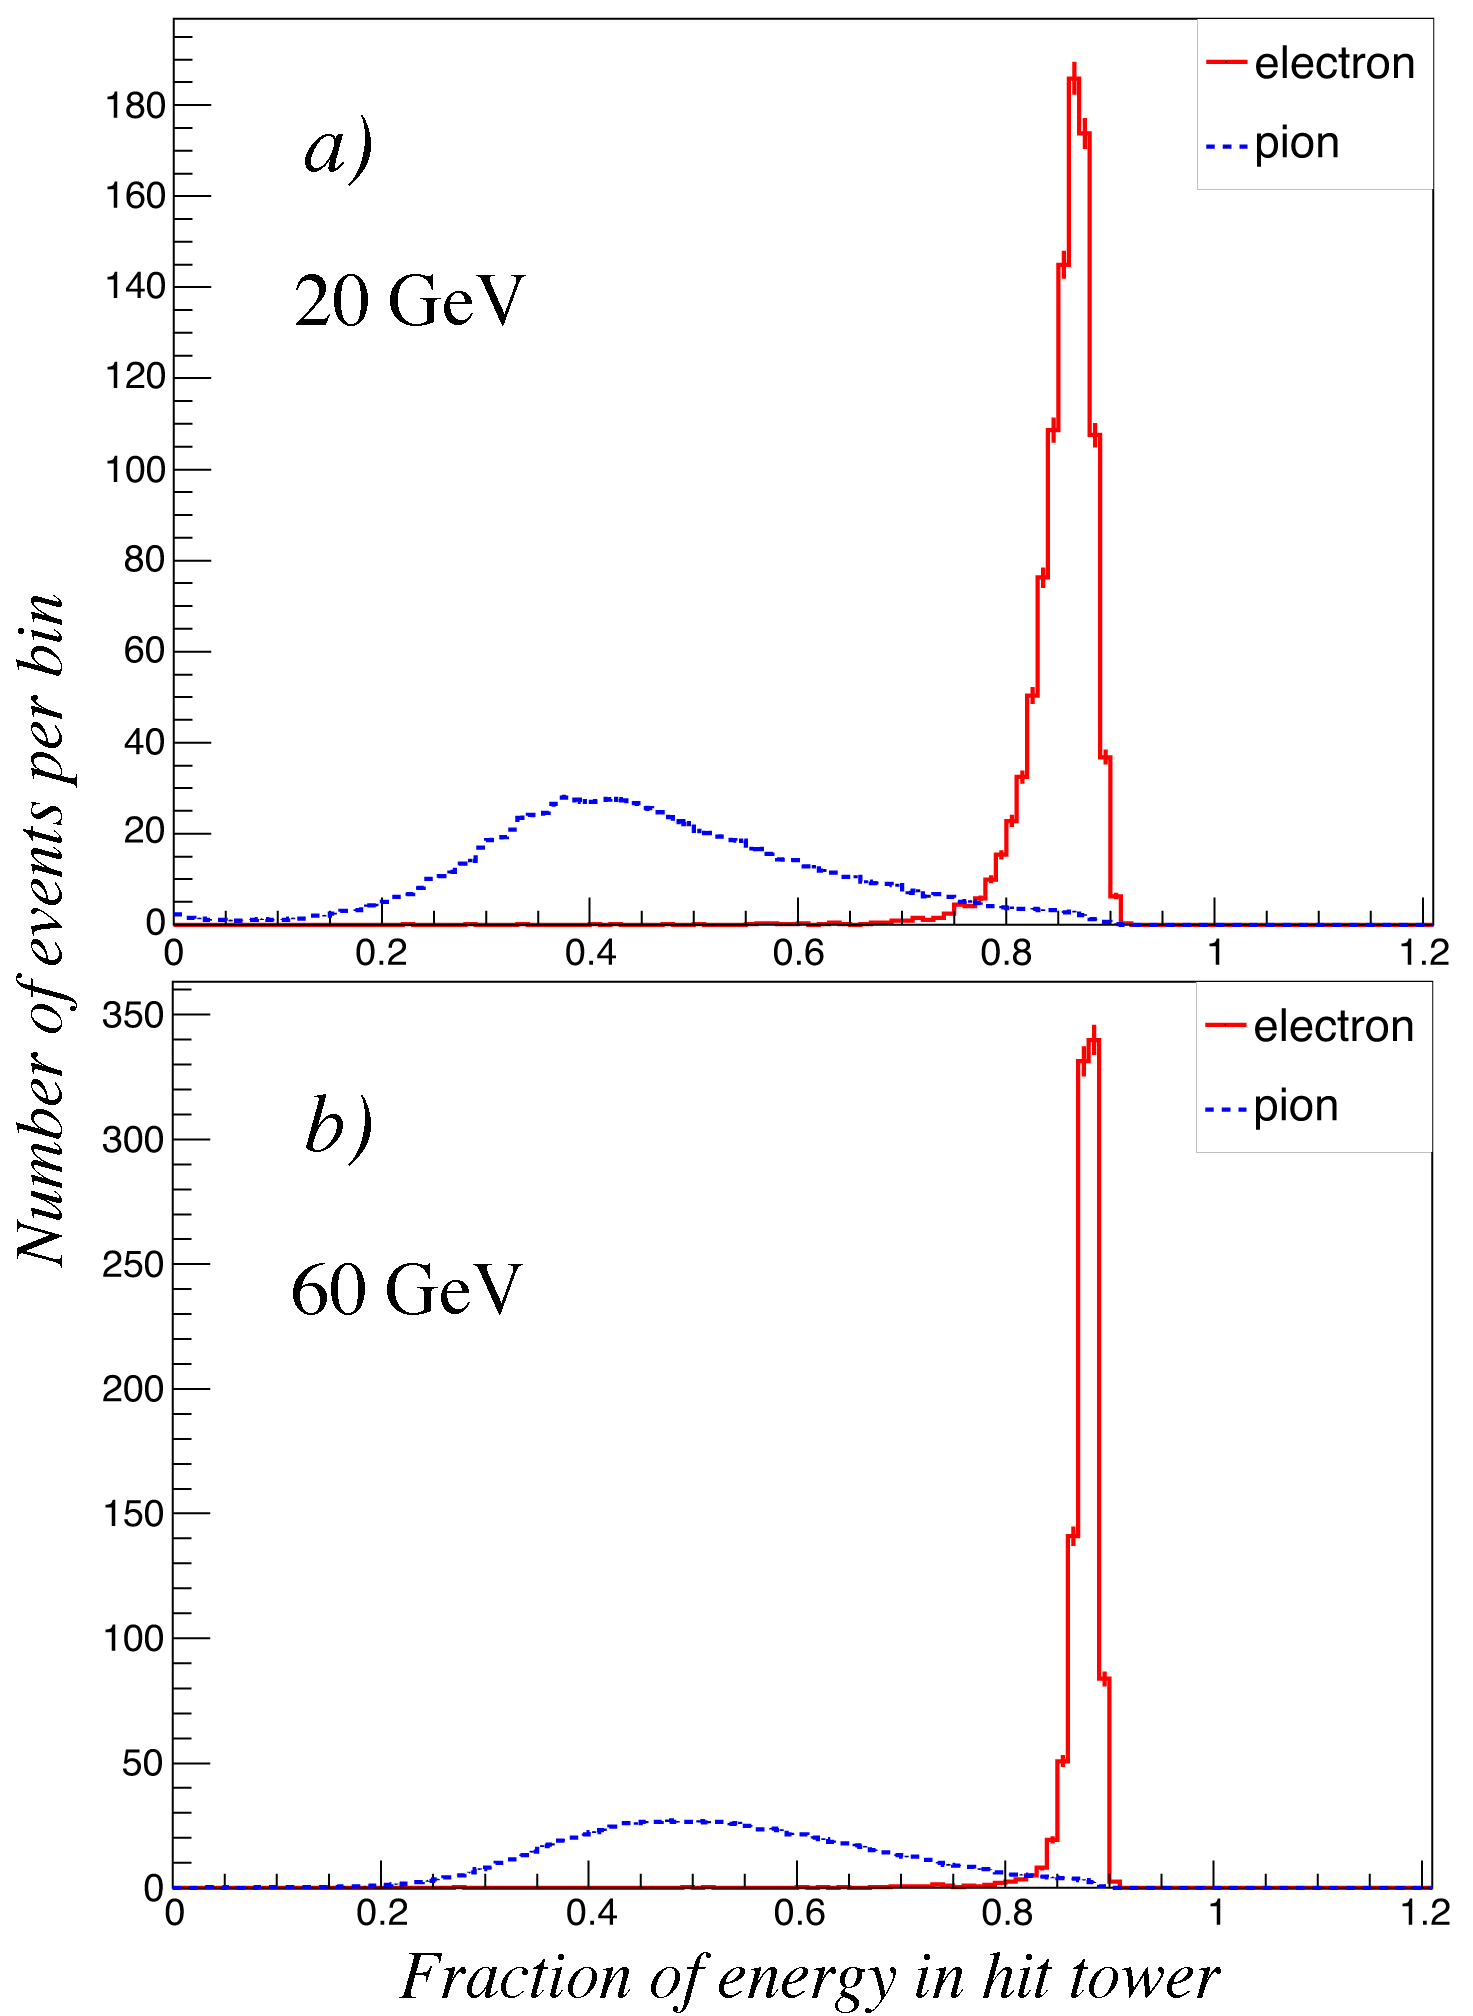
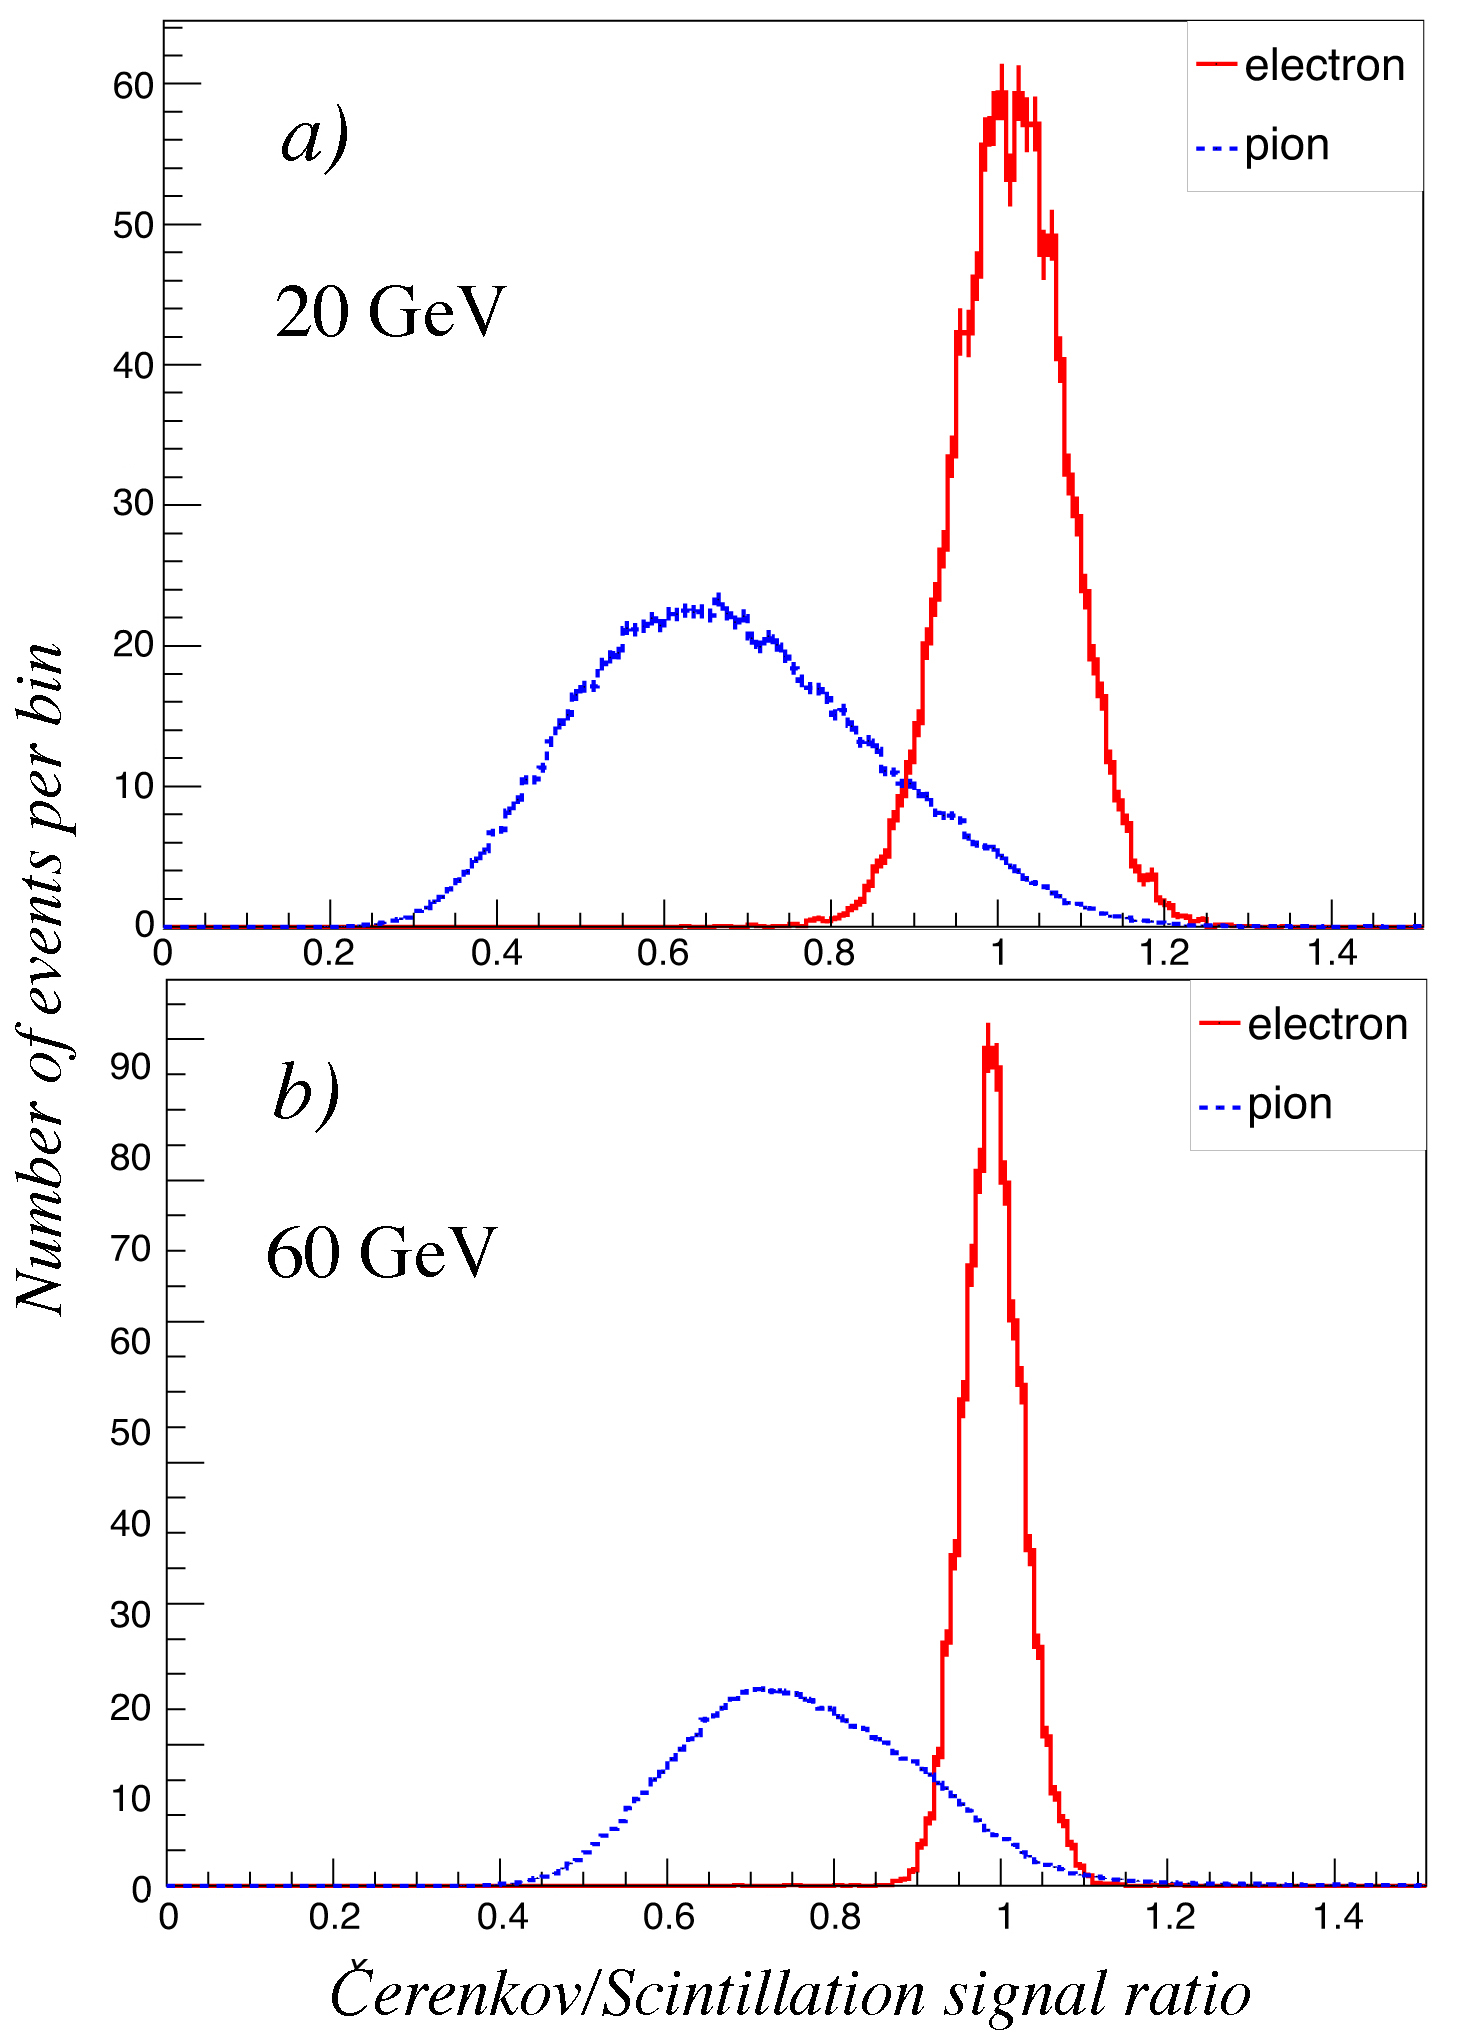
A unique aspect of a dual readout calorimeter is the fact that two types of signals are produced: scintillation (S) signals and Cherenkov (C). The ratio of the two types of signals, , is typically around 1 for electron showers, while it is smaller than 1 for hadron showers. Fig. 6 shows the distribution of the C/S signal ratio for electrons and pions, at energies of 20 and 60 GeV. The width of the electron distribution shrinks because of the reduced event-to-event fluctuations, while the average value of the pion distribution increases because of the increased em shower fraction.
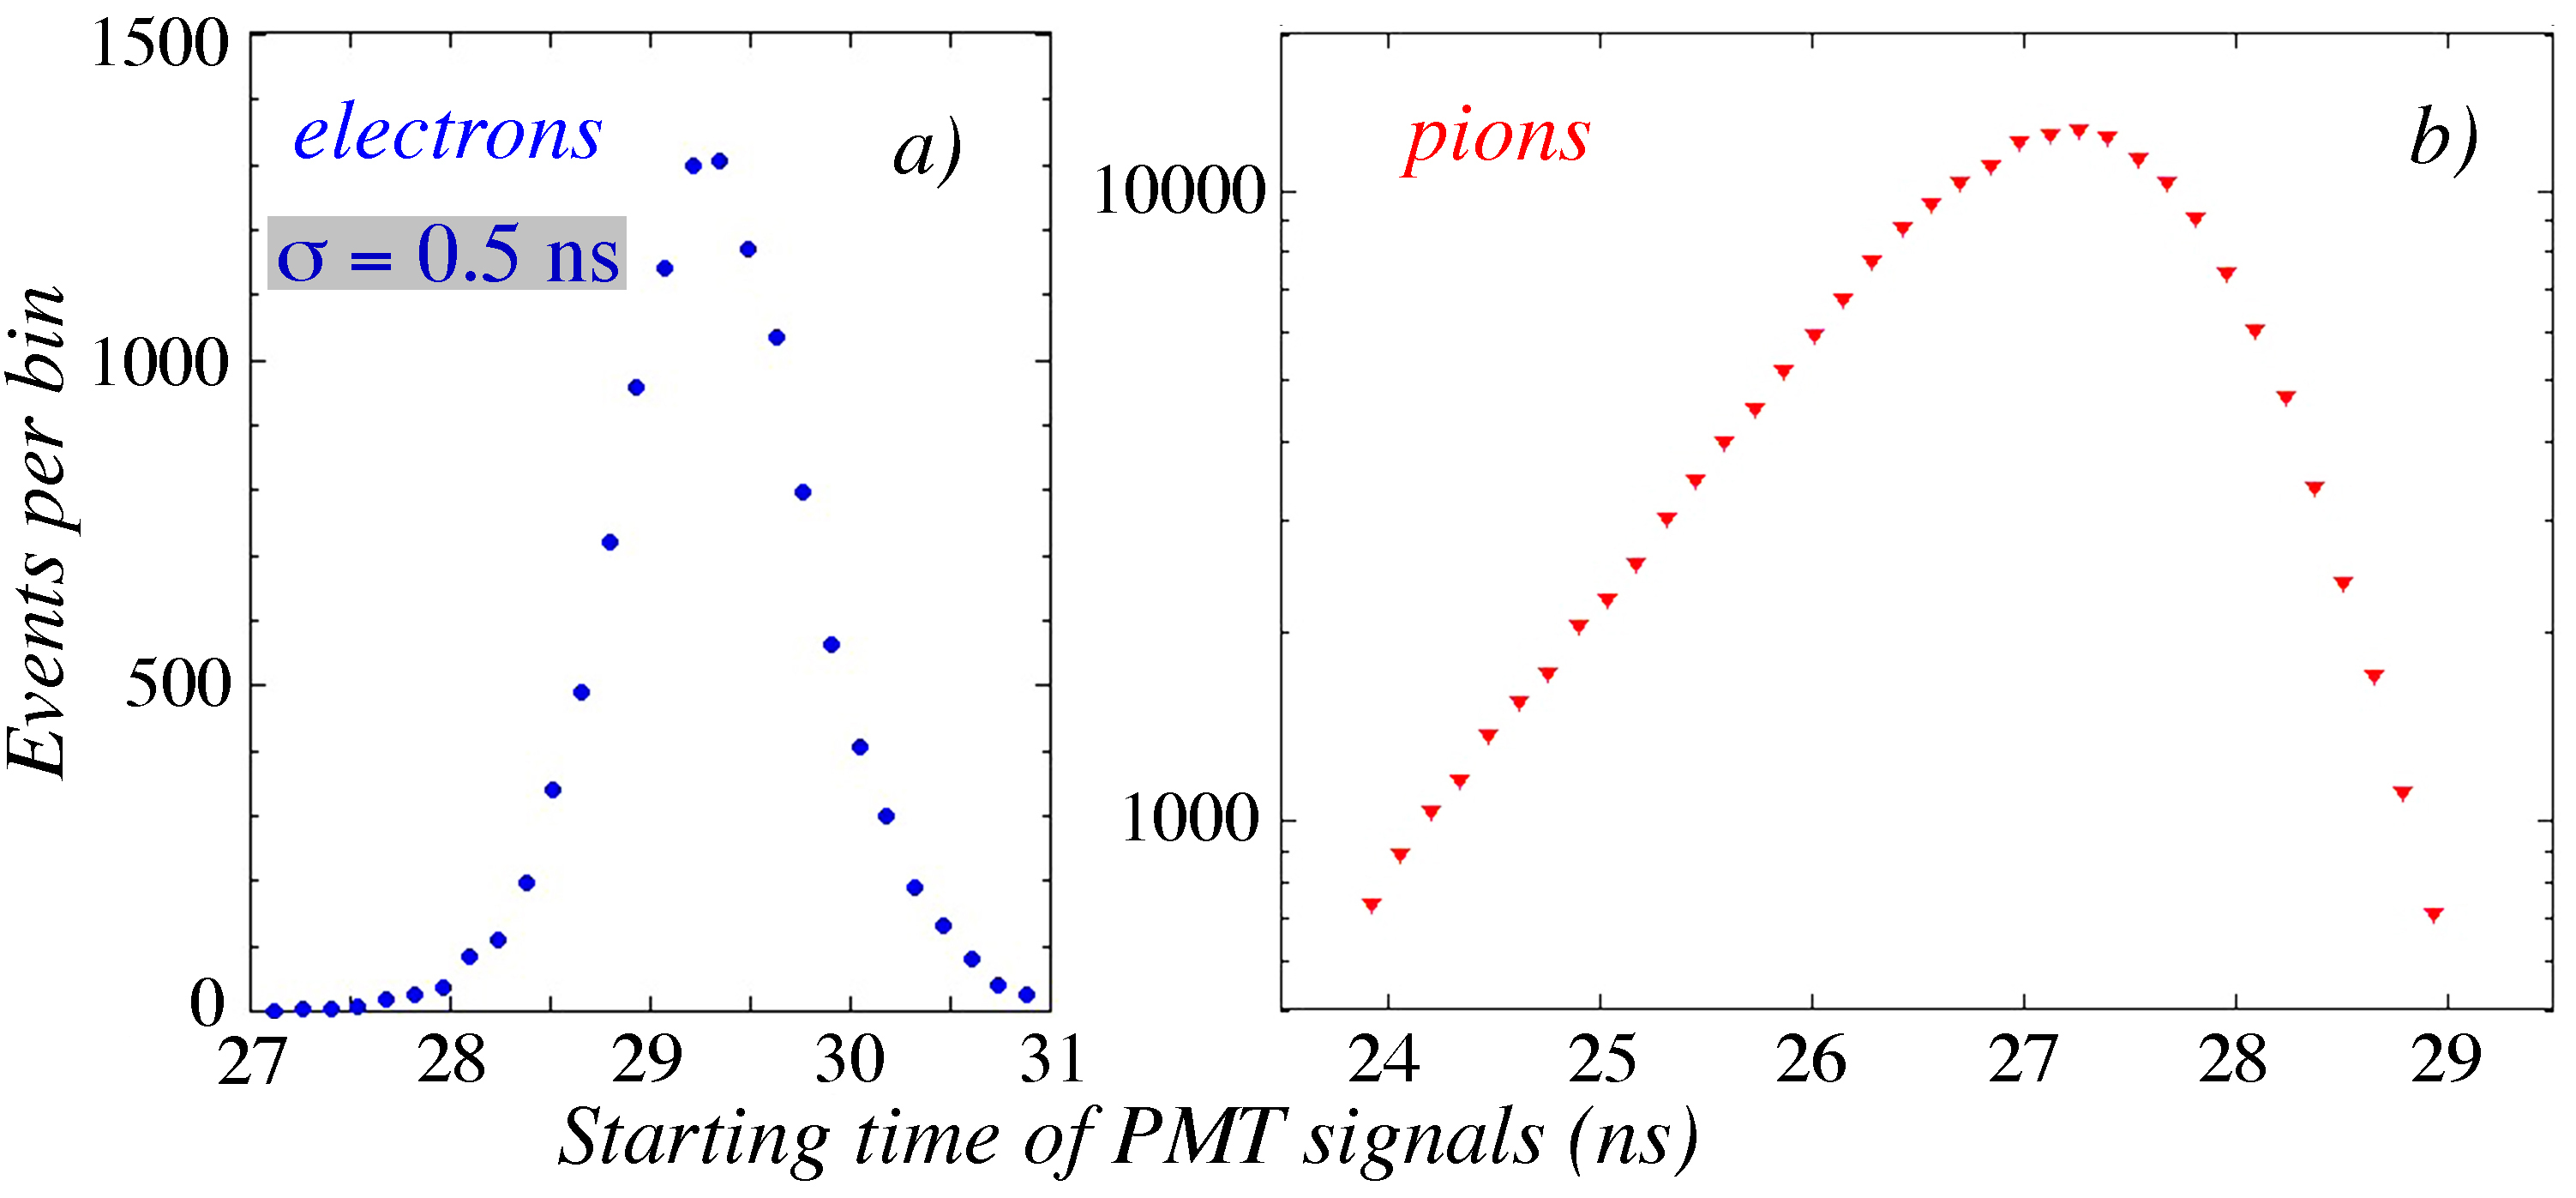
Measurements of the average depth at which the energy is deposited inside the calorimeter provide a powerful tool for particle identification. In longitudinally unsegmented calorimeters, this depth can be measured using the fact that the light in the optical fibers travels at a lower speed ( for polystyrene based fibers) than the particles that generate this light (close to ). As a consequence the the deeper inside the calorimeter the light is produced, the earlier the PMT signal. The depth of the light production can be determined for individual events can be determined with a precision of . Fig. 7 shows the measured TDC distribution for 60 GeV pions and electrons; pions peak 1.5 ns earlier than electrons. The effect of the PSD on this measurements is estimated to be smaller than .
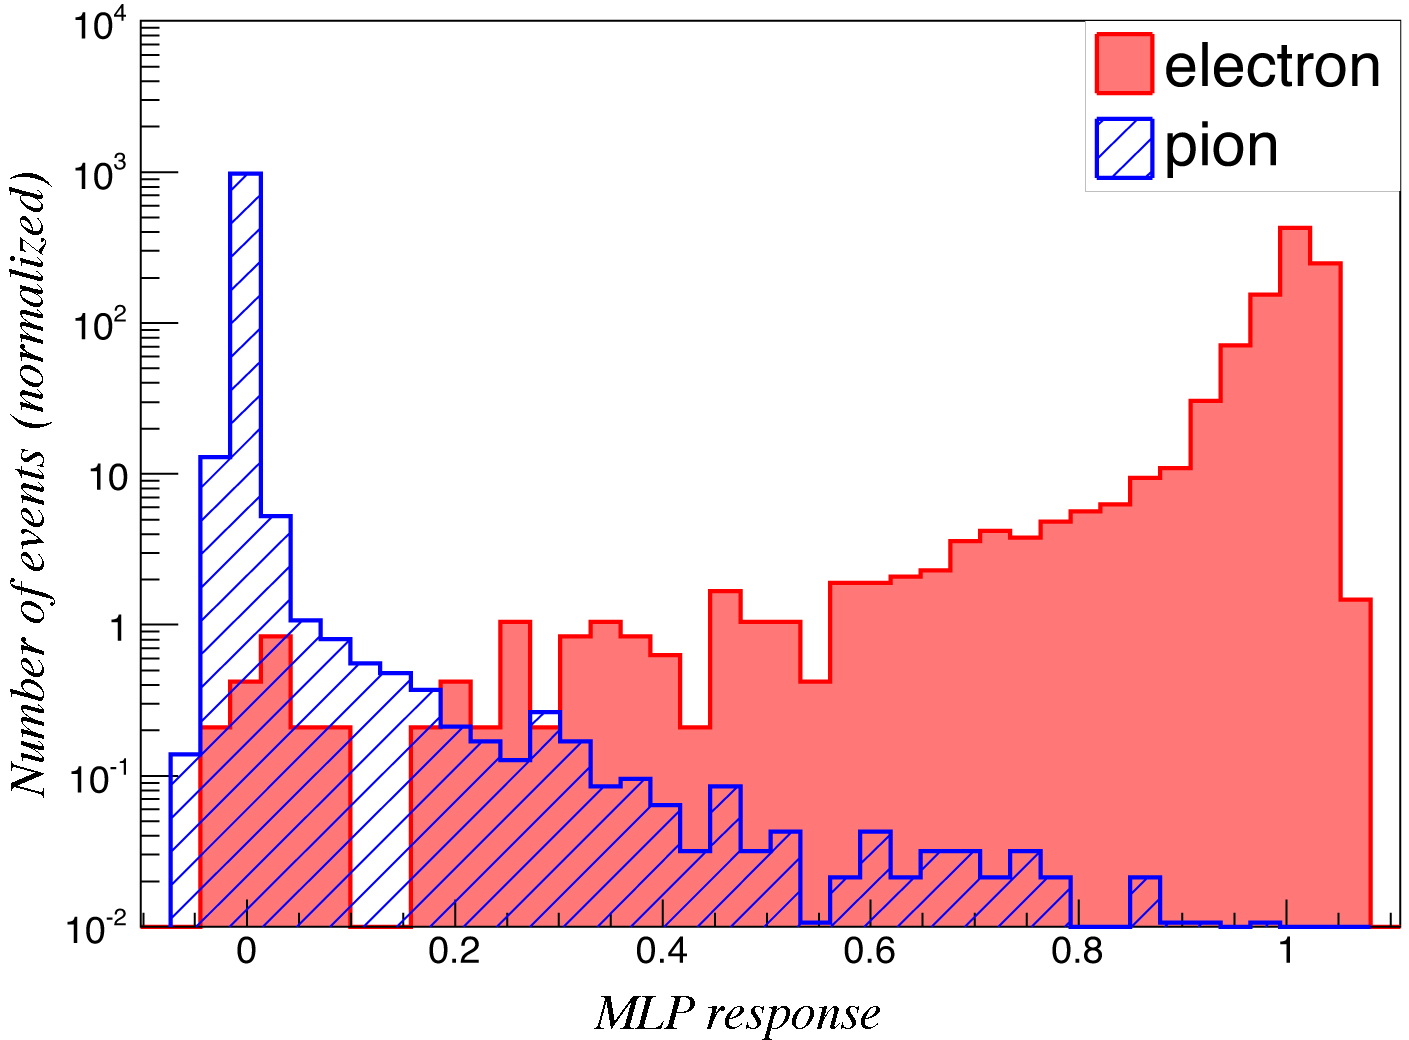
A high degree of separation can be achieved by combining different methods: using a multi-layer perception can identify 99.8% of all electrons with 0.2% pion contamination (see Fig. 8).
More information on these studies, including the treatment of another method based on the PMT pulse width, can be found in [5].
3 Construction of the RD52 fiber prototypes
The tested calorimeter prototypes were built in 2012 inside the INFN
mechanical workshops of Pavia for the lead modules [15]
and of Pisa for the copper ones.
The geometry chosen for the lead and copper profile represented the
best compromise between the limitations given by the production technologies
and the need to maximize the sampling fraction and the sampling frequency
of the calorimeter. One of the most challenging aspects of building
this type of calorimeter is the problem of how to get very large numbers
of optical fibers embedded in a uniform way in the metal absorber
structure.
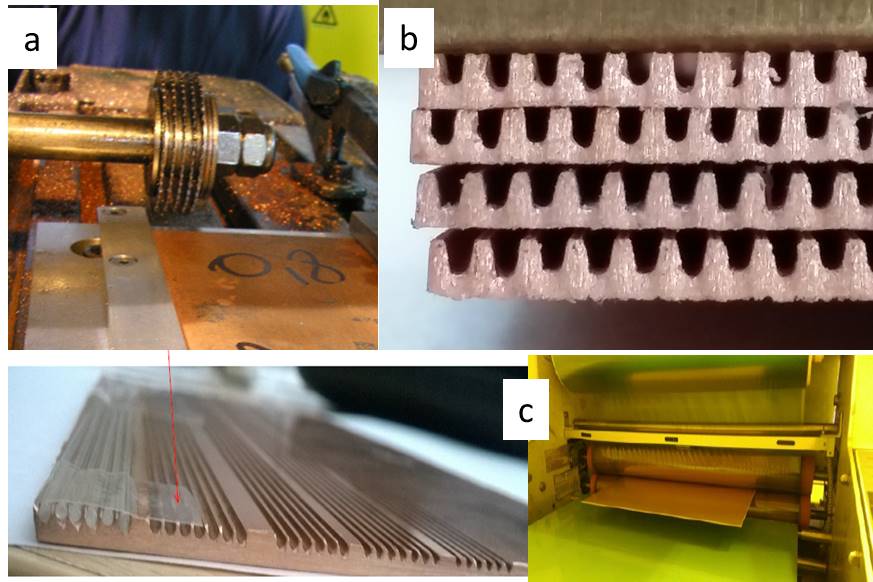
In case of the lead absorber, a regular structure with equidistant fibers was chosen (Fig 9 b), while for the copper absorber another solution was adopted: grooves were created only on one side of each absorber plate, due to the difficulty to machine both sides of the copper plates. In this case the Cherenkov and scintillating fibers were alternated in a single layer (Fig 9) a. The sampling fraction was calculated to be 4.5% and 5% in the case of copper and lead geometry respectively.

3.1 Choice of fibers
Before the beginning of the prototypes construction, we have chosen the type of fibers more suitable for our application, in term of numerical aperture and absorption length. A test bench was built at the INFN Pisa in order to measure the fiber absorption length. A led and the light produced by the Ru106 decay (above the Cherenkov threshold) were used. For the scintillation signal fibers Kuraray doped SCSF-78 were chosen. Before the PMT each S channel was also equipped with a yellow filter to eliminate effect of self absorption, higher at shorter wavelengths. For the Cherenkov light, Mitsubishi Polymethyl Methacrylate Resin (PMMA)[7] based fibers SK40 were chosen. Their attenuation length was measured to be 6m.
In order to farther increase the Cherenkov light yield, clear fibers used in one of our copper prototypes have been aluminized on one side with the spattering technique at Fermilab.
3.2 The Pb-fibre matrix
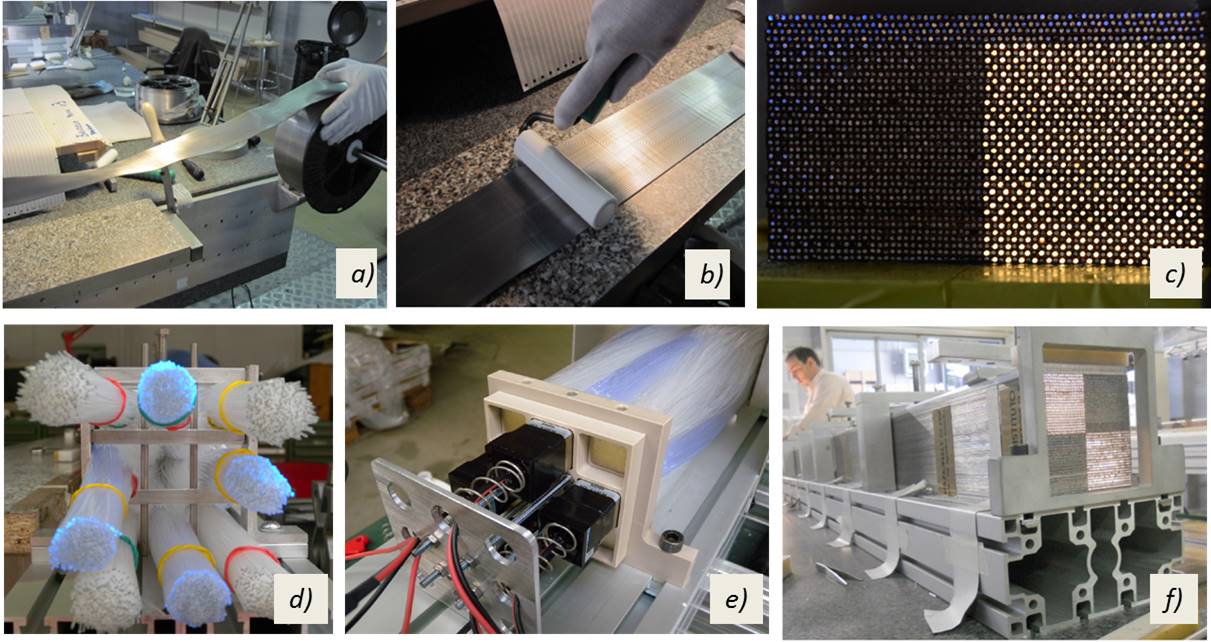
The nine lead modules were arranged for the test beam in such a way to form a 3x3 matrix as is shown in Fig 9 right, on top of them the two copper prototypes were lated. For the construction of the nine lead modules, lead plates were produced by an Italian company by the cold extrusion process; after few months of development, the mechanical tolerances were measured to be suitable for our needs: nominal thickness of 1 mm with a tolerance of 50 m, a fiber-to-fiber distance of 2 mm and a total width of 9.3 cm. Extruded lead was shipped by the producer rolled up on a reel; during the assembly phase each plate was cut at the nominal length (2.5 m), stretched with a roller (Fig 10 a and b) and placed on a worktable (Fig 10 e), where the stacking process occurred. Each layer of fibers was created, by laying carefully 46 fibers of a given type in each of the lead grooves. The stacking continued, alternating layers of Cherenkov and scintillating fibers, until the height of the module reaches 9.3 cm.
For each module, eight fiber bundles (4 scintillating and 4 Cherenkov) depart from the rear end and are glued to a support and are milled before being connected to a PMT (Fig 10 c and d).
3.3 The Cu-fibre modules
For the copper prototypes construction has turned out that copper itself is a particular difficult material to work with such high density aspect ratio. We have tried many different ways (e.g. rolling, extrusion), but so far only machining grooves in thin copper plates has provided the desired quality. This is why the design was slightly modified in order to etch grooves only on one side of the copper plates (see Fig 9 a). For the first two prototypes, copper planes were grooved with a rotating saw (water cooled) as is shown in Fig 11 a. The rotating saw was fabricated specifically for this application, with four parallel lames on a common rotating tool. Once the copper planes were prepared (50 cm long), the assembly procedure was similar to the one used for the lead module, with some differences, like the fact that copper plates were laid one after the other in order to reach the 2.5 m of total longitudinal length, and that between one layer and the other some glue was used and pressed during the night.
.
3.4 Industrialization of the construction process
Copper is a better material than lead for the dual readout calorimetry because of the much better electromagnetic resolution. However, in order to be able to produce in the next future a real scale, full containment copper calorimeter with such high sampling frequency as the one we tested so far, we need to find a less time consuming and an industrial-compatible technique for making grooves in copper.
The method used with rotating saws is time consuming if is needed to be applied in large scale. We have then tried other ways and from these studies the more promising ones seem to be chemical milling and water grooving. After having started the rough grooving process with one of the two methods one could finish the grooving process with rolling to better define the precision of the grooves. First trials of chemical milling were done at CERN using the classic photolitography technique (Fig 11 c) and tuning the width of the mask and the exposure time to the chemical bath. First trials of water grooving were done at the Iowa State University (Fig 11 b) tuning the water pressure and the jet speed.
Finally, toward a fully projective fiber calorimeter structure, the possible geometry has been studied years ago by the RD1 collaboration [6] and this geometry could be still applied for the dual readout fiber calorimeter.
3.5 Future directions
In order to study the possibility to use a dual readout, not longitudinally segmented calorimeter, for a future collider experiment, the RD52 collaboration is also equipping one of the copper modules with Silicon photomultipliers readout. This readout way offers the possibility to eliminate the forests of optical fibers that stick out at the rear end and also to chose a trasnversal segmentation at a fiber level, if it is needed. With PMT readout, fiber bunches (Fig10) occupy precious space and act as antennes for particles that comes from other sources than the showers developing in the calorimeters. Tests of this new readout is part of the experimental program foreseen for the coming fall.
4 Dual Readout Calorimetry with Crystals
Using high-Z crystals as dual-readout calorimeters offers potential benefits, since one could then in principle eliminate or greatly reduce two remaining sources of fluctuations that dominated the hadronic resolution of the fiber calorimeter: sampling fluctuations and fluctuations in the Cherenkov light yield. In case of using homogeneous media, the light signals generated in the crystals into scintillation (S) and Cherenkov (C) components need to be decomposed. In recent years we have developed four different methods to separate these two components, exploiting their different properties:
-
•
differences in the angular distribution of the emitted light,
-
•
differences in the spectral characteristics,
-
•
differences in the time structure of the signals,
-
•
light polarization in case of Cherenkov
These methods were experimentally investigated and optimized -for three different types of crystals: bismuth germanate (Bi4Ge3O12, BGO) [8], bismuth silicate (Bi4Si3O12, BSO) [9], [10], and lead tungstate (PbWO4) [8]. The latter crystal was also doped with small amounts of impurities (Molybdenum and Praseodymium) to further improve its dual-readout characteristics [11]. However, of these four methods only the differences in the spectrum and in time structure are easily applicable in hermetic detectors needed for 4 experiment at particle colliders.
4.1 Undoped PWO crystals
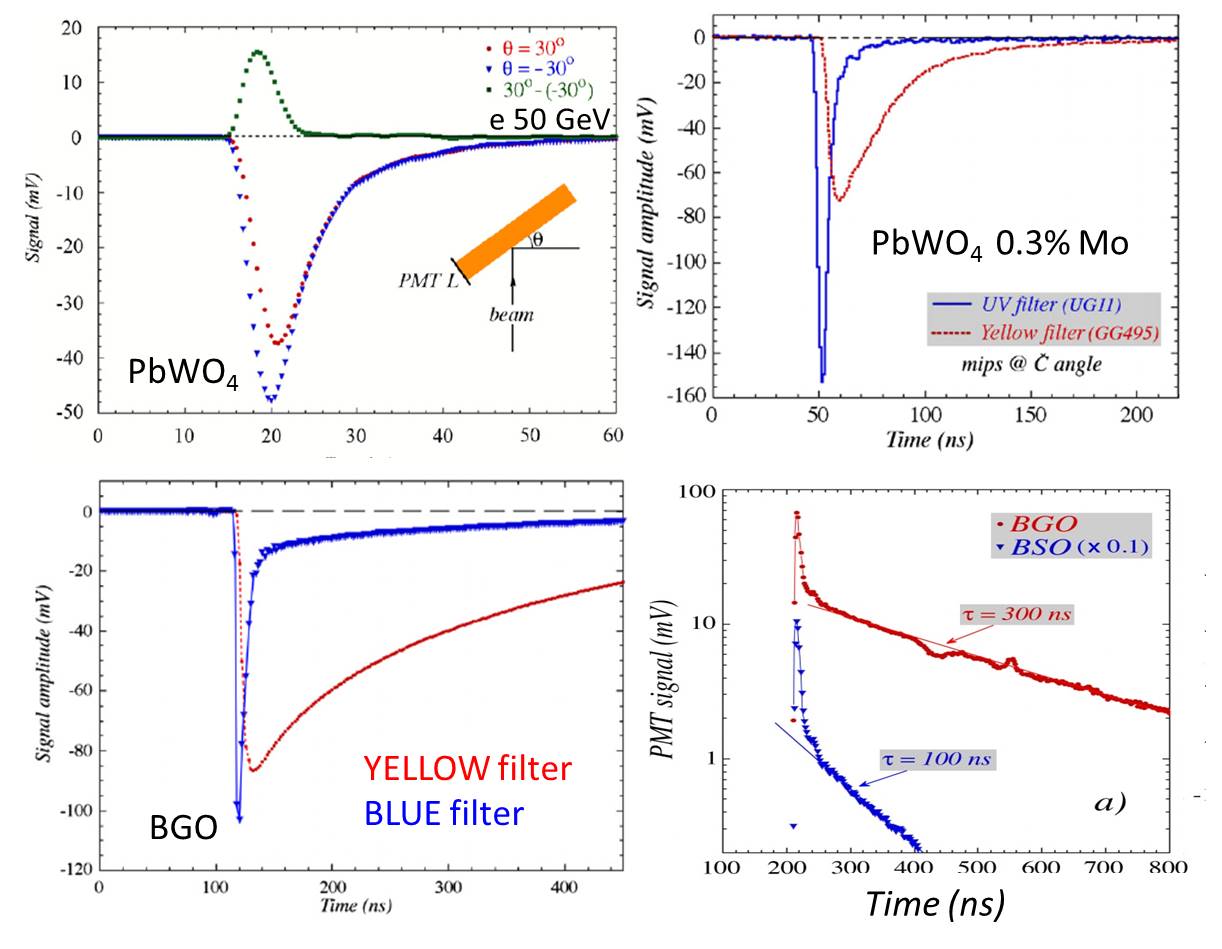
The first tests that proved the feasibility of separation of Cherenkov from Scintillation light in homogeneous media were done on a single PbWO4 crystal [12], [8], and exploited the directionality of Cherenkov light. Results are shown in Fig 12 a, where one can see the average time structure from the crystal oriented at +30 and -30 degrees with respect to the incoming electron beam. The difference of the two signals is an indication of the Cherenkov component, that makes the leading edge of the forward signal much steeper than the backward one.
After these promising first studies, an intense R&D program of Dual Readout calorimetry with crystals started. In order to exploit the difference in spectral emission of scintillation (that has a characteristic emission spectrum, depending from the type of crystal) from Cherenkov light (wih a 1/ behavior), four optical transmission filters were used in our studies, all were 3 mm thick and made of glass; each of them had 90% of transmission for different wavelengths: UG11: nm , UG330: nm, UG5: nm, GG495: nm. For the isolation of the Cherenkov component, a cut towards shorter wavelengths ended up with the effect to have less contamination of scintillation light but, on the other end, Cherenkov signals obtained with this filter were rather small and strongly depended on the distance the light had to travel to the PMT. Different combination of filters were used in order to find the right compromise.
4.2 BGO crystals
The importance of optical transmission filters for our purpose was first demonstrated with BGO crystals [8] and then successfully applied to Mo-doped PbWO4 ones [11]. Fig. 12 b and c shows the typical signal shapes for events in which beam particles traversed a single crystal placed perpendicular to the beam line. One side of the crystal was equipped with a “yellow” (GG495) transmission filter, the other side with a UV (UG11) one. The UV filter absorbed more than 99% of the scintillation light, while a large fraction of the Cherenkov light was transmitted. As a result, the Cherenkov component of the light produced by the crystal became clearly visible, in the form of a prompt peak superimposed on the remnants of the scintillation component, which has a longer decay time (25 ns for Mo-PbWO4 and 300 ns for BGO).
4.3 Doped PWO crystals
In [11] one can read about the studies we did in order to optimize PbWO4 crystals for dual readout applications, introducing small amounts of molybdenum and praseodymium doping. The best solution found was 0.3% Mo-doping, which had two important effects for the separation of Cherenkov from scintillation light: the shift of the emission spectrum towards longer wavelengths, making possible to use of optical filters, and the increase of the decay time of the scintillation process from ns to ns, making easier the separation of the prompt Cherenkov component from the delayed scintillation one. In Fig 12 b one can see that for the Mo-doped PbWO4 crystals, we could achieve an almost complete separation of the two optical components.
4.4 Time structure of the light signal
In order to exploit the different time structures between prompt Cherenkov light and scintillation, the pulse shape of the signals produced in these crystals irradiated with electron beams were recorded by means of an high sampling frequency oscilloscope (4 ch) or by 32 channels digitizer based on the DRS-IV chip, with a time resolution up to 200 ps.
The time structure information of the signals was used to determine their scintillation and Cherenkov components, integrating, event by event, the pulse shape in two different gates, as it can be seen in Fig 13. The Cherenkov signal is defined to be the result of the integral of the pulse in the first gate, while the scintillation signal is defined by the integral on the second and more delayed gate. These integrated charges were then converted into deposited energy using appropriate calibration constants (see later for more details).
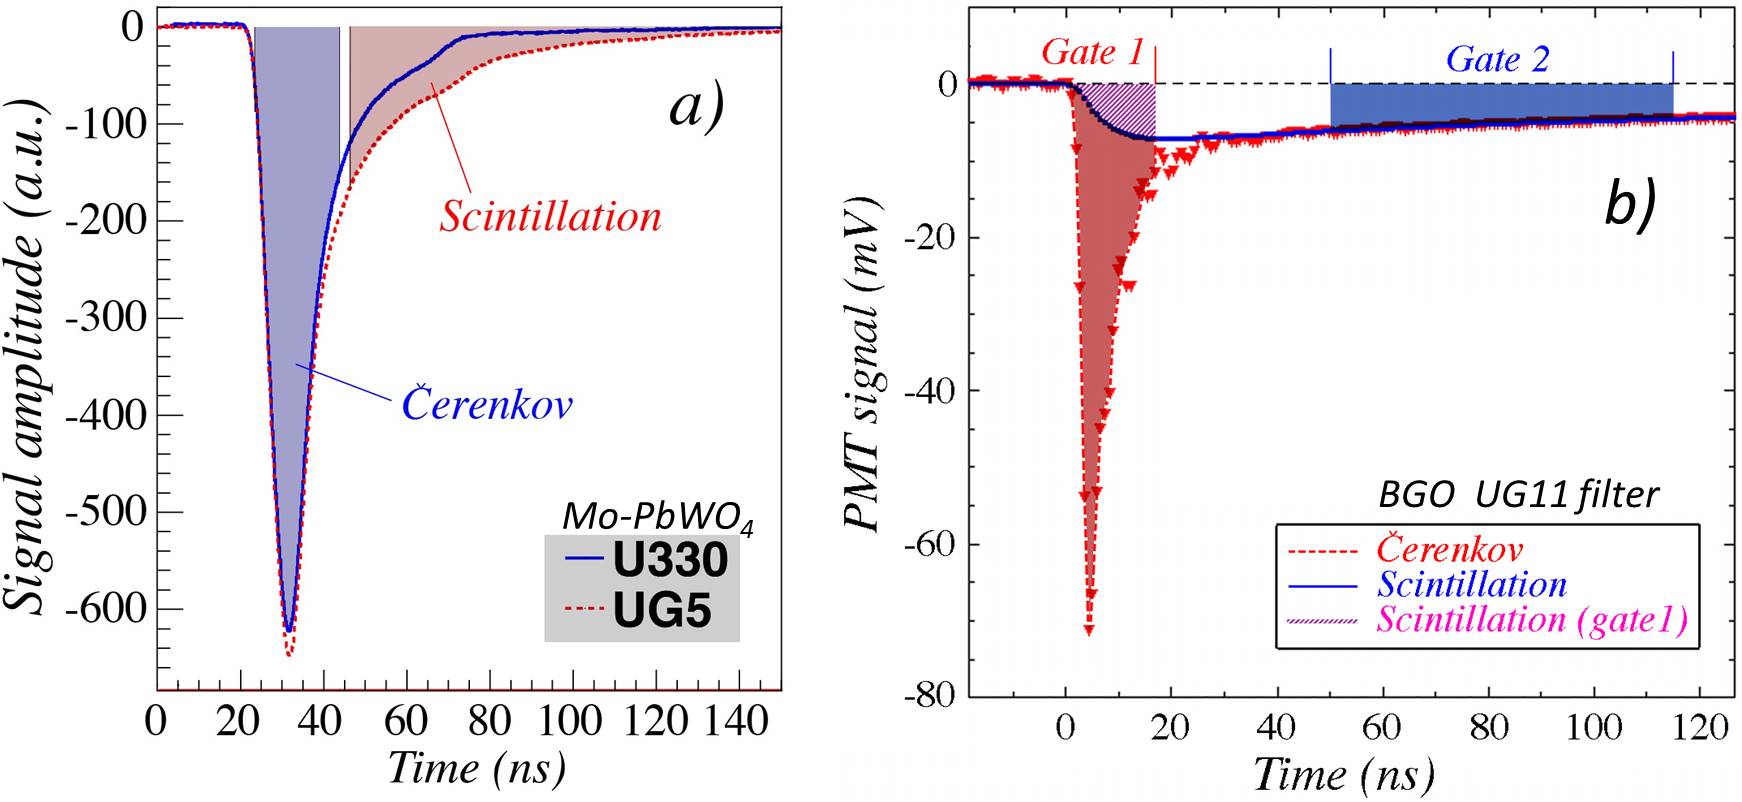
Using the time structure of the signal has the advantage that the C and S components are extracted by the same readout channel, while for the optical filter case two different channels, equipped with different filters are needed. However, as it can be seen from Fig 13, not always the use of time structure from only one readout channel is easy. The result will depend from how much scintillation light is passing from the optical filter bandwidth and from how far in time is the scintillation component from the prompt Cherenkov one. In the case of BGO crystal (Fig 13 b), because of a longer scintillation decay time, one can see that the definition of two well separated time gates is more easy than in the other case. A much higher scintillation light yield is also helpful in the BGO case because the signal filtered by the UV filter is much more “contaminated” by scintillation photoelectrons, that give the characteristic long tail to the time distribution.
4.5 Comparison of BGO and BSO crystals
Another type of crystal that has also been studied for dual readout applications [9] was the bismuth silicate (BSO), which has the same crystal structure as BGO (Bi4Si3O12), with silicon atoms replacing the germanium ones.
We have performed a systematic comparison of the BGO and BSO crystals relevant properties and we found that the BSO crystal could be very promising if one would like to invest more studies in the optimization of crystals for dual readout calorimetry.
First the purity of the Cherenkov signals that can be obtained with UV filters was studied. We found the contamination of scintillation light in the Cherenkov signals to be smaller by about a factor of two in the BSO crystal. Then we studied the number of Cherenkov photoelectrons detected per unit of deposited energy; we measured this yield to be about a factor two to three larger for the BSO crystal. The light attenuation length of Cherenkov light has been found to be approximately the same as the BGO. The cheaper price of BSO with respect of BGO could also be an advantage. In Fig 12 da comparison between the emission spectrum of BGO ( 300 ns ) and the BSO ( 100 ns) it shown. The slightly faster signal of BSO could be an advantage for high energy applicatons, the time scale of hundred of nanoseconds is still ideal for using informations coming only from one readout channel and, as in the case of BGO, using the integral of pulse shape in two well defined time windows.
4.5.1 Electron showers in dual-readout crystal calorimeters
The application of the dual readout technique to an hybrid system made by a crystal matrix (BGO or Mo-doped PbWO4) as electromagnetic section and the original DREAM fiber calorimeter as the hadronic one was evaluated [13].
Thanks to the experience gained with previous single crystal studies on the way to separate the Cherenkov from the scintillation light components, we have also applied to the crystal matrices the same methods: the optical filters and time structure to select the desired type of light.
The BGO matrix was made by 100 BGO crystals, 24 cm long, from a projective segment of the L3 experiment. The segment was placed perpendicular to the beamline (25 X0 deep), as shown in Fig 16 b, in front of the DREAM calorimeter The readout was made in different ways, the most promising results were obtained with 16 square PMTs (Photonis XP3392B) arranged in a way such that each PMT collected light produced by clusters of at least 9 adjacent crystals. Each PMT was equipped with an UG11 optical filter.
The PbWO4 matrix (Fig 16 a) consisted of seven custom made 0.3 % Mo-doped crystals, 20 cm long, arranged in a matrix and placed in the beam line with the beam entering in the central crystal (22.5 X0 longitudinal dimensions). Each crystal was equipped with one PMT on each side (Hamamatsu R8900-100); both faces of the matrix were covered with a large optical transmission filter. Several filter combinations were used during our tests. A calibration procedure was done for both matrices using electron beams.
4.5.2 Calibration
For the PbWO4 one a narrow beam was steered into the center of each of the seven crystals constituting the matrix. According to GEANT4-based Monte Carlo simulations 93% of the energy was deposited in the entire matrix. After the signals from the crystal were disentangled into Cherenkov and scintillation components, the integrated charge in each of these components was determined, equalization constants were found and applied before summing he contribution of each crystal to get the total inter-gate charge. The average value of that total charge for beam particles traversing the center of the matrix was equated to 93% of the beam energy, and this yielded the conversion factor between the normalized integrated charge and the deposited energy.
In the case of the BGO matrix, calibration constants had to be assigned to each of the four PMTs that read out the four longitudinal segments of the matrix into which the showers developed. This calibration procedure was carried out in two steps: first, the gains of all 16 PMTs were equalized, by means of an LED signal with an amplitude comparable to that of a typical electron shower signal. In the second step, 100 GeV electrons were sent into each of the four columns and the HV values of the four PMTs in the hit column were varied, in an iterative procedure, until the energy resolution for the summed signals reached a minimum value. Because of the size of the BGO matrix, size leakage was considered negligible, and we assumed that the integrated charge collected by the 16 PMTs was a good measure of the deposited energy. On that basis, the integrated charge measured in each individual PMT contributing to the signal could be converted into GeV as well.
4.5.3 Linearity of the response
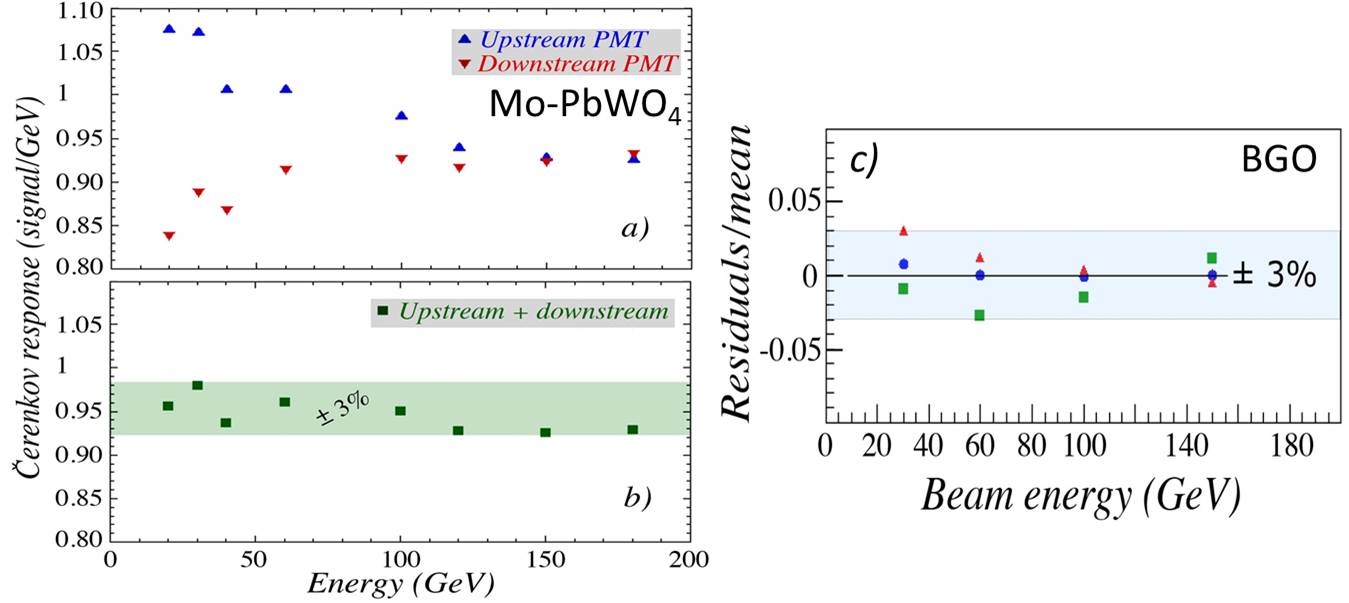
We have investigated the linearity of the observed signals in both crystal matrices and results are shown in Fig 14. In the case of BGO the calorimeter is linear within a 3% for both the C and S components (Fig 14 c). In the case of Cherenkov signal in PbWO4, the linearity is restored only if the signal extracted from the PMTs placed on both sides of the crystals are summed (Fig 14 b). This effect is the result of the strong attenuation of the UV light in these kind of crystals, hence as the energy increases, the shower maximum is closer to the downstream PMT and its response is higher, vice versa for the downstream one, as can be seen in Fig 14 a. In order to obtain a linear Cherenkov response we have equipped both sides of the matrix with a low pass wavelength filter (U330). The main disadvantage of this readout geometry is that the U330 filters transmit almost no scintillation light, as can be seen from Fig 13 a. In an alternative setup, we therefore replaced the downstream U330 filter by a UG5 one, which also transmits light with wavelengths in the region around 500 nm, where scintillation dominates. This led to a usable scintillation signal.
4.5.4 Energy resolution
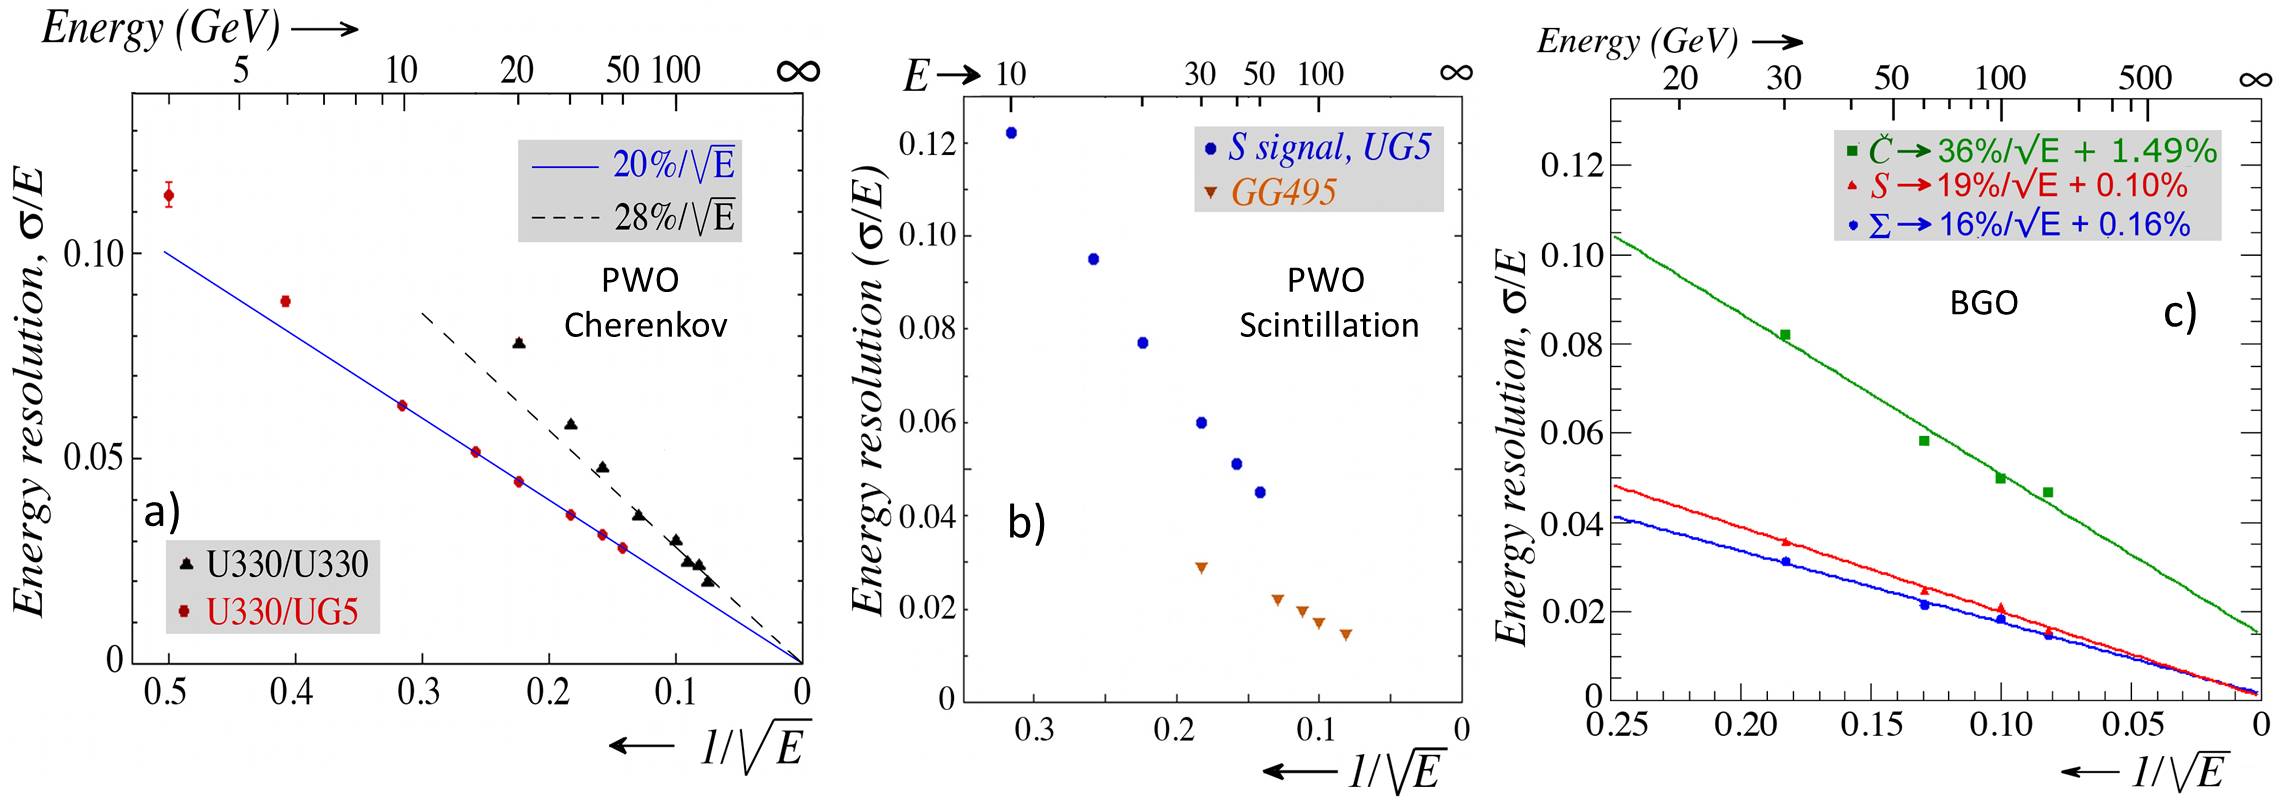
The energy resolution obtained for the Cherenkov channel is shown as a function of the electron energy in Fig. 15 a for these two sets of experimental data. The stochastic fluctuations that dominate the measured energy resolutions were found to contribute 20%/ and 28%/ for these two filter configurations. No evidence was found for an energy independent contribution to the energy resolution. The resolutions measured at the low-energy end of each data set deviate from the straight lines. These deviations are consistent with the contribution of the signal baseline fluctuations to the measured energy resolution. The energy resolution is strongly dominated by fluctuations in the Cherenkov light yeald, this can be seen by the fact that the Cherenkov energy resolution improves if UG5 filter, that transmit a larger fraction of Cherenkov light, is used.
Even though the UG5 filter led to usable scintillation signals, the energy resolution for electron showers measured in the scintillation channel (as an integral of the tail of the signal) was somewhat worse than in the Cherenkov channel, and about a factor of two worse compared to resolutions measured with the yellow (GG495) filter (Fig 15 b). This is of course due to the very small fraction of the scintillation light that was detected in this setup. From the sloped of the lines drown in Fig 15 a the Cherenkov light yield was estimated to be 25 photoelectrons per GeV in case of UG5 filter and 13 for the U330111 From this small amount of Cherenkov photoelectrons one could see that it could be a limiting factor for the dual readout calorimetry. Fluctuations in this small number could affect calorimeter performances. We will see in the next chapter that the RD52 collaboration found higher values of Cherenkov phooelectrons in a sampling dual readout calorimeter, that is nowadays the priority of the collaboration..
In case of BGO matrix the energy resolution measured with electrons in the range 10 - 150 GeV is shown in Fig 15 c:
| (2) |
The resolution obtained for the scintillation component, as well as that for the total collected charge () i.e. the integral over the entire waveform, are well described by scaling, while the energy resolution measured for the Cherenkov component exhibits a deviation, with a constant term b 1.5%. The resolution for this component is affected by significant non-Poissonian fluctuations. This could be due to the fact that in order to use crystals for dual readout calorimetry, we had to apply cuts in the wavelength and in the amount of emitted light; in particular for the C component we selected a very small fraction of of the total light produced in the crystals, in a wavelength range in which that light is strongly attenuated.
In the case of the BGO matrix we have also studied the performance of the whole calorimeter with pion beams [13]. The information collected with the two sections are combined to obtain an overall evaluation of the electromagnetic fraction of the shower. In order to perform such a measurement we selected only those events in which pions start showering in the crystal section.
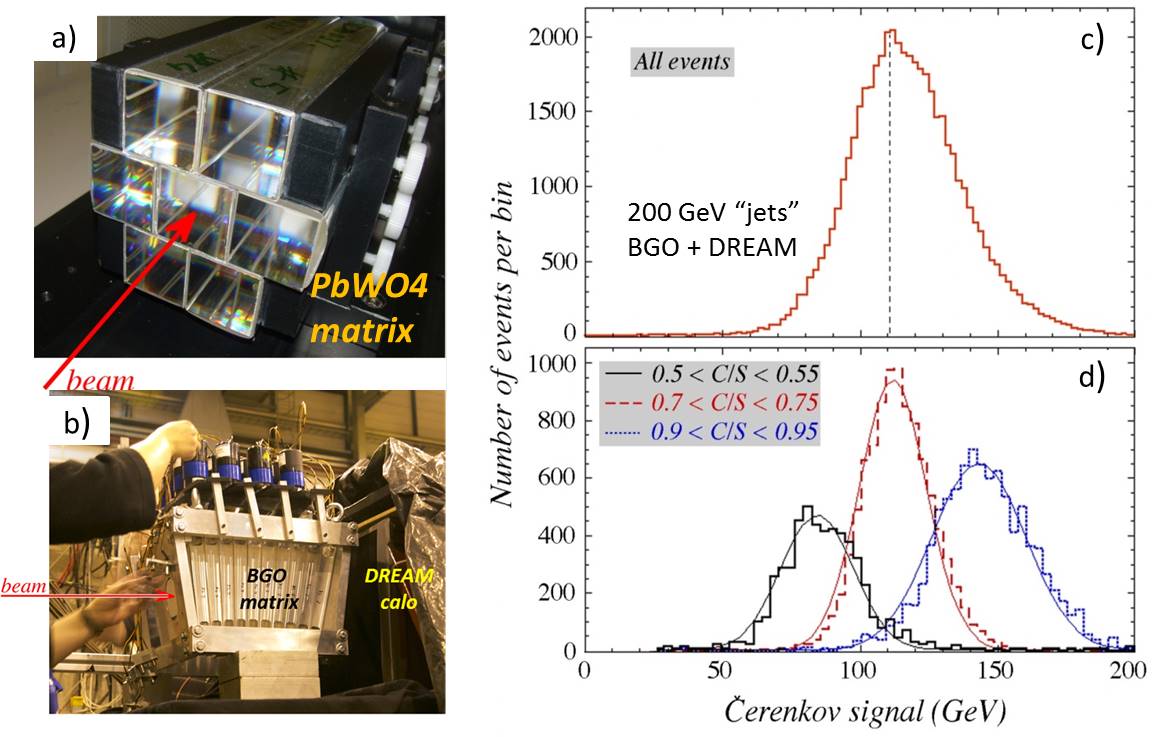
In Fig 16 c the distribution of the total Cherenkov signal of the hybrid system BGO + DREAM fiber calorimeter is shown. This signal is broad, asymmetric and centered around a value of only 110 GeV, whereas the total jet energy was 200 GeV. In Fig 16 d three different subsets of events, selected on the basis of the measured C/S signal ratio are shown. These three distributions are narrower, well described by Gaussian fits and centered at a value that increases roughly proportionally with the C/S value of the selected event sample. This is precisely what was observed for the fiber calorimeter in stand-alone mode, and what allowed to eliminate the effects of fluctuations in the electromagnetic shower component in that calorimeter.
4.6 Future prospects for dual-readout crystal calorimeters
In conclusion to our R&D on crystals for dual readout calorimetry, we can say that our interest in studying high-Z scintillating crystals for the purpose of dual-readout calorimetry derived from the potential reduction of the contribution of stochastic fluctuations to the energy resolution of such calorimeters. Our goal in further developing this experimental technique is to reduce the contribution of stochastic fluctuations to the point where these are comparable to the irreducible effects of fluctuations in visible energy. Crystals were believed to offer good opportunities in this respect. However, as the results of this study show, things are not so easy.
For the application of crystals to the dual readout method, the detection of Cherenkov light is the crucial issue and particular care was taken in the precision with which the calorimeter performance can be measured using this signal component. Extracting sufficiently pure Cherenkov signals from these scintillating crystals with the use of optical filters implies a rather severe restriction to short wavelengths. As a consequence, a large fraction of the potentially available Cherenkov photons needs to be sacrificed, but also, the light that does contribute to the Cherenkov signals is strongly attenuated, because of the absorption characteristics of the crystals. As a result, the remaining light yield is such that fluctuations in the detected numbers of photoelectrons become a significant contribution to the em energy resolution. This is an important difference with experiments in which the unfiltered light of such crystals is used for the electromagnetic calorimeter signals.
The conclusion reached after after a long and in-depth study of crystal performances for dual readout calorimetry is that no such significant improvements in term of Cherenkov light yield seem to be offered by crystals in combination with filters in dual-readout calorimeters. The RD52 collaboration decided therefore to focus on the fiber option.
5 Summary and Future Plans
We have proved that the Dual-REAdout Method calorimeter could achieve the high-quality energy measurement for both electromagnetic particles and hadrons. Even, GEANT4 simulation anticipates that the dual-readout calorimeter can have for the stochastic term and very small constant term. This performance will satisfy the important requirement of the future lepton collider, which is the separation of hadronically decaying W/Z bosons. The RD52 collaboration is make effort to build a large size of calorimeter with Cu and will try to prove that it would achieve the excellent energy measurement of hadrons and jets in the future.
The more excellent detector performance, the better physics results we have. We expect that the Dual-REAdout Method calorimeter will be able to achieve the high-precision energy measurement for all fundamental particles and open a new era of experimental particle physics, just as the high purity Germanium crystal detector achieved the excellent energy resolution in the nuclear spectroscopy and showed very detail energy levels of nuclei.
Acknowledgments
We thank CERN for making good particle beams available to our experiments in the H8 beam. This study was carried out with financial support from the United States Department of Energy, under contract DE-FG02-12ER41783, by Italy’s Istituto Nazionale di Fisica Nucleare and Ministero dell’Istruzione, dell’Universitá e della Ricerca, and by the Basic Science Research Program of the National Research Foundation of Korea (NRF), funded by the Ministry of Science, ICT & Future Planning under contract 2015R1C1A1A02036477. In addition, we thank Korea University for the support received by their researchers who contributed to this project.
References
- [1] D. Acosta, et al., Nucl. Instr. and Meth. A 308, 481 (1991).
- [2] N. Akchurin, et al., Nucl. Instr. and Meth. A 536, 29 (2005).
- [3] S. Agostinelli, et al., Nucl. Instr. and Meth. A 506, 250 (2003).
- [4] http://geant4.cern.ch/support/proc_mod_catalog/physics_lists/useCases.shtml.
- [5] N. Akchurin et al. Nucl. Instr. and Meth. A 735 (2014) 120–129
- [6] RD1 collaboration, NIM A337 (1994) 326- 341
- [7] http://fiberopticpof.com/pdfs/Product_Specs/SK40_Product_Information.pdf.
- [8] N. Akchurin et al. Nucl. Instr. and Meth. A 595 (2008) 359
- [9] N. Akchurin et al. Nucl. Instr. and Meth. A A 640 (2011) 91
- [10] N. Akchurin et al. Nucl. Instr. and Meth. A A 638 (2011) 47
- [11] N. Akchurin et al. Nucl. Instr. and Meth. A A 604 (2009) 512, Nucl. Instr. and Meth. A A 621 (2010) 212
- [12] A 582 (2007) 474
- [13] Nucl. Instr. and Meth. A 610 (2009) 488, Nucl. Instr. and Meth. A 686 (2012) 125
- [14] Nucl. Instr. and Meth. A 686 (2012) 125.
- [15] S. Fracchia, Prototypes Studies of fiber calorimetry with dual readout, Master Thesis, Pavia University. 2012