Solar Energetic Particle Events with Protons above 500 MeV between 1995 and 2015 Measured with SOHO/EPHIN
keywords:
Solar Cosmic Rays, Ground Level Enhancement, Solar Energetic Particles1 Introduction
The first solar energetic particle (SEP) event that is now called a ground-level enhancement (GLE) was reported by Forbush (1946). GLEs are large SEP events that are observed by ground based experiments such as neutron monitors (NMs). These detectors measure secondary particles produced when ions with energies above several hundred of MeVs create a nuclear cascade in the Earth’s atmosphere. Since 1942 71 GLEs have been reported (see e.g. https://gle.oulu.fi/) with the largest measured increase above the pre-event background of about 4500% being observed during GLE 5 on February 23, 1956 (Reames, 2013).
In order to fully understand the physics behind the particles resulting in GLEs, the chain of acceleration in the corona, the injection and transport in interplanetary space as well as the propagation through the Earth’s magnetosphere and atmosphere has to be understood. Therefore Mishev, Usoskin, and
Kovaltsov (2013) calculated the atmospheric yield function that describes the relationship between the intensity of protons and -particles near Earth and the neutron monitor count rate showing significant values for proton energies above 700 MeV. In agreement to these findings, investigations by Gopalswamy and
Mäkelä (2014) using GOES measurements of protons with energies above 700 MeV showed a good correlation between the occurrence of above 700 MeV SEPs and GLEs during solar cycle 23 and 24. However in an extended study, Thakur et al. (2016) have reported two exceptions out of the 16 GLEs during solar cycle 23 and 24. The event of 6 May 1998 caused a GLE but did not cause an increase in the above 700 MeV GOES measurements and the 8 November 2000 that caused an increase of above 100% regarding the pre-event background in the GOES channel but no increase in the neutron monitor network.
This dilemma where a solar energetic particle event with a proton intensity increase at energies above 700 MeV observed in the near Earth environment is recorded as a GLE and vice versa does also depend on the measurement capabilities of the available instruments. While NMs are a valuable tool to investigate GLEs, they have several limitations due to the indirect nature of detection. By measuring the count rate of secondary particles at ground created by interactions of high energy particles with the atmosphere, NMs do not provide any direct information regarding the interplanetary spectrum of particles. In addition, the Earth’s magnetosphere and hence the resulting geomagnetic cutoff rigidity (Lockwood and
Debrunner, 1999) can vary over time, further increasing the uncertainties in the analysis of NM data. Therefore, in addition to simulations of these magnetospheric and atmospheric effects, knowledge of the energy spectrum outside of the magnetosphere is required. Recently we showed that the Electron Proton Helium Instrument (EPHIN) is capable to measure proton energy spectra up to 1 GeV (Kühl et al., 2015b, a; Kühl, Gómez-Herrero, and
Heber, 2016; Heber et al., 2015) providing the necessary data for this kind of investigations.
In this work, this new data is used to identify SEP events with protons above 500 MeV during the time period from 1995 to 2015. A detailed comparison with other event lists has been carried out. Furthermore, a statistical analysis of the events based on their spectral properties and of the neutron monitor count rate increase for events resulting in GLEs is presented.
The article is structured as follows, first the instrumentation and data are described prior to the identification of events and the compilation of an event list. Then, a statsistical analysis of the event list by analyzing the proton spectra is presented.
2 Instrumentation and Data
2.1 Validation of High Energy Proton Channels during different Event Phases
The EPHIN instrument (Müller-Mellin
et al., 1995) onboard the Solar and Heliospheric Observatory (SOHO) consists of a stack of six silicon semiconductors labeled A to F surrounded by an anticoincidence. The nominal energy range between 5 and 50 MeV for protons was extended to energies from 100 MeV to above 1 GeV with a method first presented by Kühl et al. (2015b). The method is based on particles that penetrate the entire detector stack, depositing only a fraction of their kinetic energy in the instrument. For these penetrating particles, the energy deposition in the detectors C and D are taken as measurement of the energy losses of these particles. It has been shown that for energy losses in a certain range a reliable particle identification is possible for the penetrating particles. The energy losses can then be converted back to total kinetic energy with an uncertainty between 10 % (at 100 MeV) and 20 % (at 1 GeV, c.f. figure 9 in Kühl et al., 2015b). For a more detailed description of the method, please refer to Kühl et al. (2015b) and Kühl, Gómez-Herrero, and
Heber (2016).
The method has been succesfully validated for the solar energetic particle events on 17 May 2012 and 6 January 2014 (Kühl et al., 2015b). Kühl, Gómez-Herrero, and
Heber (2016) have proven that the method is also applicable in the absence of solar events to derive galactic cosmic ray (GCR) spectra from 250 MeV up to 1.6 GeV.
In this work, the method is used to identify solar energetic particle events with protons accelerated to at least 500 MeV. To apply this method to the entire SEP event, a further validation of the method during the entire solar event (including the rising and declining phases) is necessary since Kühl et al. (2015b) have only calculated event spectra for certain time periods. Since the method reconstructs the energy individually for every particle detected, it provides the opportunity to define any arbitrary energy channel between 100 MeV up to above 1 GeV. Hence, intercalibration and comparison with other missions can be achieved rather easily.
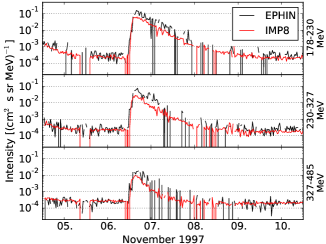
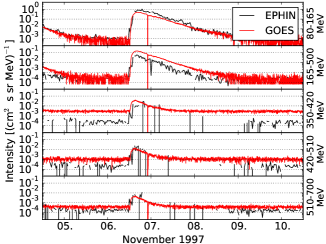
For this purpose, Figure \ireffig:comparison shows the intensity of different energy channels during the 6 November 1997 SEP event (GLE 55) measured by the Goddard Medium Energy Experiment (GME: McGuire, von Rosenvinge, and
McDonald, 1986) onboard Interplanetary Monitoring Platform 8 (IMP-8, left) as well as by the Energetic Particle Sensor (EPS: Onsager et al., 1996) and High Energy Proton and Alpha Detector (HEPAD: Hanser, 2011) onboard GOES-9 (right). In addition, the measured SOHO/EPHIN intensities in the same energy range are shown (black). From the figure, it is evident that all three instruments measure the SEP event and that the intensity-time-profiles are in agreement within a factor of two.
However, EPHIN measures systematical higher intensities around the maximum and in the decay phase of the event when compared to the IMP-8 instrument in all three channels. In contrast, the intensities are in agreement before and after the event. Hence we attribute the differences during the event to the so-called ring switching (for details see Müller-Mellin
et al., 1995).
It is important to note that the pre-event background measured by GOES is an order of magnitude higher than the ones given by EPHIN and the IMP-8 instrument as already described by Sandberg et al. (2014). Furthermore, the 30 minutes averaged data from SOHO/EPHIN have statistical limitations, especially in the decay phase of the event.
2.2 Electron Contamination of the High Energy Proton Measurements
Though Kühl et al. (2015b) have mentioned a possible influence of electron fluxes above 10 MeV on the high energy proton data during solar events, this issue has not been quantified yet.
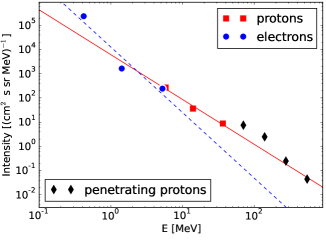
Heber et al. (2015) showed that there are discrepancies in the derived proton spectrum during GLE 69 between SOHO and neutron monitors above 700 MeV while GOES and SOHO agree with each other at lower energies. The increased flux above 700 MeV is believed to be caused by electrons above 10 MeV associated to the same SEP event that cause similar energy losses in the detector compared to those of high energy protons. Therefore, the influence of electrons on the derived proton flux above 700 MeV has to be taken into account and a study of this effect is necessary before a detailed analysis of the spectral properties can be performed.
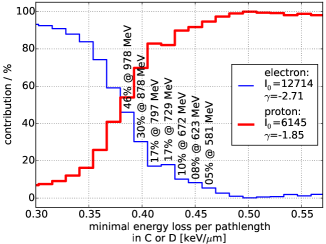
For that purpose, Figure \ireffig:electron (left panel) presents electron (blue circles) and proton (red squares) spectra based on the nominal data products from the EPHIN instrument during the GLE 69 on 20 January 2005 from 0900 – 1100UT. The event has one of the highest electron contributions among those events investigated in this study and can therefore be considered as the worst case scenario. The spectra have been fitted with a power law and have been extrapolated to higher energies. Note that although the derived proton spectra based on the penetrating particles (black diamonds) are in agreement with the power law fitted to the proton spectrum below 50 MeV, a softening in the proton spectrum at higher energies (e.g. a double power law) would increase the electron contribution. Using the fitted spectra as input for a Geometry and Tracking 4 (GEANT4) monte carlo simulation (GEANT4 collaboration, 2006) of the instrument, the contribution of both protons and electrons to energy losses in the C and D detector have been derived. As a result Figure \ireffig:electron (right) shows the contribution of electrons (blue) and protons (red) dependent on the energy loss. For some illustrative energy losses, the electron contribution as well as the proton energy related to that energy loss are shown by the text included in the vertical direction. From the figure, it can be concluded that the electron contribution to the high energy proton spectra is: 1) negligible below 500 MeV, 2) less than 20 % in the energy range from 500 to 800 MeV, and 3) a major contribution above 800 MeV. Hence, proton intensities above 800 MeV should be considered as upper limits during solar events.
3 Identification Method of 500 MeV Proton Events
3.1 Event Detection
In order to identify SEPs with protons accelerated to energies above 500 MeV, a histogram of hourly intensities in a defined 500 – 700 MeV range from 1995 to 2015 is presented in Figure \ireffig:th. The histogram indicates that most of the time, the measured intensity is in the range of (cm2 s sr MeV)-1. In agreement to Kühl, Gómez-Herrero, and
Heber (2016), these intensities correspond to the GCR background. The variation of the peak position over different years as indicated by annual histograms can be explained by solar modulation (Heber and Potgieter, 2006; Heber, Fichtner, and
Scherer, 2006). While intensities below this main population correspond to either GCR depressions during the passages of interplanetary coronal mass ejections (forbush decreases, Cane, 2000) or instrumental effects such as a high deadtime of the electronics, higher intensities are related to SEPs.
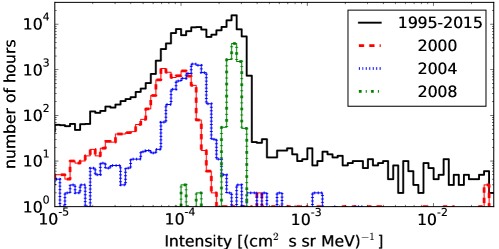
In this study, events have been identified by requiring that at least two hourly averaged intensities in a six-hour interval are above a threshold of (cm2 s sr MeV)-1. Using this identification technique, 42 solar particle events in the time between start of the mission (December 1995) and 1 October 2015 have been identified. It has to be noted that communication with SOHO was lost for several months during 1998 and, hence, no EPHIN data is available for this time period.
3.2 The Event List
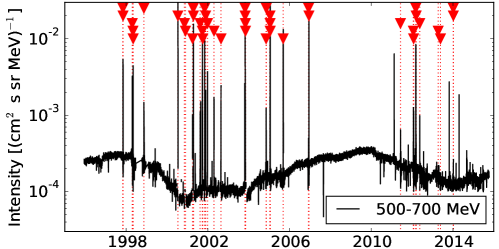
Figure \ireffig:dates presents the time profile of the proton intensity in the energy range from 500 to 700 MeV over the last 20 years. In agreement to Figure \ireffig:th, the variation of the GCR background intensity lies between 0.7 and 4 (cm2 s sr MeV)-1 over Solar Cycles 23 and 24. The dates of the events identified in this study are marked as red triangles. Note that some intensity increases shown in the figure were not selected as events since they were caused by photons from the flare (extreme-ultraviolet to hard X-rays range) depositing energy in the detector stack. Since these photon peaks are usually short lived they do not increase the intensity over two hours and are therefore not identified by the algorithm. From the 42 events, 32 events occured during Solar Cycle 23 and only ten in Solar Cycle 24. As expected, the occurence of the solar events is clearly more likely during solar maxima (around 2002 and 2014, Nymmik, 1999).
The dates and times when the events passed the threshold are listed in columns two and three of Table \ireftab:events. Note that these numbers mark the time when the event was identified by the algorithm and they should not be confused with onset times. The onset times are derived in the next section. Columns five to eight give the corresponding events from other studies, namely GLEs (taken from http://gle.oulu.fi/), SEPServer (Vainio et al., 2013), GOES (major sep list, http://cdaw.gsfc.nasa.gov/CME˙list/sepe/), and Gopalswamy
et al. (2015), respectively. The exact times of the GLEs were taken from the Neutron Monitor Database (NMDB, http://www.nmdb.eu/nest/gle˙list.php). The GLE 68 is listed at 00:00 UT by the NMDB while Cliver (2006) relates the GLE to a flare peaking at 09:52 UT. Hence, for this event, the time from Cliver (2006) was adopted.
The events N035, N036 and N041 are listed as Sub-GLEs in the Oulu GLE database (https://gle.oulu.fi/) and the event N042 was suggested to be a GLE by Thakur et al. (2014). However, they are not officially confirmed to be GLEs and therefore they are not marked as GLEs in our table.
From the table, it is evident that the 42 events include all GLEs during the SOHO age (GLE 55 to GLE 72) with exception of GLE 58, during which SOHO had a data gap. Since GLEs are known to be caused by events during which particles are accelerated to above 500 MeV (Cliver et al., 1983; Plainaki et al., 2009; Shen et al., 2013), this is a validation of the event identification method.
Regarding the fact, that the SEPServer list is based on data from 1996 to 2010, it does also include the majority of the events found in this study. The GOES list features every single event found in this study. Gopalswamy
et al. (2015) have derived a list of 37 large solar events for Solar Cycle 24 that occurred until the end of 2014. Only ten of those events were detected by our method, suggesting that the other 27 events did not accelerate protons to energies above 500 MeV. In their analysis, Gopalswamy
et al. (2015) identified eight GLE candidates from their list. From those eight events, only three are found to have increased fluxes above 500 MeV based on this study (events N033, N038 and N040).
| N0 | Date | Time | Onset | GLE N0 | SEPS | GOES | Gopalswamy |
|---|---|---|---|---|---|---|---|
| 01 | 1997-11-04 | 15:00 | 06:00 | - | 2 | 1 | - |
| 02 | 1997-11-06 | 13:00 | 12:45 | 55 | 3 | 2 | - |
| 03 | 1998-04-20 | 20:00 | - | - | 6 | 3 | - |
| 04 | 1998-05-02 | 18:00 | 15:00 | 56 | 7 | 4 | - |
| 05 | 1998-05-06 | 13:00 | 08:30 | 57 | 8 | 5 | - |
| 06 | 1998-11-14 | 09:00 | 06:15 | - | 12 | 11 | - |
| 07 | 2000-07-14 | 12:00 | 10:30 | 59 | 32 | 21 | - |
| 08 | 2000-11-09 | 01:00 | 23:30p | - | 38 | 28 | - |
| 09 | 2000-11-26 | 18:00 | - | - | - | 30 | - |
| 10 | 2001-04-03 | 04:00 | 01:00 | - | 45 | 33 | - |
| 11 | 2001-04-15 | 16:00 | 15:00 | 60 | 49 | 36 | - |
| 12 | 2001-04-18 | 04:00 | 02:45 | 61 | 50 | 37 | - |
| 13 | 2001-08-16 | 03:00 | 00:30 | - | - | 42 | - |
| 14 | 2001-09-24 | 23:00 | 14:00 | - | 58 | 44 | - |
| 15 | 2001-10-01 | 22:00 | - | - | 59 | 45 | - |
| 16 | 2001-11-04 | 17:00 | 16:30 | 62 | 63 | 48 | - |
| 17 | 2001-11-23 | 05:00 | 21:00p | - | 64 | 51 | - |
| 18 | 2001-12-26 | 07:00 | 06:30 | 63 | 65 | 52 | - |
| 19 | 2002-04-21 | 06:00 | 02:00 | - | 72 | 63 | - |
| 20 | 2002-08-24 | 04:00 | 02:15 | 64 | 80 | 71 | - |
| 21 | 2003-10-28 | 13:00 | 14:00 | 65 | 88 | 78 | - |
| 22 | 2003-10-29 | 22:00 | 21:15 | 66 | - | 79 | - |
| 23 | 2003-11-02 | 20:00 | 17:15 | 67 | 90 | 81 | - |
| 24 | 2003-11-05 | 06:00 | 02:00 | - | - | 82 | - |
| 25 | 2004-11-07 | 21:00 | 15:45 | - | 97 | 90 | - |
| 26 | 2004-11-10 | 11:00 | 03:15 | - | 99 | 92 | - |
| 27 | 2005-01-16 | 14:00 | - | - | 101 | 93 | - |
| 28 | 2005-01-17 | 16:00 | 13:45 | 68 | - | 94 | - |
| 29 | 2005-01-20 | 09:00 | 06:45 | 69 | - | 95 | - |
| 30 | 2005-09-08 | 20:00 | - | - | - | 102 | - |
| 31 | 2006-12-06 | 23:00 | - | - | - | 104 | - |
| 32 | 2006-12-13 | 04:00 | 03:00 | 70 | 112 | 105 | - |
| 33 | 2011-06-07 | 09:00 | 07:15 | - | - | 110 | 4 |
| 34 | 2012-01-23 | 12:00 | 05:30 | - | - | 115 | 9 |
| 35 | 2012-01-28 | 04:00 | 18:30p | - | - | 116 | 10 |
| 36 | 2012-03-07 | 04:00 | - | - | - | 117 | 11 |
| 37 | 2012-03-13 | 19:00 | 17:45 | - | - | 118 | 12 |
| 38 | 2012-05-17 | 03:00 | 01:45 | 71 | - | 119 | 13 |
| 39 | 2013-04-11 | 12:00 | 07:45 | - | - | 131 | 25 |
| 40 | 2013-05-22 | 20:00 | 14:00 | - | - | 133 | 27 |
| 41 | 2014-01-06 | 10:00 | - | - | - | 137 | 31 |
| 42 | 2014-01-08 | 00:00 | 21:00p | - | - | 138 | 32 |
4 Statistical Event Analysis
4.1 Onset Times
| lower bin edge [MeV] | 49 | 78 | 124 | 195 | 308 | 486 | 766 | 1207 |
| upper bin edge [MeV] | 78 | 124 | 195 | 308 | 486 | 766 | 1207 | 1903 |
| geometric mean [MeV] | 62 | 98 | 155 | 245 | 387 | 610 | 962 | 1516 |
For a study of the spectral properties of the events, only those events, for which an onset time based on a 100 to 1000 MeV proton channel could be derived, were taken into account. The chosen broader energy interval in comparison to the 500 to 700 MeV interval allows onset determination with a time resolution of 15 minutes. For 34 of the 42 events it was possible to derive the onset time by requiring an intensity increase above a threshold defined as the average intensity during the previous six hours plus three times the standard deviation of that time interval. These 34 events include all GLEs and Sub-GLEs except for event N041 since EPHIN had a datagap during the early stage of the event (Kühl et al., 2015b). Hence, no onset could be determined for this event and it is not included in the following analysis. All determined onset times are listed in column four of Table \ireftab:events.
4.2 Event Spectra
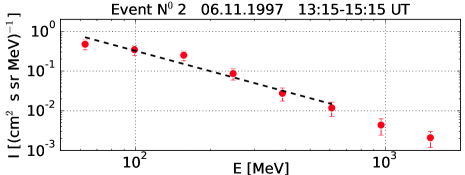
Since the statistics of EPHIN data for the event N025 are limited, it was excluded from the following study, although an onset time was derived. For the remaining 33 events, the high energy proton spectrum has been calculated in a time interval of two hours starting 30 minutes after the onset. The time lag of 30 minutes is necessary in order to reflect the different travel times of 100 MeV and 1000 Mev protons. While the latter can reach the spacecraft after roughly ten minutes (depending on the length of the Parker spiral and the diffusion in the interplanetary medium), the 100 MeV protons can be delayed by up to half an hour due to their lower velocity. The interval length of two hours was selected for statistical reasons. As an example, Figure \ireffig:spectra shows the derived spectrum for event N02 (GLE 55). In the figure, the geometric mean of the energy range is shown. The exact energy bins are given in Table \ireftab:bins.
Mewaldt
et al. (2012) have shown that the proton spectra of GLE events can be reproduced by a double-power law (described by Band et al., 1993) with a spectral break at several MeV. Since we only analyze energies above 100 MeV, a single power law function
| (1) |
where and are measured in [(cm2 s sr MeV)-1] and , in [MeV], has been fitted for every single event. Based on the approximation of the electron contribution described above (c.f. Figure \ireffig:electron), only energies below 800 MeV have been taken into account for the fit due to possible electron contamination at higher energies. As an example, the fit for event N02 is shown in Figure \ireffig:spectra.
Table \ireftab:fit presents the spectral indices [] and intensities at 500 MeV [I500] resulting from the fits of the 33 events. The fit was performed as a linear regression between the logarithm of the energy and the logarithm of the intensity. Hence, the goodness of the fits can be represented by the adjusted coefficient of determination [R2] which is also given in Table \ireftab:fit.
| N0 | [I500] | R2 | N0 | [I500] | R2 | ||
|---|---|---|---|---|---|---|---|
| 01 | -2.200.16 | (8.771.00) e-4 | 0.97 | 21 | -3.150.25 | (2.070.15) e-2 | 0.97 |
| 02 | -1.700.24 | (2.080.33) e-2 | 0.95 | 22 | -2.490.11 | (3.700.15) e-2 | 1.00 |
| 04 | -2.120.15 | (2.310.21) e-3 | 0.96 | 23 | -2.700.22 | (1.500.11) e-2 | 0.98 |
| 05 | -2.840.26 | (1.150.12) e-3 | 0.93 | 24 | -2.670.17 | (3.450.30) e-4 | 0.98 |
| 06 | -2.440.24 | (1.520.18) e-3 | 0.91 | 26 | -1.510.11 | (9.921.94) e-4 | 0.97 |
| 07 | -2.240.15 | (1.740.11) e-1 | 0.97 | 28 | -3.200.08 | (6.120.14) e-3 | 0.93 |
| 08 | -2.780.31 | (1.320.14) e-1 | 0.97 | 29 | -2.120.13 | (2.530.14) e-1 | 0.99 |
| 10 | -3.240.12 | (5.590.23) e-4 | 0.98 | 32 | -1.950.15 | (3.560.26) e-2 | 0.98 |
| 11 | -2.130.03 | (7.770.10) e-2 | 0.99 | 33 | -1.830.31 | (9.853.15) e-4 | 0.85 |
| 12 | -2.010.12 | (3.790.31) e-3 | 0.97 | 34 | -3.780.40 | (2.450.27) e-4 | 0.78 |
| 13 | -2.570.09 | (2.380.10) e-3 | 0.99 | 35 | -2.220.24 | (1.650.25) e-3 | 0.93 |
| 14 | -3.300.33 | (4.390.47) e-4 | 0.93 | 37 | -2.750.25 | (1.840.18) e-3 | 0.94 |
| 16 | -2.900.20 | (1.060.07) e-2 | 0.98 | 38 | -1.870.17 | (4.470.57) e-3 | 0.97 |
| 17 | -2.220.05 | (5.550.21) e-4 | 1.00 | 39 | -2.190.09 | (3.400.26) e-4 | 0.99 |
| 18 | -3.210.07 | (5.390.11) e-3 | 0.99 | 40 | -2.930.19 | (5.550.43) e-4 | 0.92 |
| 19 | -3.840.10 | (2.350.06) e-3 | 0.97 | 42 | -3.600.03 | (4.930.04) e-4 | 1.00 |
| 20 | -2.580.08 | (4.410.15) e-3 | 1.00 |
4.3 Statistical Analysis of 500 MeV Proton Events
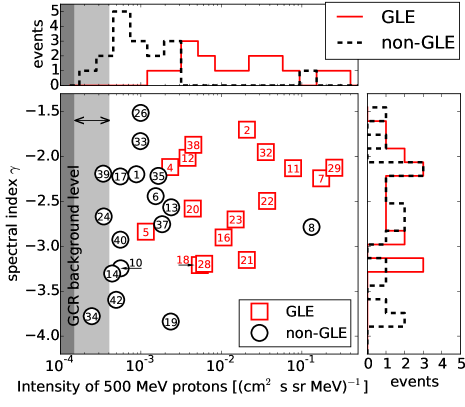
In Figure \ireffig:fitparas the spectral index of the analyzed events is shown as a function of the proton intensity at 500 MeV derived from the proton spectra fit. GLEs are shown as red squares, the remaining events as black circles. The numbers in the symbols correspond to those in Tables \ireftab:events and \ireftab:fit. The dark grey and light grey shaded area correspond to the varying GCR background level at 500 MeV during solar maximum and solar minimum, respectively (c.f. Figure \ireffig:th). At the top and on the right hand side of the figure, histograms of both quantities are also shown individually.
The fit results of events N024, N034 and N039 show that the proton intensity at the energy of 500 MeV is slightly lower than the threshold used for the event identification based on the 500 – 700 MeV channel. This can be explained by statistical errors of both, the channel intensity and the fit results. However, it should be noted that these events occured during solar maximum and hence these events could still have caused an increase above the GCR background.
Event N008 shows a much higher intensity as well as a similar spectral index compared to several GLEs and, yet, does not show any increases in the neutron monitor count rates which is in agreement with to findings of Thakur et al. (2016). Hence, this event is of special interest in terms of understanding which physical processes determine whether or not a SEP event with a certain spectral shape is observed by the neutron monitor network. Therefore, an extensive study using not only the spectral data at high energies but also simulations of the asymptotic viewing directions of neutron monitors is in preparation.
The majority of the GLEs feature spectral indices uniformly distributed between and , which is in good agreement with the results from Mewaldt
et al. (2012). The spectral indices of events not related to GLEs are also uniformly distributed, but in a wider range between and . The spectral index of event N020 (=-2.58) is identical with the findings to Tylka et al. (2006).
However, the intensity of 500 MeV proton is typically higher during GLE related events than during events without GLEs. Furthermore, this intensity is above (cm2 s sr MeV)-1 for all GLEs (except for event N05), which is consistent with results from Nitta et al. (2012). In their study, they showed that the GOES HEPAD P9 channel (420 – 510 MeV) usually exceeds (cm2 s sr MeV)-1 during GLEs with only GLE 57 and GLE 68, corresponding to events N005 and N028 in our list, having lower fluxes. Thakur et al. (2016) also found GLE 57 to be an especially small event. While the results of this work do confirm the results of previous studies regarding the small intensity of GLE 57, the intensity of GLE 68 is found to be higher compared to the results of Nitta et al. (2012). However, in their study Nitta et al. (2012) noted that the onset determination and hence the analysis of this particular event is troublesome.
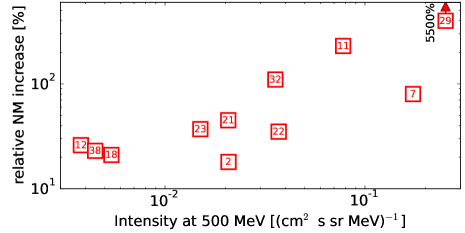
The five GLEs with the highest flux in our analysis (events N029, N007, N011, N022, N032 corresponding to GLEs 69, 59, 60, 66, 70) are also considered to be among the largest GLEs in the SOHO era (c.f. Table 1 in McCracken, Moraal, and
Shea, 2012). The relative increases in neutron monitor count rate for GLEs given by McCracken, Moraal, and
Shea (2012) are shown as function of the intensity at 500 MeV derived in this study in Figure \ireffig:i500_nm. Some GLEs from Table \ireftab:events are not shown here, as they have not been investigated by McCracken, Moraal, and
Shea (2012). The figure indicates a correlation between the intensity at 500 MeV and the relative increase in NM count rate with the exception of the events with intensities below (cm2 s sr MeV)-1 (Events N012, N018 and N038) as well as event N029, which has a significant higher increase in NM count rate compared to the measured intensity at 500 MeV. Furthermore, it has to be noted that the scattering of the relative NM increase for a given intensity at 500 MeV is rather large. The reasons for these deviations remain unclear especially since the spectral shape of the events (e.g. the fitted ) are rather similar for most of them (c.f. Figure \ireffig:fitparas). Possible explanations are the asymptotic viewing direction of each neutron monitor (McCracken and Freon, 1962; Smart, Shea, and
Flückiger, 2000) or changes in the cutoff rigidities due to geomagnetic disturbances during the SEP events (Danilova, 1999) which may differ from event to event.
5 Summary
In this study, SEP events with protons with energies above 500 MeV have been investigated based on the extended measurement range of SOHO/EPHIN described by Kühl et al. (2015b) and Kühl, Gómez-Herrero, and
Heber (2016).
We have shown that the new and unique data product is valid during any stage of the solar event (e.g. onset, maximum and decay phase) by comparison with results from IMP8 and GOES. Furthermore, additional simulations of the instrument have shown that the electron contribution to the high energy proton data is: 1) negligible below 500 MeV, 2) less than 20% between 500 and 800 MeV, and 3) seriously uncertain above 800 MeV.
Using the energy interval from 500 to 700 MeV, 42 SEP events with protons accelerated to above 500 MeV have been identified during the last 20 years of the SOHO mission. The compiled event list (see Table \ireftab:events) has been compared to various other event lists including the GLE list.
For events with clear onset times the proton intensity spectra was derived in a time interval of two hours starting 30 minutes after the onset time. The spectral indices [] derived from the power law fit in the energy range below 800 MeV and the intensity at 500 MeV of the events have been compared (see Figure \ireffig:fitparas and Table \ireftab:fit).
Based on this comparison, various results from the literature such as typical intensity increases above (cm2 s sr MeV)-1 at 500 MeV (Nitta et al., 2012) were validated. Furthermore, certain non-GLE and GLE events with surprisingly high and low intensity respectively were found in agreement with Thakur et al. (2016).
Comparing the derived intensities at 500 MeV with the relative increase of the neutron monitor count rates during GLEs (McCracken, Moraal, and
Shea, 2012), a clear correlation has been found with exception of events with very small intensity at 500 MeV as well as GLE 69, which shows a particular large increase in neutron monitor count rate.
Acknowledgments
The SOHO/EPHIN project is supported under Grant 50 OC 1302 by the German Bundesministerium für Wirtschaft through the Deutsches Zentrum für Luft- und Raumfahrt (DLR).
This project has received funding from the European Union’s Horizon 2020 research and innovation programme under grant agreement No 637324.
This work was carried out within the framework of the bilateral BMBF-NRF-project ’Astrohel’ (01DG15009) funded by the Bundesministerium für Bildung und Forschung. The responsibility of the contents of this work is with the authors.
Disclosure of Potential Conflicts of Interest
The authors declare that they have no conflicts of interest.
References
- Band et al. (1993) Band, D., Matteson, J., Ford, L., Schaefer, B., Palmer, D., Teegarden, B., Cline, T., Briggs, M., Paciesas, W., Pendleton, G., Fishman, G., Kouveliotou, C., Meegan, C., Wilson, R., Lestrade, P.: 1993, BATSE observations of gamma-ray burst spectra. I - Spectral diversity. ApJ 413, 281. DOI.
- Cane (2000) Cane, H.V.: 2000, Coronal Mass Ejections and Forbush Decreases. Space Sci. Rev. 93, 55. DOI.
- Cliver (2006) Cliver, E.W.: 2006, The Unusual Relativistic Solar Proton Events of 1979 August 21 and 1981 May 10. ApJ 639, 1206. DOI.
- Cliver et al. (1983) Cliver, E.W., Kahler, S.W., Cane, H.V., Koomen, M.J., Michels, D.J., Howard, R.A., Sheeley, N.R. Jr.: 1983, The GLE-associated flare of 21 August, 1979. Sol. Phys. 89, 181. DOI. ADS.
- Danilova (1999) Danilova, O.: 1999, The GLE of May 2, 1998: An Effect of Disturbed Magnetosphere on Solar Cosmic Rays. Int. Cosmic Ray Conf. 6, 399. ADS.
- Forbush (1946) Forbush, S.E.: 1946, Three Unusual Cosmic-Ray Increases Possibly Due to Charged Particles from the Sun. Phys. Rev. 70, 771. DOI.
- GEANT4 collaboration (2006) GEANT4 collaboration: 2006, An object-oriented toolkit for simulation in hep. CERN-LHCC 98-44, see also: http://geant4.cern.ch/.
- Gopalswamy and Mäkelä (2014) Gopalswamy, N., Mäkelä, P.: 2014, Latitudinal Connectivity of Ground Level Enhancement Events. In: Hu, Q., Zank, G.P. (eds.) Outstanding Problems in Heliophysics: From Coronal Heating to the Edge of the Heliosphere, Astron. Soc. Pacific C.S. 484, 63. ADS.
- Gopalswamy et al. (2015) Gopalswamy, N., Mäkelä, P., Yashiro, S., Xie, H., Akiyama, S., Thakur, N.: 2015, High-energy solar particle events in cycle 24. J. Phys. C.S. 642(1), 012012. DOI.
- Hanser (2011) Hanser, F.A.: 2011, Tech. rep. goesn-eng-048d. EPS/HEPAD calibration and data handbook [available at www.ngdc.noaa.gov/stp/satellite/goes/documentation.html]. DOI. www.ngdc.noaa.gov/stp/satellite/goes/documentation.html.
- Heber and Potgieter (2006) Heber, B., Potgieter, M.S.: 2006, Cosmic Rays at High Heliolatitudes. Space Sci. Rev. 127, 117. DOI. ADS.
- Heber, Fichtner, and Scherer (2006) Heber, B., Fichtner, H., Scherer, K.: 2006, Solar and Heliospheric Modulation of Galactic Cosmic Rays. Space Sci. Rev. 125, 81. DOI. ADS.
- Heber et al. (2015) Heber, B., Dresing, N., Herbst, K., Klassen, A., Kühl, P., Gómez-Herrero, R.: 2015, Proton energy spectra during ground level enhancements as measured by EPHIN aboard SOHO. Proc. Sci. ICRC2015.
- Kühl, Gómez-Herrero, and Heber (2016) Kühl, P., Gómez-Herrero, R., Heber, B.: 2016, Annual Cosmic Ray Spectra from 250 MeV up to 1.6 GeV from 1995 - 2014 Measured with the Electron Proton Helium Instrument onboard SOHO. Sol. Phys. 291, 965. DOI.
- Kühl et al. (2015a) Kühl, P., Dresing, N., Gieseler, J., Heber, B., Klassen, A.: 2015a, Galactic Cosmic Ray Spectra During Solar Cycle 23 and 24 - Measurement Capabilities of the Electron Proton Helium Instrument. Proc. of Sci. ICRC2015.
- Kühl et al. (2015b) Kühl, P., Banjac, S., Dresing, N., Gómez-Herrero, R., Heber, B., Klassen, A., et al.: 2015b, Proton intensity spectra during the solar energetic particle events of May 17, 2012 and January 6, 2014. A&A 576, A120. DOI. ADS.
- Lockwood and Debrunner (1999) Lockwood, J.A., Debrunner, H.: 1999, Solar flare particle measurements with neutron monitors. Space Sci. Rev. 88, 483. DOI. ADS.
- McCracken and Freon (1962) McCracken, K.G., Freon, A.: 1962, Asymptotic Directions and Cut-Off Rigidities in the Geomagnetic Field. J. Phys. Soc. Japan Supp. 17, 455. ADS.
- McCracken, Moraal, and Shea (2012) McCracken, K.G., Moraal, H., Shea, M.A.: 2012, The high-energy impulsive ground-level enhancement. ApJ 761, 101. DOI.
- McGuire, von Rosenvinge, and McDonald (1986) McGuire, R.E., von Rosenvinge, T.T., McDonald, F.B.: 1986, The composition of solar energetic particles. ApJ 301, 938. DOI.
- Mewaldt et al. (2012) Mewaldt, R.A., Looper, M.D., Cohen, C.M.S., Haggerty, D.K., Labrador, A.W., Leske, R.A., Mason, G.M., Mazur, J.E., von Rosenvinge, T.T.: 2012, Energy Spectra, Composition, and Other Properties of Ground-Level Events During Solar Cycle 23. Space Sci. Rev. 171, 97. DOI.
- Mishev, Usoskin, and Kovaltsov (2013) Mishev, A.L., Usoskin, I.G., Kovaltsov, G.A.: 2013, Neutron monitor yield function: New improved computations. J. Geophys. Res. (Space Physics) 118, 2783. DOI. ADS.
- Müller-Mellin et al. (1995) Müller-Mellin, Kunow, H., Fleißner, V., Pehlke, E., Rode, E., Röschmann, N., et al.: 1995, Costep - comprehensive suprathermal and energetic particle analyser. Solar Physics 162, 483.
- Nitta et al. (2012) Nitta, N.V., Liu, Y., DeRosa, M.L., Nightingale, R.W.: 2012, What Are Special About Ground-Level Events?. Flares, CMEs, Active Regions and Magnetic Field Connection. Space Sci. Rev. 171, 61. DOI. ADS.
- Nymmik (1999) Nymmik, R.: 1999, Relationships among solar activity SEP occurrence frequency, and solar energetic particle event distribution function. Int. Cosmic Ray Conf. 6, 280. ADS.
- Onsager et al. (1996) Onsager, T., Grubb, R., Kunches, J., Matheson, L., Speich, D., Zwickl, R.W., Sauer, H.: 1996, Operational uses of the GOES energetic particle detectors. In: Washwell, E.R. (ed.) GOES-8 and Beyond, Proc. SPIE 2812, 281. DOI.
- Plainaki et al. (2009) Plainaki, C., Mavromichalaki, H., Belov, A., Eroshenko, E., Yanke, V.: 2009, Modeling the solar cosmic ray event of 13 December 2006 using ground level neutron monitor data. Adv. Space Res. 43, 474. DOI. ADS.
- Reames (2013) Reames, D.V.: 2013, The Two Sources of Solar Energetic Particles. Space Sci. Rev. 175, 53. DOI. ADS.
- Sandberg et al. (2014) Sandberg, I., Jiggens, P., Heynderickx, D., Daglis, I.A.: 2014, Cross calibration of NOAA GOES solar proton detectors using corrected NASA IMP-8/GME data. Geophys. Res. Lett. 41, 4435. DOI. ADS.
- Shen et al. (2013) Shen, C., Li, G., Kong, X., Hu, J., Sun, X.D., Ding, L., Chen, Y., Wang, Y., Xia, L.: 2013, Compound Twin Coronal Mass Ejections in the 2012 May 17 GLE Event. ApJ 763, 114. DOI. ADS.
- Smart, Shea, and Flückiger (2000) Smart, D.F., Shea, M.A., Flückiger, E.O.: 2000, Magnetospheric Models and Trajectory Computations. Space Sci. Rev. 93, 305. DOI. ADS.
- Thakur et al. (2014) Thakur, N., Gopalswamy, N., Xie, H., Mäkelä, P., Yashiro, S., Akiyama, S., Davila, J.M.: 2014, Ground Level Enhancement in the 2014 January 6 Solar Energetic Particle Event. ApJ 790, L13. DOI. ADS.
- Thakur et al. (2016) Thakur, N., Gopalswamy, N., Mäkelä, P., Akiyama, S., Yashiro, S., Xie, H.: 2016, Two Exceptions in the Large SEP Events of Solar Cycles 23 and 24. Sol. Phys. 291, 513. DOI.
- Tylka et al. (2006) Tylka, A.J., Cohen, C.M.S., Dietrich, W.F., Lee, M.A., Maclennan, C.G., Mewaldt, R.A., Ng, C.K., Reames, D.V.: 2006, A Comparative Study of Ion Characteristics in the Large Gradual Solar Energetic Particle Events of 2002 April 21 and 2002 August 24. The Astrophysical Journal Supplement Series 164, 536. DOI. ADS.
- Vainio et al. (2013) Vainio, R., Valtonen, E., Heber, B., Malandraki, O.E., Papaioannou, A., Klein, K.-L., et al.: 2013, The first SEPServer event catalogue ~68-MeV solar proton events observed at 1 AU in 1996-2010. J. Space Weather Space Clim. 3(27), A12. DOI.